

Key Insights
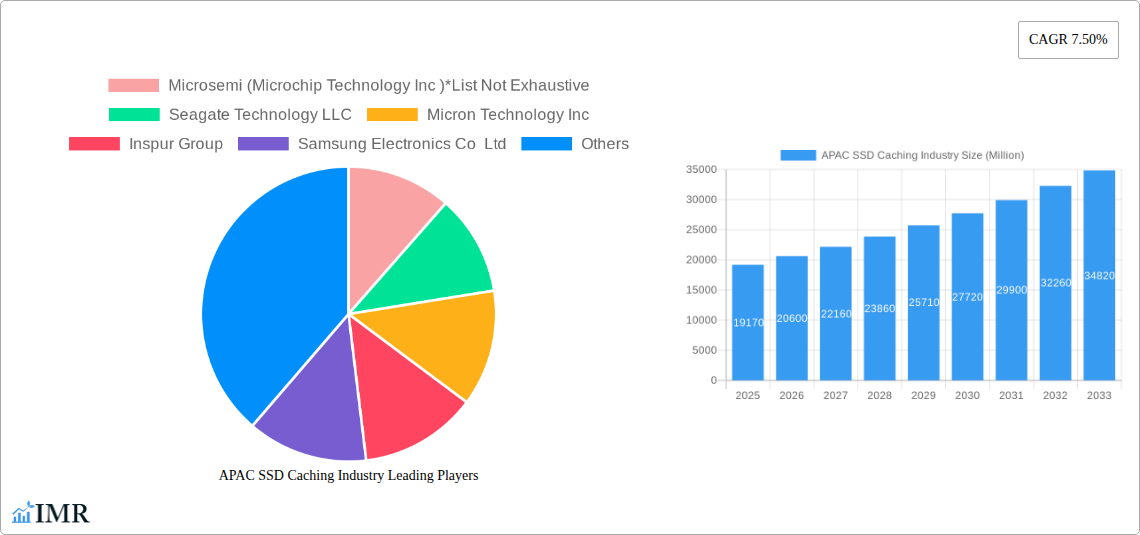
The Asia-Pacific (APAC) Solid State Drive (SSD) caching market is experiencing robust growth, projected to reach \$19.17 billion by 2025 and maintain a Compound Annual Growth Rate (CAGR) of 7.50% from 2025 to 2033. This expansion is driven by several key factors. Firstly, the increasing adoption of cloud computing and big data analytics within enterprises necessitates faster data access speeds, making SSD caching a crucial component of infrastructure upgrades. Secondly, the rising demand for high-performance computing in diverse sectors such as finance, healthcare, and gaming fuels this market growth. Furthermore, the proliferation of data centers across major APAC economies like China, Japan, South Korea, and India is further contributing to the demand for efficient data storage and retrieval solutions. The segment breakdown reveals a significant contribution from the enterprise storage application, driven by large-scale data management needs. However, the personal storage segment is also exhibiting growth, fueled by the rising adoption of high-performance computing devices among consumers. Leading players like Seagate, Micron, Samsung, and Western Digital are actively competing in this dynamic market, driving innovation and price competitiveness.
The competitive landscape within the APAC SSD caching market is characterized by both established players and emerging technology providers. The presence of major global players ensures technological advancements and ensures a steady supply. However, regional players are also emerging, particularly in China, leveraging local expertise and cost advantages to capture market share. While restraints such as the initial high cost of implementation and the need for specialized expertise can hinder widespread adoption, the long-term benefits in terms of improved performance and efficiency are likely to outweigh these concerns. The forecast period (2025-2033) promises continued expansion, driven by ongoing technological advancements and increasing demand from various industries. Growth will likely be particularly strong in regions experiencing rapid digital transformation and infrastructure development.
APAC SSD Caching Industry Market Report: 2019-2033
This comprehensive report provides an in-depth analysis of the Asia-Pacific (APAC) Solid State Drive (SSD) caching market, encompassing market dynamics, growth trends, key players, and future projections. The study period covers 2019-2033, with 2025 as the base year and a forecast period of 2025-2033. The report analyzes the parent market (Data Storage) and child market (SSD Caching) to provide a holistic view of the industry's growth trajectory. Market size is presented in million units.
APAC SSD Caching Industry Market Dynamics & Structure
The APAC SSD caching market exhibits a moderately consolidated structure, with key players like Samsung Electronics, Western Digital, and Kioxia holding significant market share. However, the presence of several regional players and emerging startups fosters competition. Technological innovation, driven by advancements in NVMe technology and increasing demand for high-performance storage solutions, is a primary growth driver. Favorable government policies promoting digitalization across the region further boost the market. Regulatory frameworks related to data security and privacy influence market practices. HDDs and other caching technologies serve as competitive substitutes, but SSD caching's superior performance and reliability are proving increasingly attractive. The end-user demographics are diverse, encompassing enterprises, small and medium businesses (SMBs), and individual consumers. M&A activity within the APAC SSD caching market has been moderate in recent years (xx deals in the past 5 years), primarily focused on strategic acquisitions to enhance technology portfolios and expand market reach.
- Market Concentration: Moderately consolidated, with top 5 players holding approximately xx% market share in 2024.
- Technological Innovation: NVMe technology advancements, focus on low latency, high throughput solutions.
- Regulatory Frameworks: Data privacy regulations influence product development and data security features.
- Competitive Substitutes: HDDs, other caching technologies (e.g., RAM-based caching).
- End-User Demographics: Enterprises, SMBs, individual consumers (with enterprises driving majority of the demand).
- M&A Trends: Moderate activity, focused on strategic acquisitions for technology enhancement and market expansion.
APAC SSD Caching Industry Growth Trends & Insights
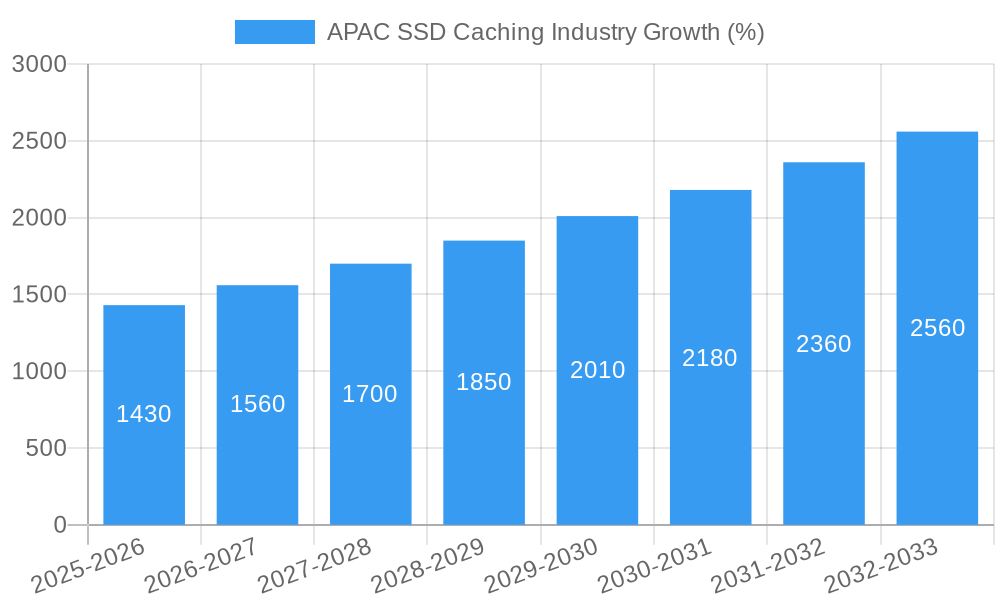
The APAC SSD caching market has witnessed significant growth during the historical period (2019-2024), driven by increasing data volumes, the proliferation of cloud computing, and the rising adoption of high-performance computing applications. The market size expanded from xx million units in 2019 to xx million units in 2024, registering a CAGR of xx%. This growth trajectory is expected to continue during the forecast period (2025-2033), fueled by several factors including the increasing adoption of NVMe SSDs, the growing demand for faster data access speeds, and government initiatives promoting digital transformation. Consumer behavior is shifting towards higher storage capacity and performance, which further drives demand for SSD caching solutions. Technological disruptions in the form of advancements in NAND flash memory and controller technology are enhancing the performance and affordability of SSDs. Market penetration is currently at xx% and is projected to reach xx% by 2033.
Dominant Regions, Countries, or Segments in APAC SSD Caching Industry
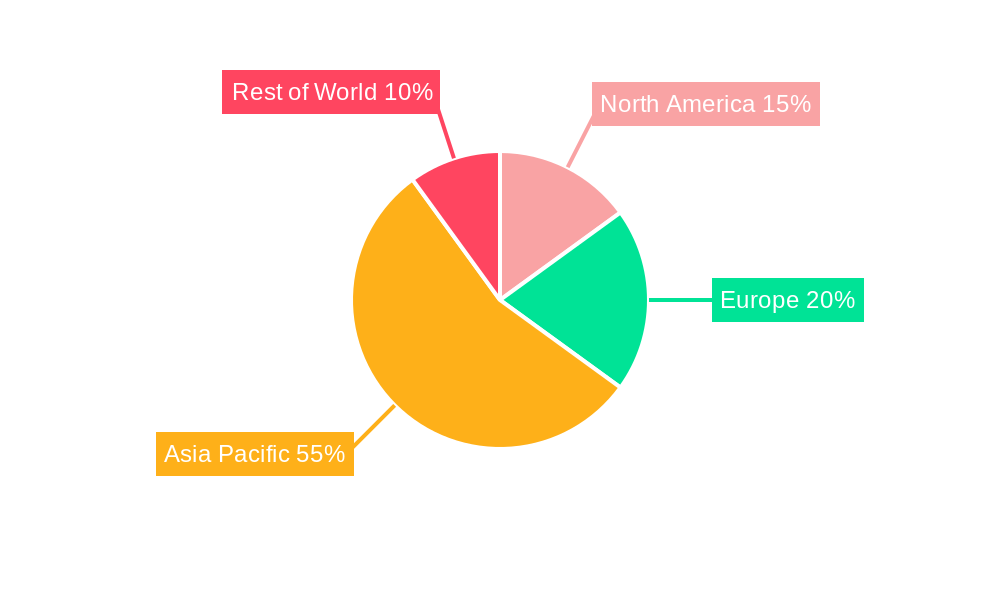
China dominates the APAC SSD caching market, driven by its robust IT infrastructure, rapid economic growth, and a large base of data centers. The country accounts for approximately xx% of the regional market share in 2024. India and South Korea are also experiencing substantial growth due to increased investments in data centers and digital infrastructure. Japan's mature market is characterized by a focus on high-end, enterprise-grade solutions.
- By Application: Enterprise storage currently holds a larger market share (xx%) compared to personal storage (xx%), driven by the increasing need for high-performance storage in data centers and cloud environments.
- By Country:
- China: Largest market share due to substantial investments in data centers and digital infrastructure.
- India: Rapidly growing market driven by increasing demand from various industries, particularly IT and BFSI.
- South Korea: Strong growth fueled by the country's advanced technological infrastructure and adoption of high-performance computing.
- Japan: Mature market with a focus on high-end, enterprise-grade solutions.
- Rest of APAC: Moderate growth influenced by variable economic conditions and digital adoption rates across the region.
APAC SSD Caching Industry Product Landscape
The APAC SSD caching market offers a diverse range of products catering to various needs. Products range from low-capacity SSDs for personal use to high-capacity, enterprise-grade NVMe SSDs for data centers. Key features include enhanced performance metrics (e.g., low latency, high IOPS), improved reliability, and enhanced data security capabilities. Unique selling propositions include proprietary controller technology, advanced wear-leveling algorithms, and integration with specific storage platforms. The market is witnessing continuous innovation in form factors, interfaces, and performance optimization techniques to meet the ever-growing demand for high-speed data access.
Key Drivers, Barriers & Challenges in APAC SSD Caching Industry
Key Drivers:
- Increasing demand for high-performance computing and data storage.
- Growing adoption of cloud computing and big data analytics.
- Rising investments in data center infrastructure.
- Government initiatives promoting digital transformation across the region.
Challenges and Restraints:
- High initial investment cost for SSD caching solutions.
- Potential for data loss due to SSD failure.
- Competition from alternative caching technologies.
- Fluctuations in NAND flash memory prices impacting cost and profitability. The impact of these price fluctuations is estimated to be a xx% variance in market growth projections.
Emerging Opportunities in APAC SSD Caching Industry
- Growing demand for edge computing and IoT applications.
- Increasing adoption of AI and machine learning requiring high-performance storage.
- Expansion into untapped markets within the region, specifically in Southeast Asia and Oceania.
- Development of specialized SSD caching solutions for specific industries like healthcare and finance.
Growth Accelerators in the APAC SSD Caching Industry
Technological breakthroughs in NAND flash memory technology, particularly 3D NAND, are driving cost reductions and performance improvements in SSDs. Strategic partnerships between SSD manufacturers and storage system vendors are facilitating the integration of SSD caching solutions into various platforms. Aggressive market expansion strategies by global players, focusing on emerging markets and specific industry verticals are further boosting market growth.
Key Players Shaping the APAC SSD Caching Industry Market
- Microsemi (Microchip Technology Inc)
- Seagate Technology LLC
- Micron Technology Inc
- Inspur Group
- Samsung Electronics Co Ltd
- Transcend Information Inc
- Kioxia (Toshiba Memory Corporation)
- ADATA Technology Co Ltd
- Western Digital Corporation
- SK Hynix Inc
- NetApp Inc
- Intel Corporation
- QNAP Systems Inc
Notable Milestones in APAC SSD Caching Industry Sector
- July 2023: Lenovo's updated ThinkSystem DM5000H, with up to 1.96 PB raw storage capacity and NVMe SSD caching, significantly enhances read-centric workload performance, impacting the enterprise storage segment.
- January 2023: QNAP's TS-1655 2.5GbE NAS, featuring a hybrid HDD/SSD architecture and supporting RAID 50/60, improves data security and storage efficiency for high-capacity NAS users, impacting both enterprise and personal storage segments.
In-Depth APAC SSD Caching Industry Market Outlook
The APAC SSD caching market is poised for sustained growth driven by continuous technological advancements, increasing data demands across various sectors, and supportive government policies. Strategic investments in research and development and strategic alliances among key players will further fuel innovation and market penetration. The long-term outlook remains positive, with significant opportunities for growth in emerging markets and emerging applications such as AI and edge computing. Companies with a robust product portfolio, strong technological capabilities, and effective market penetration strategies are expected to gain a significant competitive advantage in the coming years.
APAC SSD Caching Industry Segmentation
-
1. Application
- 1.1. Enterprise Storage
- 1.2. Personal Storage
APAC SSD Caching Industry Segmentation By Geography
-
1. North America
- 1.1. United States
- 1.2. Canada
- 1.3. Mexico
-
2. South America
- 2.1. Brazil
- 2.2. Argentina
- 2.3. Rest of South America
-
3. Europe
- 3.1. United Kingdom
- 3.2. Germany
- 3.3. France
- 3.4. Italy
- 3.5. Spain
- 3.6. Russia
- 3.7. Benelux
- 3.8. Nordics
- 3.9. Rest of Europe
-
4. Middle East & Africa
- 4.1. Turkey
- 4.2. Israel
- 4.3. GCC
- 4.4. North Africa
- 4.5. South Africa
- 4.6. Rest of Middle East & Africa
-
5. Asia Pacific
- 5.1. China
- 5.2. India
- 5.3. Japan
- 5.4. South Korea
- 5.5. ASEAN
- 5.6. Oceania
- 5.7. Rest of Asia Pacific
APAC SSD Caching Industry REPORT HIGHLIGHTS
| Aspects | Details |
|---|---|
| Study Period | 2019-2033 |
| Base Year | 2024 |
| Estimated Year | 2025 |
| Forecast Period | 2025-2033 |
| Historical Period | 2019-2024 |
| Growth Rate | CAGR of 7.50% from 2019-2033 |
| Segmentation |
|
Table of Contents
- 1. Introduction
- 1.1. Research Scope
- 1.2. Market Segmentation
- 1.3. Research Methodology
- 1.4. Definitions and Assumptions
- 2. Executive Summary
- 2.1. Introduction
- 3. Market Dynamics
- 3.1. Introduction
- 3.2. Market Drivers
- 3.2.1. Improvements Offered by SSDs Over Conventional HDDs
- 3.3. Market Restrains
- 3.3.1. Slow Pace in Development of Applications Despite Heavy investments in R&D; Commplexities in Hardware Designing
- 3.4. Market Trends
- 3.4.1. Enterprise Storage Application Segment is Expected to Hold Significant Market Share
- 4. Market Factor Analysis
- 4.1. Porters Five Forces
- 4.2. Supply/Value Chain
- 4.3. PESTEL analysis
- 4.4. Market Entropy
- 4.5. Patent/Trademark Analysis
- 5. Global APAC SSD Caching Industry Analysis, Insights and Forecast, 2019-2031
- 5.1. Market Analysis, Insights and Forecast - by Application
- 5.1.1. Enterprise Storage
- 5.1.2. Personal Storage
- 5.2. Market Analysis, Insights and Forecast - by Region
- 5.2.1. North America
- 5.2.2. South America
- 5.2.3. Europe
- 5.2.4. Middle East & Africa
- 5.2.5. Asia Pacific
- 5.1. Market Analysis, Insights and Forecast - by Application
- 6. North America APAC SSD Caching Industry Analysis, Insights and Forecast, 2019-2031
- 6.1. Market Analysis, Insights and Forecast - by Application
- 6.1.1. Enterprise Storage
- 6.1.2. Personal Storage
- 6.1. Market Analysis, Insights and Forecast - by Application
- 7. South America APAC SSD Caching Industry Analysis, Insights and Forecast, 2019-2031
- 7.1. Market Analysis, Insights and Forecast - by Application
- 7.1.1. Enterprise Storage
- 7.1.2. Personal Storage
- 7.1. Market Analysis, Insights and Forecast - by Application
- 8. Europe APAC SSD Caching Industry Analysis, Insights and Forecast, 2019-2031
- 8.1. Market Analysis, Insights and Forecast - by Application
- 8.1.1. Enterprise Storage
- 8.1.2. Personal Storage
- 8.1. Market Analysis, Insights and Forecast - by Application
- 9. Middle East & Africa APAC SSD Caching Industry Analysis, Insights and Forecast, 2019-2031
- 9.1. Market Analysis, Insights and Forecast - by Application
- 9.1.1. Enterprise Storage
- 9.1.2. Personal Storage
- 9.1. Market Analysis, Insights and Forecast - by Application
- 10. Asia Pacific APAC SSD Caching Industry Analysis, Insights and Forecast, 2019-2031
- 10.1. Market Analysis, Insights and Forecast - by Application
- 10.1.1. Enterprise Storage
- 10.1.2. Personal Storage
- 10.1. Market Analysis, Insights and Forecast - by Application
- 11. North America APAC SSD Caching Industry Analysis, Insights and Forecast, 2019-2031
- 11.1. Market Analysis, Insights and Forecast - By Country/Sub-region
- 11.1.1 United States
- 11.1.2 Canada
- 12. Europe APAC SSD Caching Industry Analysis, Insights and Forecast, 2019-2031
- 12.1. Market Analysis, Insights and Forecast - By Country/Sub-region
- 12.1.1 Germany
- 12.1.2 United Kingdom
- 12.1.3 France
- 12.1.4 Rest of Europe
- 13. Asia Pacific APAC SSD Caching Industry Analysis, Insights and Forecast, 2019-2031
- 13.1. Market Analysis, Insights and Forecast - By Country/Sub-region
- 13.1.1 China
- 13.1.2 Taiwan
- 13.1.3 South Korea
- 13.1.4 Rest of Asia Pacific
- 14. Rest of the World APAC SSD Caching Industry Analysis, Insights and Forecast, 2019-2031
- 14.1. Market Analysis, Insights and Forecast - By Country/Sub-region
- 14.1.1.
- 15. Competitive Analysis
- 15.1. Global Market Share Analysis 2024
- 15.2. Company Profiles
- 15.2.1 Microsemi (Microchip Technology Inc )*List Not Exhaustive
- 15.2.1.1. Overview
- 15.2.1.2. Products
- 15.2.1.3. SWOT Analysis
- 15.2.1.4. Recent Developments
- 15.2.1.5. Financials (Based on Availability)
- 15.2.2 Seagate Technology LLC
- 15.2.2.1. Overview
- 15.2.2.2. Products
- 15.2.2.3. SWOT Analysis
- 15.2.2.4. Recent Developments
- 15.2.2.5. Financials (Based on Availability)
- 15.2.3 Micron Technology Inc
- 15.2.3.1. Overview
- 15.2.3.2. Products
- 15.2.3.3. SWOT Analysis
- 15.2.3.4. Recent Developments
- 15.2.3.5. Financials (Based on Availability)
- 15.2.4 Inspur Group
- 15.2.4.1. Overview
- 15.2.4.2. Products
- 15.2.4.3. SWOT Analysis
- 15.2.4.4. Recent Developments
- 15.2.4.5. Financials (Based on Availability)
- 15.2.5 Samsung Electronics Co Ltd
- 15.2.5.1. Overview
- 15.2.5.2. Products
- 15.2.5.3. SWOT Analysis
- 15.2.5.4. Recent Developments
- 15.2.5.5. Financials (Based on Availability)
- 15.2.6 Transcend Information Inc
- 15.2.6.1. Overview
- 15.2.6.2. Products
- 15.2.6.3. SWOT Analysis
- 15.2.6.4. Recent Developments
- 15.2.6.5. Financials (Based on Availability)
- 15.2.7 Kioxia (Toshiba Memory Corporation)
- 15.2.7.1. Overview
- 15.2.7.2. Products
- 15.2.7.3. SWOT Analysis
- 15.2.7.4. Recent Developments
- 15.2.7.5. Financials (Based on Availability)
- 15.2.8 ADATA Technology Co Ltd
- 15.2.8.1. Overview
- 15.2.8.2. Products
- 15.2.8.3. SWOT Analysis
- 15.2.8.4. Recent Developments
- 15.2.8.5. Financials (Based on Availability)
- 15.2.9 Western Digital Corporation
- 15.2.9.1. Overview
- 15.2.9.2. Products
- 15.2.9.3. SWOT Analysis
- 15.2.9.4. Recent Developments
- 15.2.9.5. Financials (Based on Availability)
- 15.2.10 SK Hynix Inc
- 15.2.10.1. Overview
- 15.2.10.2. Products
- 15.2.10.3. SWOT Analysis
- 15.2.10.4. Recent Developments
- 15.2.10.5. Financials (Based on Availability)
- 15.2.11 NetApp Inc
- 15.2.11.1. Overview
- 15.2.11.2. Products
- 15.2.11.3. SWOT Analysis
- 15.2.11.4. Recent Developments
- 15.2.11.5. Financials (Based on Availability)
- 15.2.12 Intel Corporation
- 15.2.12.1. Overview
- 15.2.12.2. Products
- 15.2.12.3. SWOT Analysis
- 15.2.12.4. Recent Developments
- 15.2.12.5. Financials (Based on Availability)
- 15.2.13 QNAP Systems Inc
- 15.2.13.1. Overview
- 15.2.13.2. Products
- 15.2.13.3. SWOT Analysis
- 15.2.13.4. Recent Developments
- 15.2.13.5. Financials (Based on Availability)
- 15.2.1 Microsemi (Microchip Technology Inc )*List Not Exhaustive
List of Figures
- Figure 1: Global APAC SSD Caching Industry Revenue Breakdown (Million, %) by Region 2024 & 2032
- Figure 2: North America APAC SSD Caching Industry Revenue (Million), by Country 2024 & 2032
- Figure 3: North America APAC SSD Caching Industry Revenue Share (%), by Country 2024 & 2032
- Figure 4: Europe APAC SSD Caching Industry Revenue (Million), by Country 2024 & 2032
- Figure 5: Europe APAC SSD Caching Industry Revenue Share (%), by Country 2024 & 2032
- Figure 6: Asia Pacific APAC SSD Caching Industry Revenue (Million), by Country 2024 & 2032
- Figure 7: Asia Pacific APAC SSD Caching Industry Revenue Share (%), by Country 2024 & 2032
- Figure 8: Rest of the World APAC SSD Caching Industry Revenue (Million), by Country 2024 & 2032
- Figure 9: Rest of the World APAC SSD Caching Industry Revenue Share (%), by Country 2024 & 2032
- Figure 10: North America APAC SSD Caching Industry Revenue (Million), by Application 2024 & 2032
- Figure 11: North America APAC SSD Caching Industry Revenue Share (%), by Application 2024 & 2032
- Figure 12: North America APAC SSD Caching Industry Revenue (Million), by Country 2024 & 2032
- Figure 13: North America APAC SSD Caching Industry Revenue Share (%), by Country 2024 & 2032
- Figure 14: South America APAC SSD Caching Industry Revenue (Million), by Application 2024 & 2032
- Figure 15: South America APAC SSD Caching Industry Revenue Share (%), by Application 2024 & 2032
- Figure 16: South America APAC SSD Caching Industry Revenue (Million), by Country 2024 & 2032
- Figure 17: South America APAC SSD Caching Industry Revenue Share (%), by Country 2024 & 2032
- Figure 18: Europe APAC SSD Caching Industry Revenue (Million), by Application 2024 & 2032
- Figure 19: Europe APAC SSD Caching Industry Revenue Share (%), by Application 2024 & 2032
- Figure 20: Europe APAC SSD Caching Industry Revenue (Million), by Country 2024 & 2032
- Figure 21: Europe APAC SSD Caching Industry Revenue Share (%), by Country 2024 & 2032
- Figure 22: Middle East & Africa APAC SSD Caching Industry Revenue (Million), by Application 2024 & 2032
- Figure 23: Middle East & Africa APAC SSD Caching Industry Revenue Share (%), by Application 2024 & 2032
- Figure 24: Middle East & Africa APAC SSD Caching Industry Revenue (Million), by Country 2024 & 2032
- Figure 25: Middle East & Africa APAC SSD Caching Industry Revenue Share (%), by Country 2024 & 2032
- Figure 26: Asia Pacific APAC SSD Caching Industry Revenue (Million), by Application 2024 & 2032
- Figure 27: Asia Pacific APAC SSD Caching Industry Revenue Share (%), by Application 2024 & 2032
- Figure 28: Asia Pacific APAC SSD Caching Industry Revenue (Million), by Country 2024 & 2032
- Figure 29: Asia Pacific APAC SSD Caching Industry Revenue Share (%), by Country 2024 & 2032
List of Tables
- Table 1: Global APAC SSD Caching Industry Revenue Million Forecast, by Region 2019 & 2032
- Table 2: Global APAC SSD Caching Industry Revenue Million Forecast, by Application 2019 & 2032
- Table 3: Global APAC SSD Caching Industry Revenue Million Forecast, by Region 2019 & 2032
- Table 4: Global APAC SSD Caching Industry Revenue Million Forecast, by Country 2019 & 2032
- Table 5: United States APAC SSD Caching Industry Revenue (Million) Forecast, by Application 2019 & 2032
- Table 6: Canada APAC SSD Caching Industry Revenue (Million) Forecast, by Application 2019 & 2032
- Table 7: Global APAC SSD Caching Industry Revenue Million Forecast, by Country 2019 & 2032
- Table 8: Germany APAC SSD Caching Industry Revenue (Million) Forecast, by Application 2019 & 2032
- Table 9: United Kingdom APAC SSD Caching Industry Revenue (Million) Forecast, by Application 2019 & 2032
- Table 10: France APAC SSD Caching Industry Revenue (Million) Forecast, by Application 2019 & 2032
- Table 11: Rest of Europe APAC SSD Caching Industry Revenue (Million) Forecast, by Application 2019 & 2032
- Table 12: Global APAC SSD Caching Industry Revenue Million Forecast, by Country 2019 & 2032
- Table 13: China APAC SSD Caching Industry Revenue (Million) Forecast, by Application 2019 & 2032
- Table 14: Taiwan APAC SSD Caching Industry Revenue (Million) Forecast, by Application 2019 & 2032
- Table 15: South Korea APAC SSD Caching Industry Revenue (Million) Forecast, by Application 2019 & 2032
- Table 16: Rest of Asia Pacific APAC SSD Caching Industry Revenue (Million) Forecast, by Application 2019 & 2032
- Table 17: Global APAC SSD Caching Industry Revenue Million Forecast, by Country 2019 & 2032
- Table 18: APAC SSD Caching Industry Revenue (Million) Forecast, by Application 2019 & 2032
- Table 19: Global APAC SSD Caching Industry Revenue Million Forecast, by Application 2019 & 2032
- Table 20: Global APAC SSD Caching Industry Revenue Million Forecast, by Country 2019 & 2032
- Table 21: United States APAC SSD Caching Industry Revenue (Million) Forecast, by Application 2019 & 2032
- Table 22: Canada APAC SSD Caching Industry Revenue (Million) Forecast, by Application 2019 & 2032
- Table 23: Mexico APAC SSD Caching Industry Revenue (Million) Forecast, by Application 2019 & 2032
- Table 24: Global APAC SSD Caching Industry Revenue Million Forecast, by Application 2019 & 2032
- Table 25: Global APAC SSD Caching Industry Revenue Million Forecast, by Country 2019 & 2032
- Table 26: Brazil APAC SSD Caching Industry Revenue (Million) Forecast, by Application 2019 & 2032
- Table 27: Argentina APAC SSD Caching Industry Revenue (Million) Forecast, by Application 2019 & 2032
- Table 28: Rest of South America APAC SSD Caching Industry Revenue (Million) Forecast, by Application 2019 & 2032
- Table 29: Global APAC SSD Caching Industry Revenue Million Forecast, by Application 2019 & 2032
- Table 30: Global APAC SSD Caching Industry Revenue Million Forecast, by Country 2019 & 2032
- Table 31: United Kingdom APAC SSD Caching Industry Revenue (Million) Forecast, by Application 2019 & 2032
- Table 32: Germany APAC SSD Caching Industry Revenue (Million) Forecast, by Application 2019 & 2032
- Table 33: France APAC SSD Caching Industry Revenue (Million) Forecast, by Application 2019 & 2032
- Table 34: Italy APAC SSD Caching Industry Revenue (Million) Forecast, by Application 2019 & 2032
- Table 35: Spain APAC SSD Caching Industry Revenue (Million) Forecast, by Application 2019 & 2032
- Table 36: Russia APAC SSD Caching Industry Revenue (Million) Forecast, by Application 2019 & 2032
- Table 37: Benelux APAC SSD Caching Industry Revenue (Million) Forecast, by Application 2019 & 2032
- Table 38: Nordics APAC SSD Caching Industry Revenue (Million) Forecast, by Application 2019 & 2032
- Table 39: Rest of Europe APAC SSD Caching Industry Revenue (Million) Forecast, by Application 2019 & 2032
- Table 40: Global APAC SSD Caching Industry Revenue Million Forecast, by Application 2019 & 2032
- Table 41: Global APAC SSD Caching Industry Revenue Million Forecast, by Country 2019 & 2032
- Table 42: Turkey APAC SSD Caching Industry Revenue (Million) Forecast, by Application 2019 & 2032
- Table 43: Israel APAC SSD Caching Industry Revenue (Million) Forecast, by Application 2019 & 2032
- Table 44: GCC APAC SSD Caching Industry Revenue (Million) Forecast, by Application 2019 & 2032
- Table 45: North Africa APAC SSD Caching Industry Revenue (Million) Forecast, by Application 2019 & 2032
- Table 46: South Africa APAC SSD Caching Industry Revenue (Million) Forecast, by Application 2019 & 2032
- Table 47: Rest of Middle East & Africa APAC SSD Caching Industry Revenue (Million) Forecast, by Application 2019 & 2032
- Table 48: Global APAC SSD Caching Industry Revenue Million Forecast, by Application 2019 & 2032
- Table 49: Global APAC SSD Caching Industry Revenue Million Forecast, by Country 2019 & 2032
- Table 50: China APAC SSD Caching Industry Revenue (Million) Forecast, by Application 2019 & 2032
- Table 51: India APAC SSD Caching Industry Revenue (Million) Forecast, by Application 2019 & 2032
- Table 52: Japan APAC SSD Caching Industry Revenue (Million) Forecast, by Application 2019 & 2032
- Table 53: South Korea APAC SSD Caching Industry Revenue (Million) Forecast, by Application 2019 & 2032
- Table 54: ASEAN APAC SSD Caching Industry Revenue (Million) Forecast, by Application 2019 & 2032
- Table 55: Oceania APAC SSD Caching Industry Revenue (Million) Forecast, by Application 2019 & 2032
- Table 56: Rest of Asia Pacific APAC SSD Caching Industry Revenue (Million) Forecast, by Application 2019 & 2032
Frequently Asked Questions
1. What is the projected Compound Annual Growth Rate (CAGR) of the APAC SSD Caching Industry?
The projected CAGR is approximately 7.50%.
2. Which companies are prominent players in the APAC SSD Caching Industry?
Key companies in the market include Microsemi (Microchip Technology Inc )*List Not Exhaustive, Seagate Technology LLC, Micron Technology Inc, Inspur Group, Samsung Electronics Co Ltd, Transcend Information Inc, Kioxia (Toshiba Memory Corporation), ADATA Technology Co Ltd, Western Digital Corporation, SK Hynix Inc, NetApp Inc, Intel Corporation, QNAP Systems Inc.
3. What are the main segments of the APAC SSD Caching Industry?
The market segments include Application.
4. Can you provide details about the market size?
The market size is estimated to be USD 19.17 Million as of 2022.
5. What are some drivers contributing to market growth?
Improvements Offered by SSDs Over Conventional HDDs.
6. What are the notable trends driving market growth?
Enterprise Storage Application Segment is Expected to Hold Significant Market Share.
7. Are there any restraints impacting market growth?
Slow Pace in Development of Applications Despite Heavy investments in R&D; Commplexities in Hardware Designing.
8. Can you provide examples of recent developments in the market?
July 2023: Lenovo updated ThinkSystem DM5000H can scale up to 1.96 PB of raw storage capacity. A cluster of the DM5000H storage systems can scale up to 23.5 PB for NAS or up to 11.7 PB for SAN environments. The ThinkSystem DM5000H offers unified file and block storage connectivity with support for 1 GbE or 10 GbE NAS and iSCSI and 8 Gb or 16 Gb Fibre Channel protocols simultaneously. Acceleration of read-centric workloads with the high-speed, low-latency onboard NVMe SSD caching.
9. What pricing options are available for accessing the report?
Pricing options include single-user, multi-user, and enterprise licenses priced at USD 4750, USD 4950, and USD 6800 respectively.
10. Is the market size provided in terms of value or volume?
The market size is provided in terms of value, measured in Million.
11. Are there any specific market keywords associated with the report?
Yes, the market keyword associated with the report is "APAC SSD Caching Industry," which aids in identifying and referencing the specific market segment covered.
12. How do I determine which pricing option suits my needs best?
The pricing options vary based on user requirements and access needs. Individual users may opt for single-user licenses, while businesses requiring broader access may choose multi-user or enterprise licenses for cost-effective access to the report.
13. Are there any additional resources or data provided in the APAC SSD Caching Industry report?
While the report offers comprehensive insights, it's advisable to review the specific contents or supplementary materials provided to ascertain if additional resources or data are available.
14. How can I stay updated on further developments or reports in the APAC SSD Caching Industry?
To stay informed about further developments, trends, and reports in the APAC SSD Caching Industry, consider subscribing to industry newsletters, following relevant companies and organizations, or regularly checking reputable industry news sources and publications.
Methodology
Step 1 - Identification of Relevant Samples Size from Population Database


Step 2 - Approaches for Defining Global Market Size (Value, Volume* & Price*)

Note*: In applicable scenarios
Step 3 - Data Sources
Primary Research
- Web Analytics
- Survey Reports
- Research Institute
- Latest Research Reports
- Opinion Leaders
Secondary Research
- Annual Reports
- White Paper
- Latest Press Release
- Industry Association
- Paid Database
- Investor Presentations

Step 4 - Data Triangulation
Involves using different sources of information in order to increase the validity of a study
These sources are likely to be stakeholders in a program - participants, other researchers, program staff, other community members, and so on.
Then we put all data in single framework & apply various statistical tools to find out the dynamic on the market.
During the analysis stage, feedback from the stakeholder groups would be compared to determine areas of agreement as well as areas of divergence
