

Key Insights
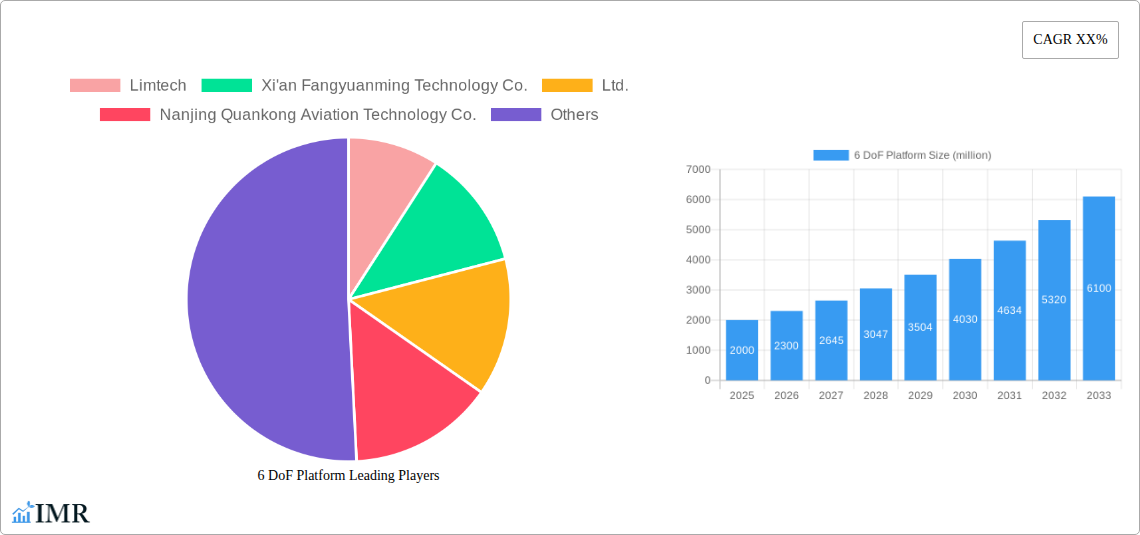
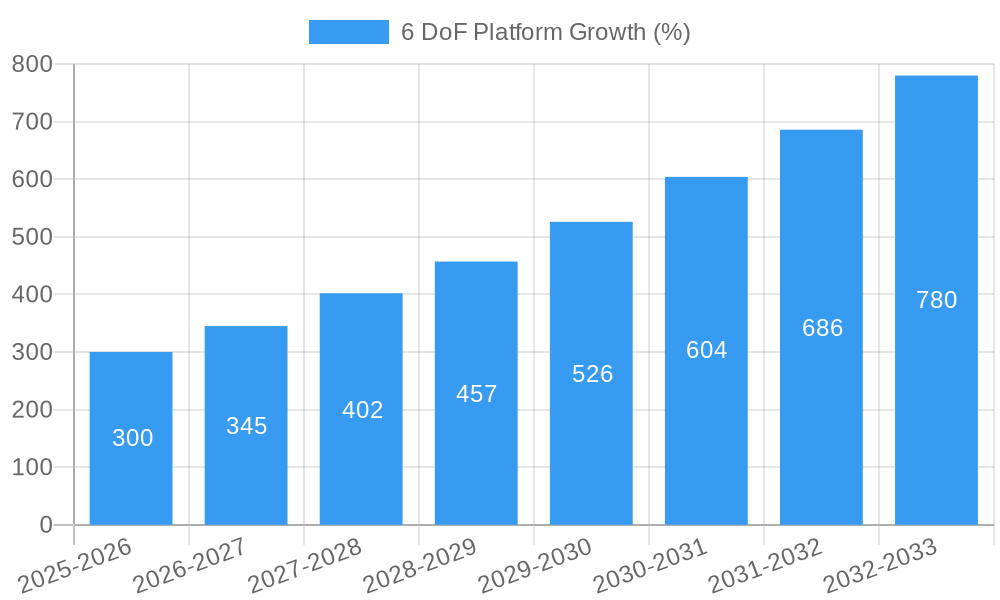
The global 6 Degree of Freedom (6DoF) platform market is experiencing robust growth, driven by increasing demand across diverse sectors such as aerospace, automotive, robotics, and simulation training. The market, estimated at $2 billion in 2025, is projected to achieve a Compound Annual Growth Rate (CAGR) of 15% from 2025 to 2033, reaching an estimated market value of approximately $6 billion by 2033. This expansion is fueled by advancements in motion control technology, miniaturization of components, and the rising adoption of automation across industries. Key trends include the increasing integration of 6DoF platforms with advanced sensors and software for enhanced precision and data acquisition, the development of more compact and cost-effective designs, and the growing preference for customized solutions tailored to specific application requirements. Companies like Moog, a prominent player in the aerospace sector, alongside several Chinese technology firms such as Limtech and Xi'an Fangyuanming, are contributing significantly to this market expansion through continuous innovation and product diversification.
Despite the positive outlook, the market faces certain challenges. The high initial investment cost of 6DoF platforms can be a barrier to entry for smaller businesses. Furthermore, the complexity of the technology necessitates specialized expertise for installation, maintenance, and operation. However, ongoing technological advancements and the development of more user-friendly systems are gradually mitigating these constraints. The segmentation of the market includes applications such as flight simulation, robotic testing, and industrial automation, each exhibiting unique growth trajectories and contributing to the overall market expansion. Future growth is expected to be driven by the increasing adoption of 6DoF platforms in emerging applications, such as augmented reality and virtual reality systems, further reinforcing the market's strong potential.
6 DoF Platform Market Report: 2019-2033
This comprehensive report provides a detailed analysis of the global 6 DoF Platform market, encompassing market dynamics, growth trends, regional insights, competitive landscape, and future outlook. The study period covers 2019-2033, with 2025 as the base and estimated year. The forecast period spans 2025-2033, and the historical period is 2019-2024. This report is crucial for industry professionals, investors, and strategic decision-makers seeking to understand and capitalize on the opportunities within this rapidly evolving market. The parent market is the motion control systems market, while the child market is the automation and robotics industry. The report is predicted to be valued at xx million USD in 2025.
6 DoF Platform Market Dynamics & Structure
The global 6 DoF Platform market is characterized by moderate concentration, with a few key players holding significant market share, though fragmentation is expected to increase slightly with new entrants. Technological innovation, driven by advancements in sensor technology, control algorithms, and actuation systems, is a primary growth driver. Stringent safety regulations and industry standards significantly influence market dynamics. Competitive product substitutes, such as less sophisticated motion control platforms, exert pressure on pricing and market share. End-user demographics encompass diverse industries like aerospace, automotive, healthcare, and research. M&A activity remains moderate; there were approximately xx deals in the historical period, contributing to market consolidation.
- Market Concentration: Moderately concentrated, with top 5 players holding xx% market share in 2025.
- Technological Innovation: Advancements in sensor fusion, AI-powered control, and lightweight materials are key drivers.
- Regulatory Framework: Stringent safety standards and compliance requirements impact market entry and product development.
- Competitive Substitutes: Simpler motion control systems provide cost-effective alternatives, limiting market growth.
- End-User Demographics: Aerospace, automotive, medical, and research are major end-use sectors.
- M&A Trends: Moderate M&A activity, with xx deals recorded between 2019 and 2024, primarily focused on consolidation and technology acquisition.
6 DoF Platform Growth Trends & Insights
The 6 DoF Platform market exhibited a CAGR of xx% during the historical period (2019-2024) and is projected to maintain a CAGR of xx% from 2025 to 2033. Market penetration stands at xx% in 2025, indicating substantial room for growth. Technological disruptions, including the integration of advanced control algorithms and the adoption of Industry 4.0 principles, are significantly impacting market growth. Consumer behavior shifts towards automation and precision in various industrial processes further drive demand. Increased demand from high-growth segments like automated guided vehicles (AGVs) and surgical robotics also plays a vital role.
Dominant Regions, Countries, or Segments in 6 DoF Platform
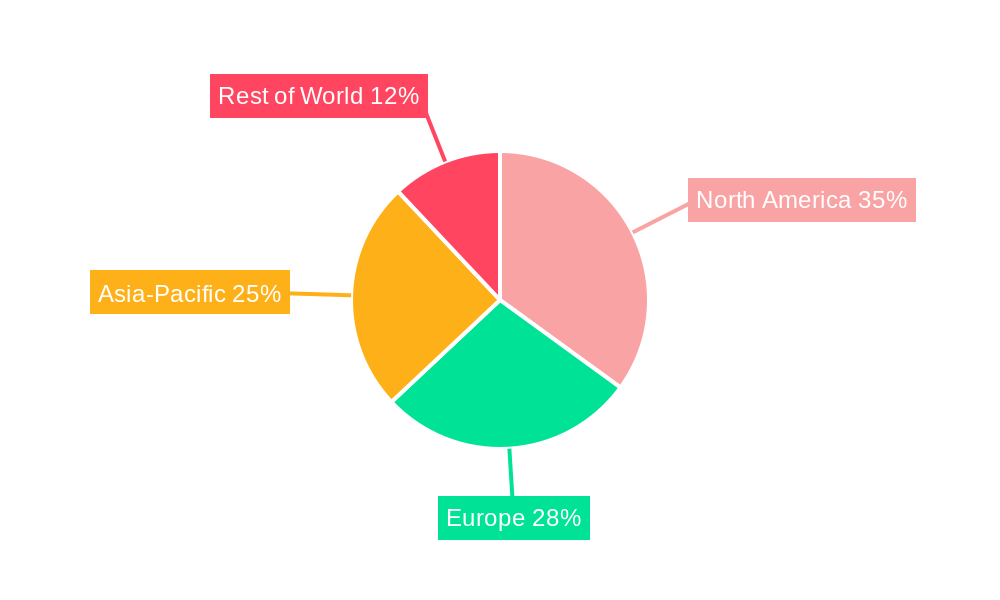
North America currently holds the largest market share, driven by robust technological advancements and high adoption rates in the aerospace and automotive sectors. Strong government investments in automation and robotics further fuel market expansion. Asia-Pacific is expected to experience the fastest growth, fueled by increasing industrialization and government initiatives promoting automation. Europe is witnessing a steady growth trajectory, driven by automation in manufacturing and healthcare.
- North America: Strong presence of key players, high adoption rates in aerospace and automotive sectors, robust R&D investments.
- Asia-Pacific: High growth potential, driven by rising industrialization, governmental support for automation, and a large manufacturing base.
- Europe: Steady growth, driven by automation in manufacturing and healthcare, and focus on precision engineering.
6 DoF Platform Product Landscape
6 DoF Platforms are characterized by diverse product offerings, with variations in load capacity, precision, and control systems. Key innovations involve advanced sensor integration, improved control algorithms for enhanced precision and stability, and the development of compact and lightweight designs for improved versatility. Unique selling propositions often include customized configurations, enhanced durability, and ease of integration with existing systems. Technological advancements focus on improving accuracy, speed, and overall system efficiency.
Key Drivers, Barriers & Challenges in 6 DoF Platform
Key Drivers: Increasing demand for automation across various industries, advancements in sensor and actuator technology, and government initiatives promoting industrial automation are key drivers. The rising need for precision and efficiency in manufacturing and other processes further fuels market expansion.
Challenges: High initial investment costs, complexity of integration with existing systems, and potential supply chain disruptions due to geopolitical factors pose significant challenges. Competition from less sophisticated motion control systems and skilled labor shortages also constrain market growth.
Emerging Opportunities in 6 DoF Platform
Untapped markets in developing economies, integration with emerging technologies like AI and IoT, and applications in novel sectors like micro-robotics and advanced surgical procedures present significant growth opportunities. The demand for customized solutions and the integration of 6 DoF platforms with other automation technologies presents a path to market expansion.
Growth Accelerators in the 6 DoF Platform Industry
Technological advancements in sensor technology and control algorithms are driving growth, while strategic partnerships between platform providers and end-users facilitate faster market adoption. Expansion into new markets like the healthcare and agricultural sectors offers further growth potential.
Key Players Shaping the 6 DoF Platform Market
- Limtech
- Xi'an Fangyuanming Technology Co.,Ltd.
- Nanjing Quankong Aviation Technology Co.,Ltd.
- Moog
- Tianyu Technology
- Foshan Yishili New Technology Co.,Ltd.
- Xixian New District Shuangyu Intelligent Technology Co.,Ltd.
- Wuhan Huazhong Aviation Measurement and Control Technology Co.,Ltd.
- Weier (Beijing) Technology Co.,Ltd.
Notable Milestones in 6 DoF Platform Sector
- 2020-Q3: Moog launched a new high-precision 6 DoF platform with enhanced control algorithms.
- 2022-Q1: Limtech acquired a smaller competitor, expanding its market share.
- 2023-Q4: Significant investments in R&D across the industry led to the release of several improved designs.
In-Depth 6 DoF Platform Market Outlook
The 6 DoF Platform market is poised for continued growth, driven by technological advancements, increasing automation adoption, and expansion into new applications. Strategic partnerships, investments in R&D, and focusing on niche applications will be crucial for players seeking to capitalize on the significant market potential. The market is expected to exceed xx million USD by 2033, representing substantial growth opportunities.
6 DoF Platform Segmentation
-
1. Application
- 1.1. Automobile
- 1.2. Aerospace
- 1.3. Defense Industry
- 1.4. Entertainment
- 1.5. Railroad
- 1.6. Other
-
2. Types
- 2.1. 6-DOF Motion Platform
- 2.2. 6-DOF Precision Positioning Platform
6 DoF Platform Segmentation By Geography
-
1. North America
- 1.1. United States
- 1.2. Canada
- 1.3. Mexico
-
2. South America
- 2.1. Brazil
- 2.2. Argentina
- 2.3. Rest of South America
-
3. Europe
- 3.1. United Kingdom
- 3.2. Germany
- 3.3. France
- 3.4. Italy
- 3.5. Spain
- 3.6. Russia
- 3.7. Benelux
- 3.8. Nordics
- 3.9. Rest of Europe
-
4. Middle East & Africa
- 4.1. Turkey
- 4.2. Israel
- 4.3. GCC
- 4.4. North Africa
- 4.5. South Africa
- 4.6. Rest of Middle East & Africa
-
5. Asia Pacific
- 5.1. China
- 5.2. India
- 5.3. Japan
- 5.4. South Korea
- 5.5. ASEAN
- 5.6. Oceania
- 5.7. Rest of Asia Pacific
6 DoF Platform REPORT HIGHLIGHTS
| Aspects | Details |
|---|---|
| Study Period | 2019-2033 |
| Base Year | 2024 |
| Estimated Year | 2025 |
| Forecast Period | 2025-2033 |
| Historical Period | 2019-2024 |
| Growth Rate | CAGR of XX% from 2019-2033 |
| Segmentation |
|
Table of Contents
- 1. Introduction
- 1.1. Research Scope
- 1.2. Market Segmentation
- 1.3. Research Methodology
- 1.4. Definitions and Assumptions
- 2. Executive Summary
- 2.1. Introduction
- 3. Market Dynamics
- 3.1. Introduction
- 3.2. Market Drivers
- 3.3. Market Restrains
- 3.4. Market Trends
- 4. Market Factor Analysis
- 4.1. Porters Five Forces
- 4.2. Supply/Value Chain
- 4.3. PESTEL analysis
- 4.4. Market Entropy
- 4.5. Patent/Trademark Analysis
- 5. Global 6 DoF Platform Analysis, Insights and Forecast, 2019-2031
- 5.1. Market Analysis, Insights and Forecast - by Application
- 5.1.1. Automobile
- 5.1.2. Aerospace
- 5.1.3. Defense Industry
- 5.1.4. Entertainment
- 5.1.5. Railroad
- 5.1.6. Other
- 5.2. Market Analysis, Insights and Forecast - by Types
- 5.2.1. 6-DOF Motion Platform
- 5.2.2. 6-DOF Precision Positioning Platform
- 5.3. Market Analysis, Insights and Forecast - by Region
- 5.3.1. North America
- 5.3.2. South America
- 5.3.3. Europe
- 5.3.4. Middle East & Africa
- 5.3.5. Asia Pacific
- 5.1. Market Analysis, Insights and Forecast - by Application
- 6. North America 6 DoF Platform Analysis, Insights and Forecast, 2019-2031
- 6.1. Market Analysis, Insights and Forecast - by Application
- 6.1.1. Automobile
- 6.1.2. Aerospace
- 6.1.3. Defense Industry
- 6.1.4. Entertainment
- 6.1.5. Railroad
- 6.1.6. Other
- 6.2. Market Analysis, Insights and Forecast - by Types
- 6.2.1. 6-DOF Motion Platform
- 6.2.2. 6-DOF Precision Positioning Platform
- 6.1. Market Analysis, Insights and Forecast - by Application
- 7. South America 6 DoF Platform Analysis, Insights and Forecast, 2019-2031
- 7.1. Market Analysis, Insights and Forecast - by Application
- 7.1.1. Automobile
- 7.1.2. Aerospace
- 7.1.3. Defense Industry
- 7.1.4. Entertainment
- 7.1.5. Railroad
- 7.1.6. Other
- 7.2. Market Analysis, Insights and Forecast - by Types
- 7.2.1. 6-DOF Motion Platform
- 7.2.2. 6-DOF Precision Positioning Platform
- 7.1. Market Analysis, Insights and Forecast - by Application
- 8. Europe 6 DoF Platform Analysis, Insights and Forecast, 2019-2031
- 8.1. Market Analysis, Insights and Forecast - by Application
- 8.1.1. Automobile
- 8.1.2. Aerospace
- 8.1.3. Defense Industry
- 8.1.4. Entertainment
- 8.1.5. Railroad
- 8.1.6. Other
- 8.2. Market Analysis, Insights and Forecast - by Types
- 8.2.1. 6-DOF Motion Platform
- 8.2.2. 6-DOF Precision Positioning Platform
- 8.1. Market Analysis, Insights and Forecast - by Application
- 9. Middle East & Africa 6 DoF Platform Analysis, Insights and Forecast, 2019-2031
- 9.1. Market Analysis, Insights and Forecast - by Application
- 9.1.1. Automobile
- 9.1.2. Aerospace
- 9.1.3. Defense Industry
- 9.1.4. Entertainment
- 9.1.5. Railroad
- 9.1.6. Other
- 9.2. Market Analysis, Insights and Forecast - by Types
- 9.2.1. 6-DOF Motion Platform
- 9.2.2. 6-DOF Precision Positioning Platform
- 9.1. Market Analysis, Insights and Forecast - by Application
- 10. Asia Pacific 6 DoF Platform Analysis, Insights and Forecast, 2019-2031
- 10.1. Market Analysis, Insights and Forecast - by Application
- 10.1.1. Automobile
- 10.1.2. Aerospace
- 10.1.3. Defense Industry
- 10.1.4. Entertainment
- 10.1.5. Railroad
- 10.1.6. Other
- 10.2. Market Analysis, Insights and Forecast - by Types
- 10.2.1. 6-DOF Motion Platform
- 10.2.2. 6-DOF Precision Positioning Platform
- 10.1. Market Analysis, Insights and Forecast - by Application
- 11. Competitive Analysis
- 11.1. Global Market Share Analysis 2024
- 11.2. Company Profiles
- 11.2.1 Limtech
- 11.2.1.1. Overview
- 11.2.1.2. Products
- 11.2.1.3. SWOT Analysis
- 11.2.1.4. Recent Developments
- 11.2.1.5. Financials (Based on Availability)
- 11.2.2 Xi'an Fangyuanming Technology Co.
- 11.2.2.1. Overview
- 11.2.2.2. Products
- 11.2.2.3. SWOT Analysis
- 11.2.2.4. Recent Developments
- 11.2.2.5. Financials (Based on Availability)
- 11.2.3 Ltd.
- 11.2.3.1. Overview
- 11.2.3.2. Products
- 11.2.3.3. SWOT Analysis
- 11.2.3.4. Recent Developments
- 11.2.3.5. Financials (Based on Availability)
- 11.2.4 Nanjing Quankong Aviation Technology Co.
- 11.2.4.1. Overview
- 11.2.4.2. Products
- 11.2.4.3. SWOT Analysis
- 11.2.4.4. Recent Developments
- 11.2.4.5. Financials (Based on Availability)
- 11.2.5 Ltd.
- 11.2.5.1. Overview
- 11.2.5.2. Products
- 11.2.5.3. SWOT Analysis
- 11.2.5.4. Recent Developments
- 11.2.5.5. Financials (Based on Availability)
- 11.2.6 Moog
- 11.2.6.1. Overview
- 11.2.6.2. Products
- 11.2.6.3. SWOT Analysis
- 11.2.6.4. Recent Developments
- 11.2.6.5. Financials (Based on Availability)
- 11.2.7 Tianyu Technology
- 11.2.7.1. Overview
- 11.2.7.2. Products
- 11.2.7.3. SWOT Analysis
- 11.2.7.4. Recent Developments
- 11.2.7.5. Financials (Based on Availability)
- 11.2.8 Foshan Yishili New Technology Co.
- 11.2.8.1. Overview
- 11.2.8.2. Products
- 11.2.8.3. SWOT Analysis
- 11.2.8.4. Recent Developments
- 11.2.8.5. Financials (Based on Availability)
- 11.2.9 Ltd.
- 11.2.9.1. Overview
- 11.2.9.2. Products
- 11.2.9.3. SWOT Analysis
- 11.2.9.4. Recent Developments
- 11.2.9.5. Financials (Based on Availability)
- 11.2.10 Xixian New District Shuangyu Intelligent Technology Co.
- 11.2.10.1. Overview
- 11.2.10.2. Products
- 11.2.10.3. SWOT Analysis
- 11.2.10.4. Recent Developments
- 11.2.10.5. Financials (Based on Availability)
- 11.2.11 Ltd.
- 11.2.11.1. Overview
- 11.2.11.2. Products
- 11.2.11.3. SWOT Analysis
- 11.2.11.4. Recent Developments
- 11.2.11.5. Financials (Based on Availability)
- 11.2.12 Wuhan Huazhong Aviation Measurement and Control Technology Co.
- 11.2.12.1. Overview
- 11.2.12.2. Products
- 11.2.12.3. SWOT Analysis
- 11.2.12.4. Recent Developments
- 11.2.12.5. Financials (Based on Availability)
- 11.2.13 Ltd.
- 11.2.13.1. Overview
- 11.2.13.2. Products
- 11.2.13.3. SWOT Analysis
- 11.2.13.4. Recent Developments
- 11.2.13.5. Financials (Based on Availability)
- 11.2.14 Weier (Beijing) Technology Co.
- 11.2.14.1. Overview
- 11.2.14.2. Products
- 11.2.14.3. SWOT Analysis
- 11.2.14.4. Recent Developments
- 11.2.14.5. Financials (Based on Availability)
- 11.2.15 Ltd.
- 11.2.15.1. Overview
- 11.2.15.2. Products
- 11.2.15.3. SWOT Analysis
- 11.2.15.4. Recent Developments
- 11.2.15.5. Financials (Based on Availability)
- 11.2.1 Limtech
List of Figures
- Figure 1: Global 6 DoF Platform Revenue Breakdown (million, %) by Region 2024 & 2032
- Figure 2: Global 6 DoF Platform Volume Breakdown (K, %) by Region 2024 & 2032
- Figure 3: North America 6 DoF Platform Revenue (million), by Application 2024 & 2032
- Figure 4: North America 6 DoF Platform Volume (K), by Application 2024 & 2032
- Figure 5: North America 6 DoF Platform Revenue Share (%), by Application 2024 & 2032
- Figure 6: North America 6 DoF Platform Volume Share (%), by Application 2024 & 2032
- Figure 7: North America 6 DoF Platform Revenue (million), by Types 2024 & 2032
- Figure 8: North America 6 DoF Platform Volume (K), by Types 2024 & 2032
- Figure 9: North America 6 DoF Platform Revenue Share (%), by Types 2024 & 2032
- Figure 10: North America 6 DoF Platform Volume Share (%), by Types 2024 & 2032
- Figure 11: North America 6 DoF Platform Revenue (million), by Country 2024 & 2032
- Figure 12: North America 6 DoF Platform Volume (K), by Country 2024 & 2032
- Figure 13: North America 6 DoF Platform Revenue Share (%), by Country 2024 & 2032
- Figure 14: North America 6 DoF Platform Volume Share (%), by Country 2024 & 2032
- Figure 15: South America 6 DoF Platform Revenue (million), by Application 2024 & 2032
- Figure 16: South America 6 DoF Platform Volume (K), by Application 2024 & 2032
- Figure 17: South America 6 DoF Platform Revenue Share (%), by Application 2024 & 2032
- Figure 18: South America 6 DoF Platform Volume Share (%), by Application 2024 & 2032
- Figure 19: South America 6 DoF Platform Revenue (million), by Types 2024 & 2032
- Figure 20: South America 6 DoF Platform Volume (K), by Types 2024 & 2032
- Figure 21: South America 6 DoF Platform Revenue Share (%), by Types 2024 & 2032
- Figure 22: South America 6 DoF Platform Volume Share (%), by Types 2024 & 2032
- Figure 23: South America 6 DoF Platform Revenue (million), by Country 2024 & 2032
- Figure 24: South America 6 DoF Platform Volume (K), by Country 2024 & 2032
- Figure 25: South America 6 DoF Platform Revenue Share (%), by Country 2024 & 2032
- Figure 26: South America 6 DoF Platform Volume Share (%), by Country 2024 & 2032
- Figure 27: Europe 6 DoF Platform Revenue (million), by Application 2024 & 2032
- Figure 28: Europe 6 DoF Platform Volume (K), by Application 2024 & 2032
- Figure 29: Europe 6 DoF Platform Revenue Share (%), by Application 2024 & 2032
- Figure 30: Europe 6 DoF Platform Volume Share (%), by Application 2024 & 2032
- Figure 31: Europe 6 DoF Platform Revenue (million), by Types 2024 & 2032
- Figure 32: Europe 6 DoF Platform Volume (K), by Types 2024 & 2032
- Figure 33: Europe 6 DoF Platform Revenue Share (%), by Types 2024 & 2032
- Figure 34: Europe 6 DoF Platform Volume Share (%), by Types 2024 & 2032
- Figure 35: Europe 6 DoF Platform Revenue (million), by Country 2024 & 2032
- Figure 36: Europe 6 DoF Platform Volume (K), by Country 2024 & 2032
- Figure 37: Europe 6 DoF Platform Revenue Share (%), by Country 2024 & 2032
- Figure 38: Europe 6 DoF Platform Volume Share (%), by Country 2024 & 2032
- Figure 39: Middle East & Africa 6 DoF Platform Revenue (million), by Application 2024 & 2032
- Figure 40: Middle East & Africa 6 DoF Platform Volume (K), by Application 2024 & 2032
- Figure 41: Middle East & Africa 6 DoF Platform Revenue Share (%), by Application 2024 & 2032
- Figure 42: Middle East & Africa 6 DoF Platform Volume Share (%), by Application 2024 & 2032
- Figure 43: Middle East & Africa 6 DoF Platform Revenue (million), by Types 2024 & 2032
- Figure 44: Middle East & Africa 6 DoF Platform Volume (K), by Types 2024 & 2032
- Figure 45: Middle East & Africa 6 DoF Platform Revenue Share (%), by Types 2024 & 2032
- Figure 46: Middle East & Africa 6 DoF Platform Volume Share (%), by Types 2024 & 2032
- Figure 47: Middle East & Africa 6 DoF Platform Revenue (million), by Country 2024 & 2032
- Figure 48: Middle East & Africa 6 DoF Platform Volume (K), by Country 2024 & 2032
- Figure 49: Middle East & Africa 6 DoF Platform Revenue Share (%), by Country 2024 & 2032
- Figure 50: Middle East & Africa 6 DoF Platform Volume Share (%), by Country 2024 & 2032
- Figure 51: Asia Pacific 6 DoF Platform Revenue (million), by Application 2024 & 2032
- Figure 52: Asia Pacific 6 DoF Platform Volume (K), by Application 2024 & 2032
- Figure 53: Asia Pacific 6 DoF Platform Revenue Share (%), by Application 2024 & 2032
- Figure 54: Asia Pacific 6 DoF Platform Volume Share (%), by Application 2024 & 2032
- Figure 55: Asia Pacific 6 DoF Platform Revenue (million), by Types 2024 & 2032
- Figure 56: Asia Pacific 6 DoF Platform Volume (K), by Types 2024 & 2032
- Figure 57: Asia Pacific 6 DoF Platform Revenue Share (%), by Types 2024 & 2032
- Figure 58: Asia Pacific 6 DoF Platform Volume Share (%), by Types 2024 & 2032
- Figure 59: Asia Pacific 6 DoF Platform Revenue (million), by Country 2024 & 2032
- Figure 60: Asia Pacific 6 DoF Platform Volume (K), by Country 2024 & 2032
- Figure 61: Asia Pacific 6 DoF Platform Revenue Share (%), by Country 2024 & 2032
- Figure 62: Asia Pacific 6 DoF Platform Volume Share (%), by Country 2024 & 2032
List of Tables
- Table 1: Global 6 DoF Platform Revenue million Forecast, by Region 2019 & 2032
- Table 2: Global 6 DoF Platform Volume K Forecast, by Region 2019 & 2032
- Table 3: Global 6 DoF Platform Revenue million Forecast, by Application 2019 & 2032
- Table 4: Global 6 DoF Platform Volume K Forecast, by Application 2019 & 2032
- Table 5: Global 6 DoF Platform Revenue million Forecast, by Types 2019 & 2032
- Table 6: Global 6 DoF Platform Volume K Forecast, by Types 2019 & 2032
- Table 7: Global 6 DoF Platform Revenue million Forecast, by Region 2019 & 2032
- Table 8: Global 6 DoF Platform Volume K Forecast, by Region 2019 & 2032
- Table 9: Global 6 DoF Platform Revenue million Forecast, by Application 2019 & 2032
- Table 10: Global 6 DoF Platform Volume K Forecast, by Application 2019 & 2032
- Table 11: Global 6 DoF Platform Revenue million Forecast, by Types 2019 & 2032
- Table 12: Global 6 DoF Platform Volume K Forecast, by Types 2019 & 2032
- Table 13: Global 6 DoF Platform Revenue million Forecast, by Country 2019 & 2032
- Table 14: Global 6 DoF Platform Volume K Forecast, by Country 2019 & 2032
- Table 15: United States 6 DoF Platform Revenue (million) Forecast, by Application 2019 & 2032
- Table 16: United States 6 DoF Platform Volume (K) Forecast, by Application 2019 & 2032
- Table 17: Canada 6 DoF Platform Revenue (million) Forecast, by Application 2019 & 2032
- Table 18: Canada 6 DoF Platform Volume (K) Forecast, by Application 2019 & 2032
- Table 19: Mexico 6 DoF Platform Revenue (million) Forecast, by Application 2019 & 2032
- Table 20: Mexico 6 DoF Platform Volume (K) Forecast, by Application 2019 & 2032
- Table 21: Global 6 DoF Platform Revenue million Forecast, by Application 2019 & 2032
- Table 22: Global 6 DoF Platform Volume K Forecast, by Application 2019 & 2032
- Table 23: Global 6 DoF Platform Revenue million Forecast, by Types 2019 & 2032
- Table 24: Global 6 DoF Platform Volume K Forecast, by Types 2019 & 2032
- Table 25: Global 6 DoF Platform Revenue million Forecast, by Country 2019 & 2032
- Table 26: Global 6 DoF Platform Volume K Forecast, by Country 2019 & 2032
- Table 27: Brazil 6 DoF Platform Revenue (million) Forecast, by Application 2019 & 2032
- Table 28: Brazil 6 DoF Platform Volume (K) Forecast, by Application 2019 & 2032
- Table 29: Argentina 6 DoF Platform Revenue (million) Forecast, by Application 2019 & 2032
- Table 30: Argentina 6 DoF Platform Volume (K) Forecast, by Application 2019 & 2032
- Table 31: Rest of South America 6 DoF Platform Revenue (million) Forecast, by Application 2019 & 2032
- Table 32: Rest of South America 6 DoF Platform Volume (K) Forecast, by Application 2019 & 2032
- Table 33: Global 6 DoF Platform Revenue million Forecast, by Application 2019 & 2032
- Table 34: Global 6 DoF Platform Volume K Forecast, by Application 2019 & 2032
- Table 35: Global 6 DoF Platform Revenue million Forecast, by Types 2019 & 2032
- Table 36: Global 6 DoF Platform Volume K Forecast, by Types 2019 & 2032
- Table 37: Global 6 DoF Platform Revenue million Forecast, by Country 2019 & 2032
- Table 38: Global 6 DoF Platform Volume K Forecast, by Country 2019 & 2032
- Table 39: United Kingdom 6 DoF Platform Revenue (million) Forecast, by Application 2019 & 2032
- Table 40: United Kingdom 6 DoF Platform Volume (K) Forecast, by Application 2019 & 2032
- Table 41: Germany 6 DoF Platform Revenue (million) Forecast, by Application 2019 & 2032
- Table 42: Germany 6 DoF Platform Volume (K) Forecast, by Application 2019 & 2032
- Table 43: France 6 DoF Platform Revenue (million) Forecast, by Application 2019 & 2032
- Table 44: France 6 DoF Platform Volume (K) Forecast, by Application 2019 & 2032
- Table 45: Italy 6 DoF Platform Revenue (million) Forecast, by Application 2019 & 2032
- Table 46: Italy 6 DoF Platform Volume (K) Forecast, by Application 2019 & 2032
- Table 47: Spain 6 DoF Platform Revenue (million) Forecast, by Application 2019 & 2032
- Table 48: Spain 6 DoF Platform Volume (K) Forecast, by Application 2019 & 2032
- Table 49: Russia 6 DoF Platform Revenue (million) Forecast, by Application 2019 & 2032
- Table 50: Russia 6 DoF Platform Volume (K) Forecast, by Application 2019 & 2032
- Table 51: Benelux 6 DoF Platform Revenue (million) Forecast, by Application 2019 & 2032
- Table 52: Benelux 6 DoF Platform Volume (K) Forecast, by Application 2019 & 2032
- Table 53: Nordics 6 DoF Platform Revenue (million) Forecast, by Application 2019 & 2032
- Table 54: Nordics 6 DoF Platform Volume (K) Forecast, by Application 2019 & 2032
- Table 55: Rest of Europe 6 DoF Platform Revenue (million) Forecast, by Application 2019 & 2032
- Table 56: Rest of Europe 6 DoF Platform Volume (K) Forecast, by Application 2019 & 2032
- Table 57: Global 6 DoF Platform Revenue million Forecast, by Application 2019 & 2032
- Table 58: Global 6 DoF Platform Volume K Forecast, by Application 2019 & 2032
- Table 59: Global 6 DoF Platform Revenue million Forecast, by Types 2019 & 2032
- Table 60: Global 6 DoF Platform Volume K Forecast, by Types 2019 & 2032
- Table 61: Global 6 DoF Platform Revenue million Forecast, by Country 2019 & 2032
- Table 62: Global 6 DoF Platform Volume K Forecast, by Country 2019 & 2032
- Table 63: Turkey 6 DoF Platform Revenue (million) Forecast, by Application 2019 & 2032
- Table 64: Turkey 6 DoF Platform Volume (K) Forecast, by Application 2019 & 2032
- Table 65: Israel 6 DoF Platform Revenue (million) Forecast, by Application 2019 & 2032
- Table 66: Israel 6 DoF Platform Volume (K) Forecast, by Application 2019 & 2032
- Table 67: GCC 6 DoF Platform Revenue (million) Forecast, by Application 2019 & 2032
- Table 68: GCC 6 DoF Platform Volume (K) Forecast, by Application 2019 & 2032
- Table 69: North Africa 6 DoF Platform Revenue (million) Forecast, by Application 2019 & 2032
- Table 70: North Africa 6 DoF Platform Volume (K) Forecast, by Application 2019 & 2032
- Table 71: South Africa 6 DoF Platform Revenue (million) Forecast, by Application 2019 & 2032
- Table 72: South Africa 6 DoF Platform Volume (K) Forecast, by Application 2019 & 2032
- Table 73: Rest of Middle East & Africa 6 DoF Platform Revenue (million) Forecast, by Application 2019 & 2032
- Table 74: Rest of Middle East & Africa 6 DoF Platform Volume (K) Forecast, by Application 2019 & 2032
- Table 75: Global 6 DoF Platform Revenue million Forecast, by Application 2019 & 2032
- Table 76: Global 6 DoF Platform Volume K Forecast, by Application 2019 & 2032
- Table 77: Global 6 DoF Platform Revenue million Forecast, by Types 2019 & 2032
- Table 78: Global 6 DoF Platform Volume K Forecast, by Types 2019 & 2032
- Table 79: Global 6 DoF Platform Revenue million Forecast, by Country 2019 & 2032
- Table 80: Global 6 DoF Platform Volume K Forecast, by Country 2019 & 2032
- Table 81: China 6 DoF Platform Revenue (million) Forecast, by Application 2019 & 2032
- Table 82: China 6 DoF Platform Volume (K) Forecast, by Application 2019 & 2032
- Table 83: India 6 DoF Platform Revenue (million) Forecast, by Application 2019 & 2032
- Table 84: India 6 DoF Platform Volume (K) Forecast, by Application 2019 & 2032
- Table 85: Japan 6 DoF Platform Revenue (million) Forecast, by Application 2019 & 2032
- Table 86: Japan 6 DoF Platform Volume (K) Forecast, by Application 2019 & 2032
- Table 87: South Korea 6 DoF Platform Revenue (million) Forecast, by Application 2019 & 2032
- Table 88: South Korea 6 DoF Platform Volume (K) Forecast, by Application 2019 & 2032
- Table 89: ASEAN 6 DoF Platform Revenue (million) Forecast, by Application 2019 & 2032
- Table 90: ASEAN 6 DoF Platform Volume (K) Forecast, by Application 2019 & 2032
- Table 91: Oceania 6 DoF Platform Revenue (million) Forecast, by Application 2019 & 2032
- Table 92: Oceania 6 DoF Platform Volume (K) Forecast, by Application 2019 & 2032
- Table 93: Rest of Asia Pacific 6 DoF Platform Revenue (million) Forecast, by Application 2019 & 2032
- Table 94: Rest of Asia Pacific 6 DoF Platform Volume (K) Forecast, by Application 2019 & 2032
Frequently Asked Questions
1. What is the projected Compound Annual Growth Rate (CAGR) of the 6 DoF Platform?
The projected CAGR is approximately XX%.
2. Which companies are prominent players in the 6 DoF Platform?
Key companies in the market include Limtech, Xi'an Fangyuanming Technology Co., Ltd., Nanjing Quankong Aviation Technology Co., Ltd., Moog, Tianyu Technology, Foshan Yishili New Technology Co., Ltd., Xixian New District Shuangyu Intelligent Technology Co., Ltd., Wuhan Huazhong Aviation Measurement and Control Technology Co., Ltd., Weier (Beijing) Technology Co., Ltd..
3. What are the main segments of the 6 DoF Platform?
The market segments include Application, Types.
4. Can you provide details about the market size?
The market size is estimated to be USD XXX million as of 2022.
5. What are some drivers contributing to market growth?
N/A
6. What are the notable trends driving market growth?
N/A
7. Are there any restraints impacting market growth?
N/A
8. Can you provide examples of recent developments in the market?
N/A
9. What pricing options are available for accessing the report?
Pricing options include single-user, multi-user, and enterprise licenses priced at USD 3350.00, USD 5025.00, and USD 6700.00 respectively.
10. Is the market size provided in terms of value or volume?
The market size is provided in terms of value, measured in million and volume, measured in K.
11. Are there any specific market keywords associated with the report?
Yes, the market keyword associated with the report is "6 DoF Platform," which aids in identifying and referencing the specific market segment covered.
12. How do I determine which pricing option suits my needs best?
The pricing options vary based on user requirements and access needs. Individual users may opt for single-user licenses, while businesses requiring broader access may choose multi-user or enterprise licenses for cost-effective access to the report.
13. Are there any additional resources or data provided in the 6 DoF Platform report?
While the report offers comprehensive insights, it's advisable to review the specific contents or supplementary materials provided to ascertain if additional resources or data are available.
14. How can I stay updated on further developments or reports in the 6 DoF Platform?
To stay informed about further developments, trends, and reports in the 6 DoF Platform, consider subscribing to industry newsletters, following relevant companies and organizations, or regularly checking reputable industry news sources and publications.
Methodology
Step 1 - Identification of Relevant Samples Size from Population Database


Step 2 - Approaches for Defining Global Market Size (Value, Volume* & Price*)

Note*: In applicable scenarios
Step 3 - Data Sources
Primary Research
- Web Analytics
- Survey Reports
- Research Institute
- Latest Research Reports
- Opinion Leaders
Secondary Research
- Annual Reports
- White Paper
- Latest Press Release
- Industry Association
- Paid Database
- Investor Presentations

Step 4 - Data Triangulation
Involves using different sources of information in order to increase the validity of a study
These sources are likely to be stakeholders in a program - participants, other researchers, program staff, other community members, and so on.
Then we put all data in single framework & apply various statistical tools to find out the dynamic on the market.
During the analysis stage, feedback from the stakeholder groups would be compared to determine areas of agreement as well as areas of divergence
