

Key Insights
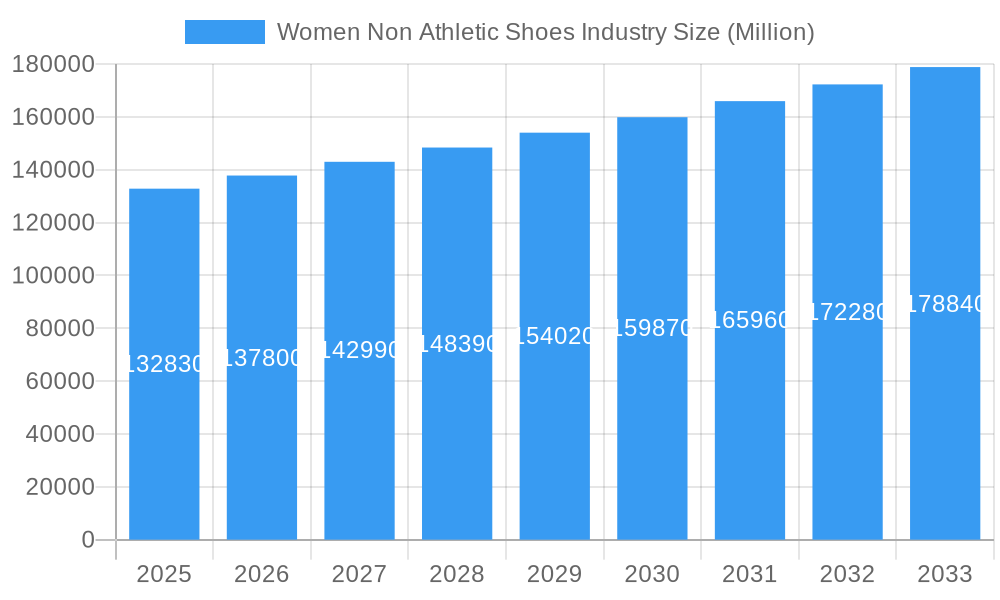
The women's non-athletic footwear market, valued at $132.83 billion in 2025, exhibits a steady Compound Annual Growth Rate (CAGR) of 3.68%, projecting significant expansion to approximately $170 billion by 2033. This growth is driven by several key factors. Firstly, evolving fashion trends consistently introduce new styles and designs, stimulating consumer demand for diverse footwear options. Secondly, the increasing disposable income of women, particularly in developing economies, fuels higher spending on premium and luxury footwear brands. Finally, the expansion of e-commerce platforms provides convenient access to a broader range of products and brands, boosting market reach and sales. The market is segmented by type (boots, heels, flats, sandals, others), distribution channel (online, offline), and category (mass, premium), allowing for a nuanced understanding of consumer preferences and market dynamics. Leading brands such as Aldo, Bata, Tapestry, Kering, and LVMH are strategically positioned to benefit from these trends. Geographic variations exist, with North America and Europe currently holding larger market shares, while Asia Pacific is poised for significant growth in the coming years due to increasing urbanization and rising middle-class incomes. The premium segment is expected to show robust growth driven by rising affluence and the increased preference for high-quality and designer footwear. Competitive pressures exist from both established players and new entrants constantly innovating with design and technology.
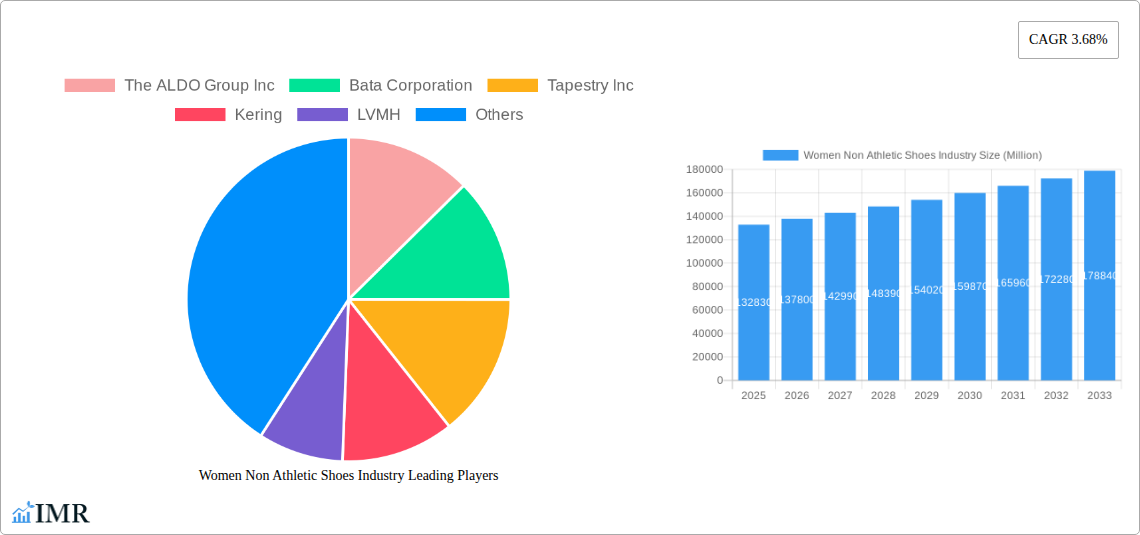
Women Non Athletic Shoes Industry Market Size (In Billion)
The competitive landscape is characterized by a mix of established global players and niche brands catering to specific consumer preferences. Brand loyalty and marketing strategies play a crucial role in shaping market share. While online channels are experiencing robust growth, offline stores remain vital for tactile product experiences and brand engagement, particularly within the premium segment. Challenges include fluctuating raw material prices, economic downturns which can impact consumer spending, and the ongoing need to adapt to shifting fashion trends. Sustainability concerns and ethical sourcing are also gaining traction, impacting manufacturing practices and consumer choices. Overall, the women's non-athletic footwear market presents a lucrative opportunity for businesses capable of adapting to evolving consumer needs and leveraging the diverse distribution channels available. Continued innovation in design, materials, and marketing will be essential for sustained growth and competitive advantage.
Women Non Athletic Shoes Industry Company Market Share
Women's Non-Athletic Shoes Market Report: 2019-2033
This comprehensive report provides a detailed analysis of the global women's non-athletic shoes market, offering invaluable insights for industry professionals, investors, and strategic decision-makers. With a focus on market dynamics, growth trends, and competitive landscapes, this report covers the period from 2019 to 2033, with a base year of 2025 and a forecast period of 2025-2033. The analysis encompasses various segments, including type (boots and shoes, heels and pumps, flats, sandals, other footwear types), distribution channel (online, offline), and category (mass, premium), providing a granular understanding of this dynamic market. The market size is presented in Million units.
Women's Non Athletic Shoes Industry Market Dynamics & Structure
The women's non-athletic footwear market is a highly competitive landscape characterized by a mix of established luxury brands and rapidly growing mass-market players. Market concentration is moderate, with a few dominant players holding significant market share, while numerous smaller brands and private labels compete for market presence. Technological innovation, particularly in materials science and manufacturing processes, plays a vital role in enhancing product features, comfort, and sustainability. Regulatory frameworks related to labor practices, environmental impact, and product safety influence the operations of businesses within the industry. The market also witnesses constant competition from substitute products, including athletic shoes increasingly adopted for casual wear. End-user demographics, particularly shifting consumer preferences and purchasing power, significantly influence market growth. The industry exhibits a moderate level of mergers and acquisitions (M&A) activity, with strategic alliances often aimed at securing supply chains and expanding market reach.
- Market Concentration: Moderate, with top 5 players holding approximately xx% of the market share in 2024.
- Technological Innovation: Focus on sustainable materials, enhanced comfort technologies, and innovative designs.
- Regulatory Framework: Stringent regulations related to labor standards, material safety, and environmental impact.
- Competitive Substitutes: Increasing encroachment from athletic footwear in the casual segment.
- End-User Demographics: Millennials and Gen Z are key influencers, driving demand for fashionable and sustainable footwear.
- M&A Activity: An average of xx M&A deals per year during the historical period (2019-2024), with a focus on supply chain integration and brand expansion.
Women's Non Athletic Shoes Industry Growth Trends & Insights
The global women's non-athletic footwear market experienced a CAGR of xx% during the historical period (2019-2024), reaching a market size of xx Million units in 2024. This growth is attributed to several factors, including increasing disposable incomes, changing fashion trends, and the rising popularity of online retail channels. The market penetration rate for premium footwear segments is higher in developed economies, while mass-market segments are experiencing substantial growth in developing countries. Technological disruptions, such as the integration of 3D printing in manufacturing and the use of smart materials, are transforming the industry. Consumer behavior shifts, such as the growing preference for sustainable and ethically sourced products, are shaping the market's trajectory. The forecast period (2025-2033) anticipates continued growth, with a projected CAGR of xx%, driven by sustained consumer demand and industry innovations. The market size is expected to reach xx Million units by 2033.
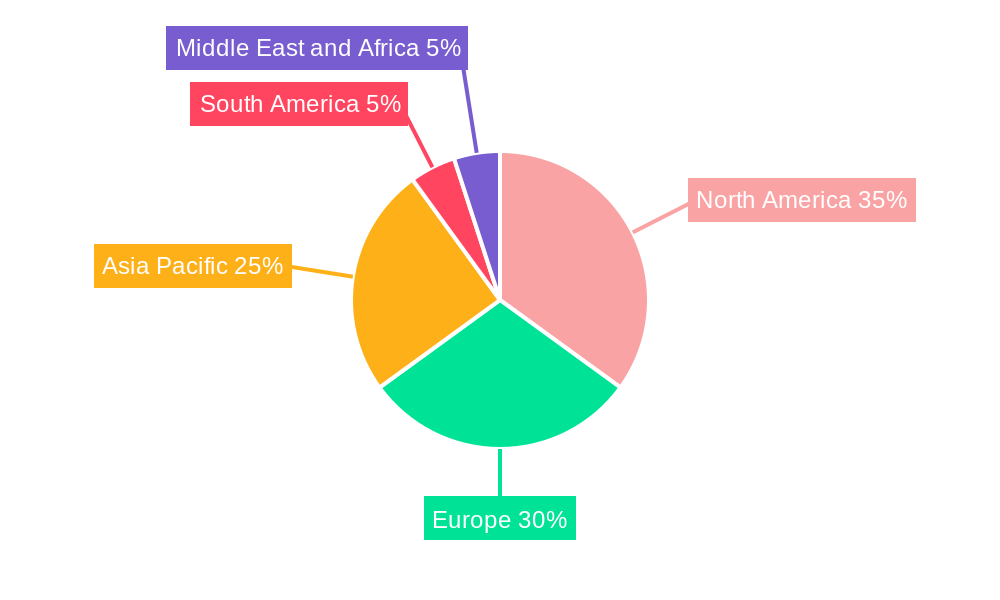
Dominant Regions, Countries, or Segments in Women's Non Athletic Shoes Industry
North America and Europe currently hold the largest market share in the women's non-athletic footwear market due to high consumer spending power and established fashion industries. However, Asia-Pacific is expected to experience the fastest growth during the forecast period, driven by rising disposable incomes and a growing young population. Within the segments:
By Type: Heels and pumps maintain the highest market share due to consistent demand for formal and occasion wear. However, flats and sandals are growing rapidly driven by casual wear trends.
By Distribution Channel: Online retail is rapidly gaining market share due to convenience and wider selection, while offline retail maintains dominance in premium segments.
By Category: The Premium segment demonstrates higher profit margins but slower growth compared to the rapidly expanding Mass segment.
Key Drivers: Strong consumer spending power in developed economies, rising disposable incomes in developing countries, rapid growth of online retail, and increasing demand for diverse styles and sustainable materials.
Women's Non Athletic Shoes Industry Product Landscape
The women's non-athletic footwear market features a wide range of products, showcasing diverse designs, materials, and functionalities. Innovation focuses on comfort technologies like cushioned insoles and flexible soles, while material innovation centers on sustainable alternatives like recycled plastics and vegan leather. Key selling propositions include style, comfort, durability, and sustainability. Technological advancements include the use of 3D-printed midsoles for customized fit and advanced manufacturing techniques to reduce waste.
Key Drivers, Barriers & Challenges in Women's Non Athletic Shoes Industry
Key Drivers: Rising disposable incomes, growing fashion consciousness, increasing online retail penetration, and technological innovations in materials and manufacturing processes are driving market growth. Government policies promoting sustainable manufacturing also contribute positively.
Key Challenges: Fluctuations in raw material prices, intense competition, evolving consumer preferences, maintaining supply chain efficiency, and ensuring ethical and sustainable sourcing practices pose significant challenges. Supply chain disruptions, particularly those experienced in recent years, have impacted production and distribution, resulting in xx% decrease in production in 2022 (estimated).
Emerging Opportunities in Women's Non Athletic Shoes Industry
Emerging opportunities lie in the expansion into untapped markets, particularly in developing economies with rising middle classes. The increasing demand for sustainable and ethically produced footwear presents significant opportunities for brands committed to responsible manufacturing. Personalized footwear solutions using 3D printing and customized designs cater to individual preferences.
Growth Accelerators in the Women's Non Athletic Shoes Industry
Long-term growth will be driven by technological breakthroughs in material science, leading to lighter, more durable, and sustainable footwear. Strategic partnerships and collaborations between brands and retailers will facilitate market expansion and enhance distribution capabilities. Investing in marketing campaigns that highlight sustainability and ethical practices will resonate with the growing environmentally conscious consumer base.
Key Players Shaping the Women's Non Athletic Shoes Industry Market
- The ALDO Group Inc
- Bata Corporation
- Tapestry Inc
- Kering
- LVMH
- Capri Holdings
- Prada SpA
- LIR SRL
- CHANEL
- VF Corporation
- List Not Exhaustive
Notable Milestones in Women's Non Athletic Shoes Industry Sector
- June 2021: Louis Vuitton launched the LV Squad sneaker and LV Sunset mule campaign featuring Emma Chamberlain and Charli D'Amelio, boosting brand visibility among younger demographics.
- June 2021: Prada SPA and Ermenegildo Zegna acquired a 40% stake each in Filati Biagioli Modesto SPA, strengthening their supply chain control.
- October 2020: CHANEL acquired a majority stake in Ballin, enhancing its supply chain and vertical integration.
In-Depth Women's Non Athletic Shoes Industry Market Outlook
The future of the women's non-athletic footwear market is promising, with sustained growth expected throughout the forecast period. Continued innovation in materials, designs, and manufacturing processes, combined with strategic partnerships and the expansion into new markets, will propel market growth. Brands emphasizing sustainability and ethical practices will attract increasingly conscious consumers, shaping the future of this dynamic industry. The market is poised for significant expansion, particularly in the Asia-Pacific region, driven by emerging economies and burgeoning consumer demand.
Women Non Athletic Shoes Industry Segmentation
-
1. Type
- 1.1. Boots and Shoes
- 1.2. Heels and Pumps
- 1.3. Flats
- 1.4. Sandals
- 1.5. Other Footwear Types
-
2. Distribution Channel
- 2.1. Online
- 2.2. Offline
-
3. Category
- 3.1. Mass
- 3.2. Premium
Women Non Athletic Shoes Industry Segmentation By Geography
-
1. North America
- 1.1. United States
- 1.2. Canada
- 1.3. Rest of North America
-
2. Europe
- 2.1. Spain
- 2.2. United Kingdom
- 2.3. Germany
- 2.4. France
- 2.5. Italy
- 2.6. Rest of Europe
-
3. Asia Pacific
- 3.1. China
- 3.2. Japan
- 3.3. India
- 3.4. Australia
- 3.5. Rest of Asia Pacific
-
4. South America
- 4.1. Brazil
- 4.2. Argentina
- 4.3. Rest of South America
-
5. Middle East and Africa
- 5.1. South Africa
- 5.2. Saudi Arabia
- 5.3. Rest of Middle East and Africa
Women Non Athletic Shoes Industry Regional Market Share
Geographic Coverage of Women Non Athletic Shoes Industry
Women Non Athletic Shoes Industry REPORT HIGHLIGHTS
| Aspects | Details |
|---|---|
| Study Period | 2020-2034 |
| Base Year | 2025 |
| Estimated Year | 2026 |
| Forecast Period | 2026-2034 |
| Historical Period | 2020-2025 |
| Growth Rate | CAGR of 3.68% from 2020-2034 |
| Segmentation |
|
Table of Contents
- 1. Introduction
- 1.1. Research Scope
- 1.2. Market Segmentation
- 1.3. Research Objective
- 1.4. Definitions and Assumptions
- 2. Executive Summary
- 2.1. Market Snapshot
- 3. Market Dynamics
- 3.1. Market Drivers
- 3.2. Market Restrains
- 3.3. Market Trends
- 3.4. Market Opportunities
- 4. Market Factor Analysis
- 4.1. Porters Five Forces
- 4.1.1. Bargaining Power of Suppliers
- 4.1.2. Bargaining Power of Buyers
- 4.1.3. Threat of New Entrants
- 4.1.4. Threat of Substitutes
- 4.1.5. Competitive Rivalry
- 4.2. PESTEL analysis
- 4.3. BCG Analysis
- 4.3.1. Stars (High Growth, High Market Share)
- 4.3.2. Cash Cows (Low Growth, High Market Share)
- 4.3.3. Question Mark (High Growth, Low Market Share)
- 4.3.4. Dogs (Low Growth, Low Market Share)
- 4.4. Ansoff Matrix Analysis
- 4.5. Supply Chain Analysis
- 4.6. Regulatory Landscape
- 4.7. Current Market Potential and Opportunity Assessment (TAM–SAM–SOM Framework)
- 4.8. IMR Analyst Note
- 4.1. Porters Five Forces
- 5. Market Analysis, Insights and Forecast 2021-2033
- 5.1. Market Analysis, Insights and Forecast - by Type
- 5.1.1. Boots and Shoes
- 5.1.2. Heels and Pumps
- 5.1.3. Flats
- 5.1.4. Sandals
- 5.1.5. Other Footwear Types
- 5.2. Market Analysis, Insights and Forecast - by Distribution Channel
- 5.2.1. Online
- 5.2.2. Offline
- 5.3. Market Analysis, Insights and Forecast - by Category
- 5.3.1. Mass
- 5.3.2. Premium
- 5.4. Market Analysis, Insights and Forecast - by Region
- 5.4.1. North America
- 5.4.2. Europe
- 5.4.3. Asia Pacific
- 5.4.4. South America
- 5.4.5. Middle East and Africa
- 5.1. Market Analysis, Insights and Forecast - by Type
- 6. Global Women Non Athletic Shoes Industry Analysis, Insights and Forecast, 2021-2033
- 6.1. Market Analysis, Insights and Forecast - by Type
- 6.1.1. Boots and Shoes
- 6.1.2. Heels and Pumps
- 6.1.3. Flats
- 6.1.4. Sandals
- 6.1.5. Other Footwear Types
- 6.2. Market Analysis, Insights and Forecast - by Distribution Channel
- 6.2.1. Online
- 6.2.2. Offline
- 6.3. Market Analysis, Insights and Forecast - by Category
- 6.3.1. Mass
- 6.3.2. Premium
- 6.1. Market Analysis, Insights and Forecast - by Type
- 7. North America Women Non Athletic Shoes Industry Analysis, Insights and Forecast, 2020-2032
- 7.1. Market Analysis, Insights and Forecast - by Type
- 7.1.1. Boots and Shoes
- 7.1.2. Heels and Pumps
- 7.1.3. Flats
- 7.1.4. Sandals
- 7.1.5. Other Footwear Types
- 7.2. Market Analysis, Insights and Forecast - by Distribution Channel
- 7.2.1. Online
- 7.2.2. Offline
- 7.3. Market Analysis, Insights and Forecast - by Category
- 7.3.1. Mass
- 7.3.2. Premium
- 7.1. Market Analysis, Insights and Forecast - by Type
- 8. Europe Women Non Athletic Shoes Industry Analysis, Insights and Forecast, 2020-2032
- 8.1. Market Analysis, Insights and Forecast - by Type
- 8.1.1. Boots and Shoes
- 8.1.2. Heels and Pumps
- 8.1.3. Flats
- 8.1.4. Sandals
- 8.1.5. Other Footwear Types
- 8.2. Market Analysis, Insights and Forecast - by Distribution Channel
- 8.2.1. Online
- 8.2.2. Offline
- 8.3. Market Analysis, Insights and Forecast - by Category
- 8.3.1. Mass
- 8.3.2. Premium
- 8.1. Market Analysis, Insights and Forecast - by Type
- 9. Asia Pacific Women Non Athletic Shoes Industry Analysis, Insights and Forecast, 2020-2032
- 9.1. Market Analysis, Insights and Forecast - by Type
- 9.1.1. Boots and Shoes
- 9.1.2. Heels and Pumps
- 9.1.3. Flats
- 9.1.4. Sandals
- 9.1.5. Other Footwear Types
- 9.2. Market Analysis, Insights and Forecast - by Distribution Channel
- 9.2.1. Online
- 9.2.2. Offline
- 9.3. Market Analysis, Insights and Forecast - by Category
- 9.3.1. Mass
- 9.3.2. Premium
- 9.1. Market Analysis, Insights and Forecast - by Type
- 10. South America Women Non Athletic Shoes Industry Analysis, Insights and Forecast, 2020-2032
- 10.1. Market Analysis, Insights and Forecast - by Type
- 10.1.1. Boots and Shoes
- 10.1.2. Heels and Pumps
- 10.1.3. Flats
- 10.1.4. Sandals
- 10.1.5. Other Footwear Types
- 10.2. Market Analysis, Insights and Forecast - by Distribution Channel
- 10.2.1. Online
- 10.2.2. Offline
- 10.3. Market Analysis, Insights and Forecast - by Category
- 10.3.1. Mass
- 10.3.2. Premium
- 10.1. Market Analysis, Insights and Forecast - by Type
- 11. Middle East and Africa Women Non Athletic Shoes Industry Analysis, Insights and Forecast, 2020-2032
- 11.1. Market Analysis, Insights and Forecast - by Type
- 11.1.1. Boots and Shoes
- 11.1.2. Heels and Pumps
- 11.1.3. Flats
- 11.1.4. Sandals
- 11.1.5. Other Footwear Types
- 11.2. Market Analysis, Insights and Forecast - by Distribution Channel
- 11.2.1. Online
- 11.2.2. Offline
- 11.3. Market Analysis, Insights and Forecast - by Category
- 11.3.1. Mass
- 11.3.2. Premium
- 11.1. Market Analysis, Insights and Forecast - by Type
- 12. Competitive Analysis
- 12.1. Company Profiles
- 12.1.1 The ALDO Group Inc
- 12.1.1.1. Company Overview
- 12.1.1.2. Products
- 12.1.1.3. Company Financials
- 12.1.1.4. SWOT Analysis
- 12.1.2 Bata Corporation
- 12.1.2.1. Company Overview
- 12.1.2.2. Products
- 12.1.2.3. Company Financials
- 12.1.2.4. SWOT Analysis
- 12.1.3 Tapestry Inc
- 12.1.3.1. Company Overview
- 12.1.3.2. Products
- 12.1.3.3. Company Financials
- 12.1.3.4. SWOT Analysis
- 12.1.4 Kering
- 12.1.4.1. Company Overview
- 12.1.4.2. Products
- 12.1.4.3. Company Financials
- 12.1.4.4. SWOT Analysis
- 12.1.5 LVMH
- 12.1.5.1. Company Overview
- 12.1.5.2. Products
- 12.1.5.3. Company Financials
- 12.1.5.4. SWOT Analysis
- 12.1.6 Capri Holdings
- 12.1.6.1. Company Overview
- 12.1.6.2. Products
- 12.1.6.3. Company Financials
- 12.1.6.4. SWOT Analysis
- 12.1.7 Prada SpA
- 12.1.7.1. Company Overview
- 12.1.7.2. Products
- 12.1.7.3. Company Financials
- 12.1.7.4. SWOT Analysis
- 12.1.8 LIR SRL
- 12.1.8.1. Company Overview
- 12.1.8.2. Products
- 12.1.8.3. Company Financials
- 12.1.8.4. SWOT Analysis
- 12.1.9 CHANEL
- 12.1.9.1. Company Overview
- 12.1.9.2. Products
- 12.1.9.3. Company Financials
- 12.1.9.4. SWOT Analysis
- 12.1.10 VF Corporation*List Not Exhaustive
- 12.1.10.1. Company Overview
- 12.1.10.2. Products
- 12.1.10.3. Company Financials
- 12.1.10.4. SWOT Analysis
- 12.1.1 The ALDO Group Inc
- 12.2. Market Entropy
- 12.2.1 Company's Key Areas Served
- 12.2.2 Recent Developments
- 12.3. Company Market Share Analysis 2025
- 12.3.1 Top 5 Companies Market Share Analysis
- 12.3.2 Top 3 Companies Market Share Analysis
- 12.4. List of Potential Customers
- 13. Research Methodology
List of Figures
- Figure 1: Global Women Non Athletic Shoes Industry Revenue Breakdown (Million, %) by Region 2025 & 2033
- Figure 2: Global Women Non Athletic Shoes Industry Volume Breakdown (K Units, %) by Region 2025 & 2033
- Figure 3: North America Women Non Athletic Shoes Industry Revenue (Million), by Type 2025 & 2033
- Figure 4: North America Women Non Athletic Shoes Industry Volume (K Units), by Type 2025 & 2033
- Figure 5: North America Women Non Athletic Shoes Industry Revenue Share (%), by Type 2025 & 2033
- Figure 6: North America Women Non Athletic Shoes Industry Volume Share (%), by Type 2025 & 2033
- Figure 7: North America Women Non Athletic Shoes Industry Revenue (Million), by Distribution Channel 2025 & 2033
- Figure 8: North America Women Non Athletic Shoes Industry Volume (K Units), by Distribution Channel 2025 & 2033
- Figure 9: North America Women Non Athletic Shoes Industry Revenue Share (%), by Distribution Channel 2025 & 2033
- Figure 10: North America Women Non Athletic Shoes Industry Volume Share (%), by Distribution Channel 2025 & 2033
- Figure 11: North America Women Non Athletic Shoes Industry Revenue (Million), by Category 2025 & 2033
- Figure 12: North America Women Non Athletic Shoes Industry Volume (K Units), by Category 2025 & 2033
- Figure 13: North America Women Non Athletic Shoes Industry Revenue Share (%), by Category 2025 & 2033
- Figure 14: North America Women Non Athletic Shoes Industry Volume Share (%), by Category 2025 & 2033
- Figure 15: North America Women Non Athletic Shoes Industry Revenue (Million), by Country 2025 & 2033
- Figure 16: North America Women Non Athletic Shoes Industry Volume (K Units), by Country 2025 & 2033
- Figure 17: North America Women Non Athletic Shoes Industry Revenue Share (%), by Country 2025 & 2033
- Figure 18: North America Women Non Athletic Shoes Industry Volume Share (%), by Country 2025 & 2033
- Figure 19: Europe Women Non Athletic Shoes Industry Revenue (Million), by Type 2025 & 2033
- Figure 20: Europe Women Non Athletic Shoes Industry Volume (K Units), by Type 2025 & 2033
- Figure 21: Europe Women Non Athletic Shoes Industry Revenue Share (%), by Type 2025 & 2033
- Figure 22: Europe Women Non Athletic Shoes Industry Volume Share (%), by Type 2025 & 2033
- Figure 23: Europe Women Non Athletic Shoes Industry Revenue (Million), by Distribution Channel 2025 & 2033
- Figure 24: Europe Women Non Athletic Shoes Industry Volume (K Units), by Distribution Channel 2025 & 2033
- Figure 25: Europe Women Non Athletic Shoes Industry Revenue Share (%), by Distribution Channel 2025 & 2033
- Figure 26: Europe Women Non Athletic Shoes Industry Volume Share (%), by Distribution Channel 2025 & 2033
- Figure 27: Europe Women Non Athletic Shoes Industry Revenue (Million), by Category 2025 & 2033
- Figure 28: Europe Women Non Athletic Shoes Industry Volume (K Units), by Category 2025 & 2033
- Figure 29: Europe Women Non Athletic Shoes Industry Revenue Share (%), by Category 2025 & 2033
- Figure 30: Europe Women Non Athletic Shoes Industry Volume Share (%), by Category 2025 & 2033
- Figure 31: Europe Women Non Athletic Shoes Industry Revenue (Million), by Country 2025 & 2033
- Figure 32: Europe Women Non Athletic Shoes Industry Volume (K Units), by Country 2025 & 2033
- Figure 33: Europe Women Non Athletic Shoes Industry Revenue Share (%), by Country 2025 & 2033
- Figure 34: Europe Women Non Athletic Shoes Industry Volume Share (%), by Country 2025 & 2033
- Figure 35: Asia Pacific Women Non Athletic Shoes Industry Revenue (Million), by Type 2025 & 2033
- Figure 36: Asia Pacific Women Non Athletic Shoes Industry Volume (K Units), by Type 2025 & 2033
- Figure 37: Asia Pacific Women Non Athletic Shoes Industry Revenue Share (%), by Type 2025 & 2033
- Figure 38: Asia Pacific Women Non Athletic Shoes Industry Volume Share (%), by Type 2025 & 2033
- Figure 39: Asia Pacific Women Non Athletic Shoes Industry Revenue (Million), by Distribution Channel 2025 & 2033
- Figure 40: Asia Pacific Women Non Athletic Shoes Industry Volume (K Units), by Distribution Channel 2025 & 2033
- Figure 41: Asia Pacific Women Non Athletic Shoes Industry Revenue Share (%), by Distribution Channel 2025 & 2033
- Figure 42: Asia Pacific Women Non Athletic Shoes Industry Volume Share (%), by Distribution Channel 2025 & 2033
- Figure 43: Asia Pacific Women Non Athletic Shoes Industry Revenue (Million), by Category 2025 & 2033
- Figure 44: Asia Pacific Women Non Athletic Shoes Industry Volume (K Units), by Category 2025 & 2033
- Figure 45: Asia Pacific Women Non Athletic Shoes Industry Revenue Share (%), by Category 2025 & 2033
- Figure 46: Asia Pacific Women Non Athletic Shoes Industry Volume Share (%), by Category 2025 & 2033
- Figure 47: Asia Pacific Women Non Athletic Shoes Industry Revenue (Million), by Country 2025 & 2033
- Figure 48: Asia Pacific Women Non Athletic Shoes Industry Volume (K Units), by Country 2025 & 2033
- Figure 49: Asia Pacific Women Non Athletic Shoes Industry Revenue Share (%), by Country 2025 & 2033
- Figure 50: Asia Pacific Women Non Athletic Shoes Industry Volume Share (%), by Country 2025 & 2033
- Figure 51: South America Women Non Athletic Shoes Industry Revenue (Million), by Type 2025 & 2033
- Figure 52: South America Women Non Athletic Shoes Industry Volume (K Units), by Type 2025 & 2033
- Figure 53: South America Women Non Athletic Shoes Industry Revenue Share (%), by Type 2025 & 2033
- Figure 54: South America Women Non Athletic Shoes Industry Volume Share (%), by Type 2025 & 2033
- Figure 55: South America Women Non Athletic Shoes Industry Revenue (Million), by Distribution Channel 2025 & 2033
- Figure 56: South America Women Non Athletic Shoes Industry Volume (K Units), by Distribution Channel 2025 & 2033
- Figure 57: South America Women Non Athletic Shoes Industry Revenue Share (%), by Distribution Channel 2025 & 2033
- Figure 58: South America Women Non Athletic Shoes Industry Volume Share (%), by Distribution Channel 2025 & 2033
- Figure 59: South America Women Non Athletic Shoes Industry Revenue (Million), by Category 2025 & 2033
- Figure 60: South America Women Non Athletic Shoes Industry Volume (K Units), by Category 2025 & 2033
- Figure 61: South America Women Non Athletic Shoes Industry Revenue Share (%), by Category 2025 & 2033
- Figure 62: South America Women Non Athletic Shoes Industry Volume Share (%), by Category 2025 & 2033
- Figure 63: South America Women Non Athletic Shoes Industry Revenue (Million), by Country 2025 & 2033
- Figure 64: South America Women Non Athletic Shoes Industry Volume (K Units), by Country 2025 & 2033
- Figure 65: South America Women Non Athletic Shoes Industry Revenue Share (%), by Country 2025 & 2033
- Figure 66: South America Women Non Athletic Shoes Industry Volume Share (%), by Country 2025 & 2033
- Figure 67: Middle East and Africa Women Non Athletic Shoes Industry Revenue (Million), by Type 2025 & 2033
- Figure 68: Middle East and Africa Women Non Athletic Shoes Industry Volume (K Units), by Type 2025 & 2033
- Figure 69: Middle East and Africa Women Non Athletic Shoes Industry Revenue Share (%), by Type 2025 & 2033
- Figure 70: Middle East and Africa Women Non Athletic Shoes Industry Volume Share (%), by Type 2025 & 2033
- Figure 71: Middle East and Africa Women Non Athletic Shoes Industry Revenue (Million), by Distribution Channel 2025 & 2033
- Figure 72: Middle East and Africa Women Non Athletic Shoes Industry Volume (K Units), by Distribution Channel 2025 & 2033
- Figure 73: Middle East and Africa Women Non Athletic Shoes Industry Revenue Share (%), by Distribution Channel 2025 & 2033
- Figure 74: Middle East and Africa Women Non Athletic Shoes Industry Volume Share (%), by Distribution Channel 2025 & 2033
- Figure 75: Middle East and Africa Women Non Athletic Shoes Industry Revenue (Million), by Category 2025 & 2033
- Figure 76: Middle East and Africa Women Non Athletic Shoes Industry Volume (K Units), by Category 2025 & 2033
- Figure 77: Middle East and Africa Women Non Athletic Shoes Industry Revenue Share (%), by Category 2025 & 2033
- Figure 78: Middle East and Africa Women Non Athletic Shoes Industry Volume Share (%), by Category 2025 & 2033
- Figure 79: Middle East and Africa Women Non Athletic Shoes Industry Revenue (Million), by Country 2025 & 2033
- Figure 80: Middle East and Africa Women Non Athletic Shoes Industry Volume (K Units), by Country 2025 & 2033
- Figure 81: Middle East and Africa Women Non Athletic Shoes Industry Revenue Share (%), by Country 2025 & 2033
- Figure 82: Middle East and Africa Women Non Athletic Shoes Industry Volume Share (%), by Country 2025 & 2033
List of Tables
- Table 1: Global Women Non Athletic Shoes Industry Revenue Million Forecast, by Type 2020 & 2033
- Table 2: Global Women Non Athletic Shoes Industry Volume K Units Forecast, by Type 2020 & 2033
- Table 3: Global Women Non Athletic Shoes Industry Revenue Million Forecast, by Distribution Channel 2020 & 2033
- Table 4: Global Women Non Athletic Shoes Industry Volume K Units Forecast, by Distribution Channel 2020 & 2033
- Table 5: Global Women Non Athletic Shoes Industry Revenue Million Forecast, by Category 2020 & 2033
- Table 6: Global Women Non Athletic Shoes Industry Volume K Units Forecast, by Category 2020 & 2033
- Table 7: Global Women Non Athletic Shoes Industry Revenue Million Forecast, by Region 2020 & 2033
- Table 8: Global Women Non Athletic Shoes Industry Volume K Units Forecast, by Region 2020 & 2033
- Table 9: Global Women Non Athletic Shoes Industry Revenue Million Forecast, by Type 2020 & 2033
- Table 10: Global Women Non Athletic Shoes Industry Volume K Units Forecast, by Type 2020 & 2033
- Table 11: Global Women Non Athletic Shoes Industry Revenue Million Forecast, by Distribution Channel 2020 & 2033
- Table 12: Global Women Non Athletic Shoes Industry Volume K Units Forecast, by Distribution Channel 2020 & 2033
- Table 13: Global Women Non Athletic Shoes Industry Revenue Million Forecast, by Category 2020 & 2033
- Table 14: Global Women Non Athletic Shoes Industry Volume K Units Forecast, by Category 2020 & 2033
- Table 15: Global Women Non Athletic Shoes Industry Revenue Million Forecast, by Country 2020 & 2033
- Table 16: Global Women Non Athletic Shoes Industry Volume K Units Forecast, by Country 2020 & 2033
- Table 17: United States Women Non Athletic Shoes Industry Revenue (Million) Forecast, by Application 2020 & 2033
- Table 18: United States Women Non Athletic Shoes Industry Volume (K Units) Forecast, by Application 2020 & 2033
- Table 19: Canada Women Non Athletic Shoes Industry Revenue (Million) Forecast, by Application 2020 & 2033
- Table 20: Canada Women Non Athletic Shoes Industry Volume (K Units) Forecast, by Application 2020 & 2033
- Table 21: Rest of North America Women Non Athletic Shoes Industry Revenue (Million) Forecast, by Application 2020 & 2033
- Table 22: Rest of North America Women Non Athletic Shoes Industry Volume (K Units) Forecast, by Application 2020 & 2033
- Table 23: Global Women Non Athletic Shoes Industry Revenue Million Forecast, by Type 2020 & 2033
- Table 24: Global Women Non Athletic Shoes Industry Volume K Units Forecast, by Type 2020 & 2033
- Table 25: Global Women Non Athletic Shoes Industry Revenue Million Forecast, by Distribution Channel 2020 & 2033
- Table 26: Global Women Non Athletic Shoes Industry Volume K Units Forecast, by Distribution Channel 2020 & 2033
- Table 27: Global Women Non Athletic Shoes Industry Revenue Million Forecast, by Category 2020 & 2033
- Table 28: Global Women Non Athletic Shoes Industry Volume K Units Forecast, by Category 2020 & 2033
- Table 29: Global Women Non Athletic Shoes Industry Revenue Million Forecast, by Country 2020 & 2033
- Table 30: Global Women Non Athletic Shoes Industry Volume K Units Forecast, by Country 2020 & 2033
- Table 31: Spain Women Non Athletic Shoes Industry Revenue (Million) Forecast, by Application 2020 & 2033
- Table 32: Spain Women Non Athletic Shoes Industry Volume (K Units) Forecast, by Application 2020 & 2033
- Table 33: United Kingdom Women Non Athletic Shoes Industry Revenue (Million) Forecast, by Application 2020 & 2033
- Table 34: United Kingdom Women Non Athletic Shoes Industry Volume (K Units) Forecast, by Application 2020 & 2033
- Table 35: Germany Women Non Athletic Shoes Industry Revenue (Million) Forecast, by Application 2020 & 2033
- Table 36: Germany Women Non Athletic Shoes Industry Volume (K Units) Forecast, by Application 2020 & 2033
- Table 37: France Women Non Athletic Shoes Industry Revenue (Million) Forecast, by Application 2020 & 2033
- Table 38: France Women Non Athletic Shoes Industry Volume (K Units) Forecast, by Application 2020 & 2033
- Table 39: Italy Women Non Athletic Shoes Industry Revenue (Million) Forecast, by Application 2020 & 2033
- Table 40: Italy Women Non Athletic Shoes Industry Volume (K Units) Forecast, by Application 2020 & 2033
- Table 41: Rest of Europe Women Non Athletic Shoes Industry Revenue (Million) Forecast, by Application 2020 & 2033
- Table 42: Rest of Europe Women Non Athletic Shoes Industry Volume (K Units) Forecast, by Application 2020 & 2033
- Table 43: Global Women Non Athletic Shoes Industry Revenue Million Forecast, by Type 2020 & 2033
- Table 44: Global Women Non Athletic Shoes Industry Volume K Units Forecast, by Type 2020 & 2033
- Table 45: Global Women Non Athletic Shoes Industry Revenue Million Forecast, by Distribution Channel 2020 & 2033
- Table 46: Global Women Non Athletic Shoes Industry Volume K Units Forecast, by Distribution Channel 2020 & 2033
- Table 47: Global Women Non Athletic Shoes Industry Revenue Million Forecast, by Category 2020 & 2033
- Table 48: Global Women Non Athletic Shoes Industry Volume K Units Forecast, by Category 2020 & 2033
- Table 49: Global Women Non Athletic Shoes Industry Revenue Million Forecast, by Country 2020 & 2033
- Table 50: Global Women Non Athletic Shoes Industry Volume K Units Forecast, by Country 2020 & 2033
- Table 51: China Women Non Athletic Shoes Industry Revenue (Million) Forecast, by Application 2020 & 2033
- Table 52: China Women Non Athletic Shoes Industry Volume (K Units) Forecast, by Application 2020 & 2033
- Table 53: Japan Women Non Athletic Shoes Industry Revenue (Million) Forecast, by Application 2020 & 2033
- Table 54: Japan Women Non Athletic Shoes Industry Volume (K Units) Forecast, by Application 2020 & 2033
- Table 55: India Women Non Athletic Shoes Industry Revenue (Million) Forecast, by Application 2020 & 2033
- Table 56: India Women Non Athletic Shoes Industry Volume (K Units) Forecast, by Application 2020 & 2033
- Table 57: Australia Women Non Athletic Shoes Industry Revenue (Million) Forecast, by Application 2020 & 2033
- Table 58: Australia Women Non Athletic Shoes Industry Volume (K Units) Forecast, by Application 2020 & 2033
- Table 59: Rest of Asia Pacific Women Non Athletic Shoes Industry Revenue (Million) Forecast, by Application 2020 & 2033
- Table 60: Rest of Asia Pacific Women Non Athletic Shoes Industry Volume (K Units) Forecast, by Application 2020 & 2033
- Table 61: Global Women Non Athletic Shoes Industry Revenue Million Forecast, by Type 2020 & 2033
- Table 62: Global Women Non Athletic Shoes Industry Volume K Units Forecast, by Type 2020 & 2033
- Table 63: Global Women Non Athletic Shoes Industry Revenue Million Forecast, by Distribution Channel 2020 & 2033
- Table 64: Global Women Non Athletic Shoes Industry Volume K Units Forecast, by Distribution Channel 2020 & 2033
- Table 65: Global Women Non Athletic Shoes Industry Revenue Million Forecast, by Category 2020 & 2033
- Table 66: Global Women Non Athletic Shoes Industry Volume K Units Forecast, by Category 2020 & 2033
- Table 67: Global Women Non Athletic Shoes Industry Revenue Million Forecast, by Country 2020 & 2033
- Table 68: Global Women Non Athletic Shoes Industry Volume K Units Forecast, by Country 2020 & 2033
- Table 69: Brazil Women Non Athletic Shoes Industry Revenue (Million) Forecast, by Application 2020 & 2033
- Table 70: Brazil Women Non Athletic Shoes Industry Volume (K Units) Forecast, by Application 2020 & 2033
- Table 71: Argentina Women Non Athletic Shoes Industry Revenue (Million) Forecast, by Application 2020 & 2033
- Table 72: Argentina Women Non Athletic Shoes Industry Volume (K Units) Forecast, by Application 2020 & 2033
- Table 73: Rest of South America Women Non Athletic Shoes Industry Revenue (Million) Forecast, by Application 2020 & 2033
- Table 74: Rest of South America Women Non Athletic Shoes Industry Volume (K Units) Forecast, by Application 2020 & 2033
- Table 75: Global Women Non Athletic Shoes Industry Revenue Million Forecast, by Type 2020 & 2033
- Table 76: Global Women Non Athletic Shoes Industry Volume K Units Forecast, by Type 2020 & 2033
- Table 77: Global Women Non Athletic Shoes Industry Revenue Million Forecast, by Distribution Channel 2020 & 2033
- Table 78: Global Women Non Athletic Shoes Industry Volume K Units Forecast, by Distribution Channel 2020 & 2033
- Table 79: Global Women Non Athletic Shoes Industry Revenue Million Forecast, by Category 2020 & 2033
- Table 80: Global Women Non Athletic Shoes Industry Volume K Units Forecast, by Category 2020 & 2033
- Table 81: Global Women Non Athletic Shoes Industry Revenue Million Forecast, by Country 2020 & 2033
- Table 82: Global Women Non Athletic Shoes Industry Volume K Units Forecast, by Country 2020 & 2033
- Table 83: South Africa Women Non Athletic Shoes Industry Revenue (Million) Forecast, by Application 2020 & 2033
- Table 84: South Africa Women Non Athletic Shoes Industry Volume (K Units) Forecast, by Application 2020 & 2033
- Table 85: Saudi Arabia Women Non Athletic Shoes Industry Revenue (Million) Forecast, by Application 2020 & 2033
- Table 86: Saudi Arabia Women Non Athletic Shoes Industry Volume (K Units) Forecast, by Application 2020 & 2033
- Table 87: Rest of Middle East and Africa Women Non Athletic Shoes Industry Revenue (Million) Forecast, by Application 2020 & 2033
- Table 88: Rest of Middle East and Africa Women Non Athletic Shoes Industry Volume (K Units) Forecast, by Application 2020 & 2033
Frequently Asked Questions
1. What is the projected Compound Annual Growth Rate (CAGR) of the Women Non Athletic Shoes Industry?
The projected CAGR is approximately 3.68%.
2. Which companies are prominent players in the Women Non Athletic Shoes Industry?
Key companies in the market include The ALDO Group Inc, Bata Corporation, Tapestry Inc, Kering, LVMH, Capri Holdings, Prada SpA, LIR SRL, CHANEL, VF Corporation*List Not Exhaustive.
3. What are the main segments of the Women Non Athletic Shoes Industry?
The market segments include Type, Distribution Channel, Category.
4. Can you provide details about the market size?
The market size is estimated to be USD 132.83 Million as of 2022.
5. What are some drivers contributing to market growth?
Fast Fashion Trend; Inflating Income Level of Individuals.
6. What are the notable trends driving market growth?
Emergence of E-Commerce.
7. Are there any restraints impacting market growth?
The Presence Of Counterfeit Products.
8. Can you provide examples of recent developments in the market?
In June 2021, Louis Vuitton collaborated with internet superstars Emma Chamberlain and Charli D'Amelio for the launch of the LV Squad sneaker and LV Sunset mule footwear campaign. The new footwear variants have been made available across the brand's stores and online websites.
9. What pricing options are available for accessing the report?
Pricing options include single-user, multi-user, and enterprise licenses priced at USD 4750, USD 5250, and USD 8750 respectively.
10. Is the market size provided in terms of value or volume?
The market size is provided in terms of value, measured in Million and volume, measured in K Units.
11. Are there any specific market keywords associated with the report?
Yes, the market keyword associated with the report is "Women Non Athletic Shoes Industry," which aids in identifying and referencing the specific market segment covered.
12. How do I determine which pricing option suits my needs best?
The pricing options vary based on user requirements and access needs. Individual users may opt for single-user licenses, while businesses requiring broader access may choose multi-user or enterprise licenses for cost-effective access to the report.
13. Are there any additional resources or data provided in the Women Non Athletic Shoes Industry report?
While the report offers comprehensive insights, it's advisable to review the specific contents or supplementary materials provided to ascertain if additional resources or data are available.
14. How can I stay updated on further developments or reports in the Women Non Athletic Shoes Industry?
To stay informed about further developments, trends, and reports in the Women Non Athletic Shoes Industry, consider subscribing to industry newsletters, following relevant companies and organizations, or regularly checking reputable industry news sources and publications.
Methodology
Step 1 - Identification of Relevant Samples Size from Population Database


Step 2 - Approaches for Defining Global Market Size (Value, Volume* & Price*)

Note*: In applicable scenarios
Step 3 - Data Sources
Primary Research
- Web Analytics
- Survey Reports
- Research Institute
- Latest Research Reports
- Opinion Leaders
Secondary Research
- Annual Reports
- White Paper
- Latest Press Release
- Industry Association
- Paid Database
- Investor Presentations

Step 4 - Data Triangulation
Involves using different sources of information in order to increase the validity of a study
These sources are likely to be stakeholders in a program - participants, other researchers, program staff, other community members, and so on.
Then we put all data in single framework & apply various statistical tools to find out the dynamic on the market.
During the analysis stage, feedback from the stakeholder groups would be compared to determine areas of agreement as well as areas of divergence