

Key Insights
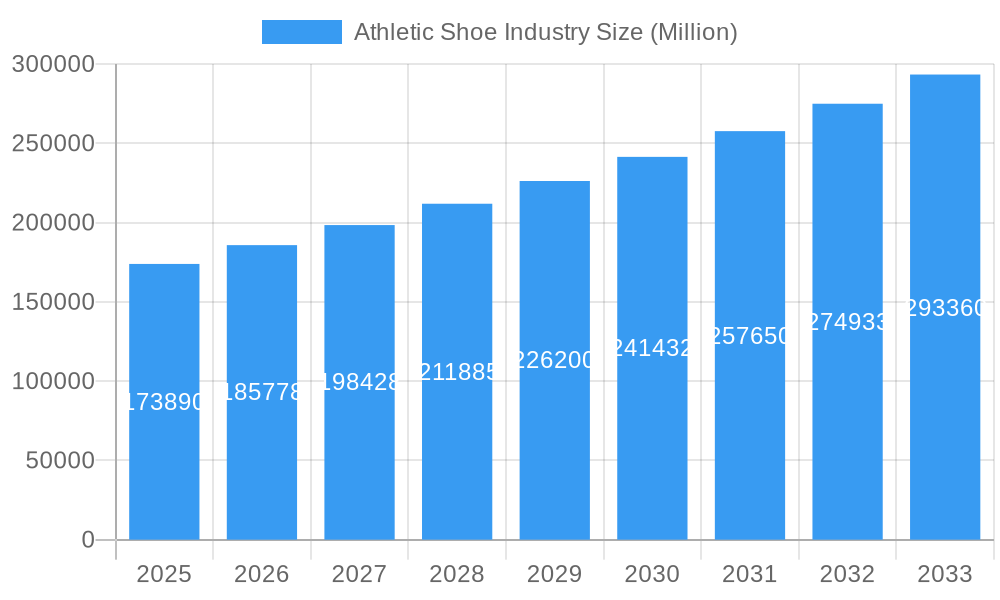
The global athletic shoe market, valued at $173.89 billion in 2025, is projected to experience robust growth, driven by several key factors. The increasing popularity of fitness activities, including running, sports, and hiking, fuels demand across various product types, notably running shoes, sports shoes, and trekking/hiking shoes. Furthermore, the rising disposable incomes in developing economies, coupled with increasing health awareness, contribute significantly to market expansion. The market is segmented by product type, end-user demographics (men, women, children), and distribution channels (specialty stores, supermarkets, online retailers). The dominance of established brands like Nike, Adidas, and Under Armour underscores the competitive landscape, though smaller niche players continue to emerge, particularly within the online retail segment and specialized footwear categories catering to specific sports or activities. Growth is geographically diverse, with North America and Asia Pacific expected to lead, fueled by strong consumer bases and established sporting goods infrastructure.
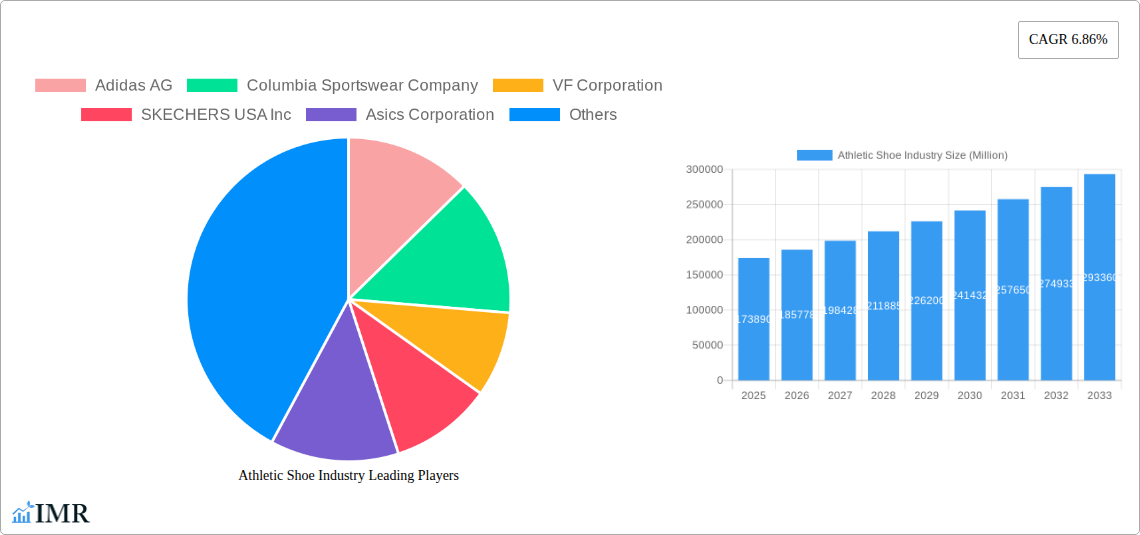
Athletic Shoe Industry Market Size (In Billion)
However, the market faces some constraints. Fluctuating raw material prices, particularly for synthetic materials and rubber, pose a challenge to manufacturers' profit margins. Furthermore, increasing competition necessitates continuous innovation in product design, technology, and marketing strategies to maintain market share. The growth of the online retail channel, while providing access to wider customer bases, also presents challenges related to logistics, customer service, and maintaining brand image and authenticity in a potentially crowded online marketplace. Sustainability concerns regarding manufacturing processes and material sourcing are also gaining prominence, influencing consumer purchasing decisions and putting pressure on companies to adopt more eco-friendly practices. Future growth will likely be influenced by technological advancements in shoe design, the increasing integration of wearable technology, and the evolving preferences of health-conscious consumers.
Athletic Shoe Industry Company Market Share
Athletic Shoe Industry Market Report: 2019-2033
This comprehensive report provides an in-depth analysis of the global athletic shoe market, covering historical performance (2019-2024), current status (2025), and future projections (2025-2033). We delve into market segmentation (by product type, end-user, and distribution channel), key players, emerging trends, and growth opportunities. This report is essential for industry professionals, investors, and anyone seeking a comprehensive understanding of this dynamic market. The market size is presented in million units.
Athletic Shoe Industry Market Dynamics & Structure
This section analyzes the competitive landscape of the athletic shoe market, encompassing market concentration, technological innovation, regulatory frameworks, competitive substitutes, end-user demographics, and merger & acquisition (M&A) activities. The global athletic shoe market is characterized by a high degree of concentration, with a few major players controlling a significant share.
- Market Concentration: Nike and Adidas dominate the market, holding a combined market share of approximately xx%, followed by other key players like Under Armour, Puma, and Asics. Smaller companies and niche brands occupy the remaining xx% market share.
- Technological Innovation: Technological advancements, particularly in materials science and manufacturing processes, are driving innovation. 3D printing and sustainable materials are emerging trends. Barriers to innovation include high R&D costs and the need for specialized expertise.
- Regulatory Frameworks: Regulations concerning product safety, labor practices, and environmental sustainability influence market dynamics, imposing costs and shaping manufacturing practices.
- Competitive Substitutes: The market faces competition from other footwear categories, including casual shoes and sandals. However, the increasing popularity of fitness activities continues to fuel demand for athletic shoes.
- End-User Demographics: The market is segmented by gender and age group, with men's athletic shoes holding the largest market share (xx million units), followed by women's (xx million units) and children's (xx million units) segments.
- M&A Trends: The athletic shoe industry witnesses occasional M&A activities, driven by the need for market expansion, product diversification, and access to new technologies. Over the past five years, the average number of deals per year has been approximately xx.
Athletic Shoe Industry Growth Trends & Insights
This section analyzes the historical and projected growth of the athletic shoe market, considering market size evolution, adoption rates, technological disruptions, and consumer behavior changes. The market has experienced a Compound Annual Growth Rate (CAGR) of xx% during the period 2019-2024. This growth is attributed to rising disposable incomes, increasing health consciousness, and the popularity of fitness activities globally. The adoption of online retail channels has further fueled market growth. Technological advancements, such as the incorporation of smart technologies in athletic shoes, are expected to accelerate market expansion. Consumer preferences are shifting towards sustainable and ethically produced footwear. Market penetration in developing economies remains high with untapped potential. We project a CAGR of xx% for the forecast period 2025-2033.
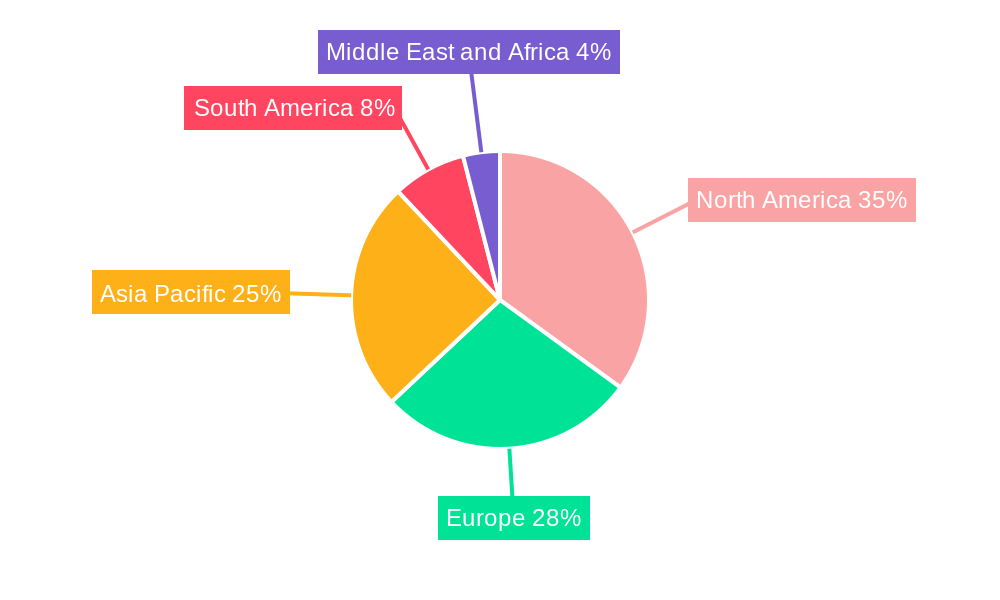
Dominant Regions, Countries, or Segments in Athletic Shoe Industry
This section identifies the leading regions, countries, and segments driving market growth. North America and Europe currently hold the largest market share (xx million units), followed by Asia-Pacific (xx million units). Within product types, running shoes and sports shoes dominate (xx and xx million units respectively), while trekking/hiking shoes and other product types make up a smaller but growing proportion. The men's segment maintains a larger market share than women's and children's. Online retail is experiencing significant growth and surpassing traditional retail channels.
- Key Drivers:
- Rising health awareness and participation in fitness activities
- Increasing disposable income in developing economies
- Technological advancements in shoe design and manufacturing
- Growing popularity of e-commerce and online retail
- Dominance Factors:
- Strong brand recognition and established distribution networks of major players.
- High consumer spending on athletic footwear in developed economies.
- Favorable economic policies and infrastructure in leading regions.
Athletic Shoe Industry Product Landscape
The athletic shoe market offers a diverse range of products designed for various activities, including running, training, basketball, and hiking. Continuous innovation is evident in the incorporation of advanced materials, such as lightweight foams and breathable fabrics, enhancing performance and comfort. The integration of smart technologies, like embedded sensors for tracking performance metrics, adds further value to premium athletic shoes. Manufacturers are constantly striving to offer unique selling propositions such as enhanced cushioning, improved stability, and better responsiveness to create differentiated product offerings.
Key Drivers, Barriers & Challenges in Athletic Shoe Industry
Key Drivers:
- The increasing popularity of fitness and sports activities globally is a major driver.
- Technological advancements in materials and manufacturing enhance shoe performance and comfort.
- Growing disposable incomes and rising health awareness among consumers fuel demand.
Key Challenges:
- Intense competition from numerous established and emerging brands. This results in price wars and squeezes profit margins.
- Fluctuations in raw material costs, like rubber and synthetic fibers, impact production costs.
- Supply chain disruptions and geopolitical instability affect production and distribution. Estimated loss due to disruptions is about xx million units annually.
Emerging Opportunities in Athletic Shoe Industry
- Growing demand for sustainable and ethically produced athletic shoes presents opportunities for brands emphasizing eco-friendly materials and practices.
- The increasing popularity of personalized fitness tracking creates opportunities for smart shoes integrated with wearable technology.
- Expansion into untapped markets in developing economies offers significant growth potential.
Growth Accelerators in the Athletic Shoe Industry
Technological breakthroughs, particularly in material science and manufacturing processes, are key growth accelerators. Strategic partnerships with fitness brands and technology companies enhance product appeal and expand distribution channels. Market expansion into new regions, driven by increased participation in sports and fitness activities, creates further growth opportunities.
Key Players Shaping the Athletic Shoe Industry Market
Notable Milestones in Athletic Shoe Industry Sector
- June 2024: Nike launched the Converse Run Star Trainer, a low-profile shoe combining retro and modern aesthetics.
- June 2024: PUMA announced a worldwide partnership with HYROX, becoming the official apparel and footwear partner.
- June 2024: PUMA launched Deviate NITRO 3 training shoes, featuring NITROFOAM technology.
In-Depth Athletic Shoe Industry Market Outlook
The athletic shoe market is poised for continued growth, driven by favorable macroeconomic factors, rising health consciousness, and ongoing technological innovation. Strategic partnerships, product diversification, and expansion into new markets present significant opportunities for existing players and new entrants. The market's future trajectory will be shaped by the ability of companies to adapt to evolving consumer preferences, address sustainability concerns, and leverage technological advancements to enhance product performance and appeal.
Athletic Shoe Industry Segmentation
-
1. Product Type
- 1.1. Running Shoes
- 1.2. Sports Shoes
- 1.3. Trekking/Hiking Shoes
- 1.4. Other Product Types
-
2. End User
- 2.1. Men
- 2.2. Women
- 2.3. Kids/Children
-
3. Distribution Channel
- 3.1. Sports and Atheletic Goods Stores
- 3.2. Supermarkets/Hypermarkets
- 3.3. Online Retail Stores
- 3.4. Other Distribution Channels
Athletic Shoe Industry Segmentation By Geography
-
1. North America
- 1.1. United States
- 1.2. Canada
- 1.3. Mexico
- 1.4. Rest of North America
-
2. Europe
- 2.1. United Kingdom
- 2.2. Germany
- 2.3. Spain
- 2.4. France
- 2.5. Italy
- 2.6. Netherlands
- 2.7. Rest of Europe
-
3. Asia Pacific
- 3.1. China
- 3.2. Japan
- 3.3. India
- 3.4. Australia
- 3.5. Rest of Asia Pacific
-
4. South America
- 4.1. Brazil
- 4.2. Argentina
- 4.3. Rest of South America
-
5. Middle East and Africa
- 5.1. Saudi Arabia
- 5.2. South Africa
- 5.3. Rest of Middle East and Africa
Athletic Shoe Industry Regional Market Share
Geographic Coverage of Athletic Shoe Industry
Athletic Shoe Industry REPORT HIGHLIGHTS
| Aspects | Details |
|---|---|
| Study Period | 2020-2034 |
| Base Year | 2025 |
| Estimated Year | 2026 |
| Forecast Period | 2026-2034 |
| Historical Period | 2020-2025 |
| Growth Rate | CAGR of 6.86% from 2020-2034 |
| Segmentation |
|
Table of Contents
- 1. Introduction
- 1.1. Research Scope
- 1.2. Market Segmentation
- 1.3. Research Objective
- 1.4. Definitions and Assumptions
- 2. Executive Summary
- 2.1. Market Snapshot
- 3. Market Dynamics
- 3.1. Market Drivers
- 3.2. Market Restrains
- 3.3. Market Trends
- 3.4. Market Opportunities
- 4. Market Factor Analysis
- 4.1. Porters Five Forces
- 4.1.1. Bargaining Power of Suppliers
- 4.1.2. Bargaining Power of Buyers
- 4.1.3. Threat of New Entrants
- 4.1.4. Threat of Substitutes
- 4.1.5. Competitive Rivalry
- 4.2. PESTEL analysis
- 4.3. BCG Analysis
- 4.3.1. Stars (High Growth, High Market Share)
- 4.3.2. Cash Cows (Low Growth, High Market Share)
- 4.3.3. Question Mark (High Growth, Low Market Share)
- 4.3.4. Dogs (Low Growth, Low Market Share)
- 4.4. Ansoff Matrix Analysis
- 4.5. Supply Chain Analysis
- 4.6. Regulatory Landscape
- 4.7. Current Market Potential and Opportunity Assessment (TAM–SAM–SOM Framework)
- 4.8. IMR Analyst Note
- 4.1. Porters Five Forces
- 5. Market Analysis, Insights and Forecast 2021-2033
- 5.1. Market Analysis, Insights and Forecast - by Product Type
- 5.1.1. Running Shoes
- 5.1.2. Sports Shoes
- 5.1.3. Trekking/Hiking Shoes
- 5.1.4. Other Product Types
- 5.2. Market Analysis, Insights and Forecast - by End User
- 5.2.1. Men
- 5.2.2. Women
- 5.2.3. Kids/Children
- 5.3. Market Analysis, Insights and Forecast - by Distribution Channel
- 5.3.1. Sports and Atheletic Goods Stores
- 5.3.2. Supermarkets/Hypermarkets
- 5.3.3. Online Retail Stores
- 5.3.4. Other Distribution Channels
- 5.4. Market Analysis, Insights and Forecast - by Region
- 5.4.1. North America
- 5.4.2. Europe
- 5.4.3. Asia Pacific
- 5.4.4. South America
- 5.4.5. Middle East and Africa
- 5.1. Market Analysis, Insights and Forecast - by Product Type
- 6. Global Athletic Shoe Industry Analysis, Insights and Forecast, 2021-2033
- 6.1. Market Analysis, Insights and Forecast - by Product Type
- 6.1.1. Running Shoes
- 6.1.2. Sports Shoes
- 6.1.3. Trekking/Hiking Shoes
- 6.1.4. Other Product Types
- 6.2. Market Analysis, Insights and Forecast - by End User
- 6.2.1. Men
- 6.2.2. Women
- 6.2.3. Kids/Children
- 6.3. Market Analysis, Insights and Forecast - by Distribution Channel
- 6.3.1. Sports and Atheletic Goods Stores
- 6.3.2. Supermarkets/Hypermarkets
- 6.3.3. Online Retail Stores
- 6.3.4. Other Distribution Channels
- 6.1. Market Analysis, Insights and Forecast - by Product Type
- 7. North America Athletic Shoe Industry Analysis, Insights and Forecast, 2020-2032
- 7.1. Market Analysis, Insights and Forecast - by Product Type
- 7.1.1. Running Shoes
- 7.1.2. Sports Shoes
- 7.1.3. Trekking/Hiking Shoes
- 7.1.4. Other Product Types
- 7.2. Market Analysis, Insights and Forecast - by End User
- 7.2.1. Men
- 7.2.2. Women
- 7.2.3. Kids/Children
- 7.3. Market Analysis, Insights and Forecast - by Distribution Channel
- 7.3.1. Sports and Atheletic Goods Stores
- 7.3.2. Supermarkets/Hypermarkets
- 7.3.3. Online Retail Stores
- 7.3.4. Other Distribution Channels
- 7.1. Market Analysis, Insights and Forecast - by Product Type
- 8. Europe Athletic Shoe Industry Analysis, Insights and Forecast, 2020-2032
- 8.1. Market Analysis, Insights and Forecast - by Product Type
- 8.1.1. Running Shoes
- 8.1.2. Sports Shoes
- 8.1.3. Trekking/Hiking Shoes
- 8.1.4. Other Product Types
- 8.2. Market Analysis, Insights and Forecast - by End User
- 8.2.1. Men
- 8.2.2. Women
- 8.2.3. Kids/Children
- 8.3. Market Analysis, Insights and Forecast - by Distribution Channel
- 8.3.1. Sports and Atheletic Goods Stores
- 8.3.2. Supermarkets/Hypermarkets
- 8.3.3. Online Retail Stores
- 8.3.4. Other Distribution Channels
- 8.1. Market Analysis, Insights and Forecast - by Product Type
- 9. Asia Pacific Athletic Shoe Industry Analysis, Insights and Forecast, 2020-2032
- 9.1. Market Analysis, Insights and Forecast - by Product Type
- 9.1.1. Running Shoes
- 9.1.2. Sports Shoes
- 9.1.3. Trekking/Hiking Shoes
- 9.1.4. Other Product Types
- 9.2. Market Analysis, Insights and Forecast - by End User
- 9.2.1. Men
- 9.2.2. Women
- 9.2.3. Kids/Children
- 9.3. Market Analysis, Insights and Forecast - by Distribution Channel
- 9.3.1. Sports and Atheletic Goods Stores
- 9.3.2. Supermarkets/Hypermarkets
- 9.3.3. Online Retail Stores
- 9.3.4. Other Distribution Channels
- 9.1. Market Analysis, Insights and Forecast - by Product Type
- 10. South America Athletic Shoe Industry Analysis, Insights and Forecast, 2020-2032
- 10.1. Market Analysis, Insights and Forecast - by Product Type
- 10.1.1. Running Shoes
- 10.1.2. Sports Shoes
- 10.1.3. Trekking/Hiking Shoes
- 10.1.4. Other Product Types
- 10.2. Market Analysis, Insights and Forecast - by End User
- 10.2.1. Men
- 10.2.2. Women
- 10.2.3. Kids/Children
- 10.3. Market Analysis, Insights and Forecast - by Distribution Channel
- 10.3.1. Sports and Atheletic Goods Stores
- 10.3.2. Supermarkets/Hypermarkets
- 10.3.3. Online Retail Stores
- 10.3.4. Other Distribution Channels
- 10.1. Market Analysis, Insights and Forecast - by Product Type
- 11. Middle East and Africa Athletic Shoe Industry Analysis, Insights and Forecast, 2020-2032
- 11.1. Market Analysis, Insights and Forecast - by Product Type
- 11.1.1. Running Shoes
- 11.1.2. Sports Shoes
- 11.1.3. Trekking/Hiking Shoes
- 11.1.4. Other Product Types
- 11.2. Market Analysis, Insights and Forecast - by End User
- 11.2.1. Men
- 11.2.2. Women
- 11.2.3. Kids/Children
- 11.3. Market Analysis, Insights and Forecast - by Distribution Channel
- 11.3.1. Sports and Atheletic Goods Stores
- 11.3.2. Supermarkets/Hypermarkets
- 11.3.3. Online Retail Stores
- 11.3.4. Other Distribution Channels
- 11.1. Market Analysis, Insights and Forecast - by Product Type
- 12. Competitive Analysis
- 12.1. Company Profiles
- 12.1.1 Adidas AG
- 12.1.1.1. Company Overview
- 12.1.1.2. Products
- 12.1.1.3. Company Financials
- 12.1.1.4. SWOT Analysis
- 12.1.2 Columbia Sportswear Company
- 12.1.2.1. Company Overview
- 12.1.2.2. Products
- 12.1.2.3. Company Financials
- 12.1.2.4. SWOT Analysis
- 12.1.3 VF Corporation
- 12.1.3.1. Company Overview
- 12.1.3.2. Products
- 12.1.3.3. Company Financials
- 12.1.3.4. SWOT Analysis
- 12.1.4 SKECHERS USA Inc
- 12.1.4.1. Company Overview
- 12.1.4.2. Products
- 12.1.4.3. Company Financials
- 12.1.4.4. SWOT Analysis
- 12.1.5 Asics Corporation
- 12.1.5.1. Company Overview
- 12.1.5.2. Products
- 12.1.5.3. Company Financials
- 12.1.5.4. SWOT Analysis
- 12.1.6 Puma SE
- 12.1.6.1. Company Overview
- 12.1.6.2. Products
- 12.1.6.3. Company Financials
- 12.1.6.4. SWOT Analysis
- 12.1.7 Under Armour Inc
- 12.1.7.1. Company Overview
- 12.1.7.2. Products
- 12.1.7.3. Company Financials
- 12.1.7.4. SWOT Analysis
- 12.1.8 Nike Inc
- 12.1.8.1. Company Overview
- 12.1.8.2. Products
- 12.1.8.3. Company Financials
- 12.1.8.4. SWOT Analysis
- 12.1.9 New Balance Athletics Inc
- 12.1.9.1. Company Overview
- 12.1.9.2. Products
- 12.1.9.3. Company Financials
- 12.1.9.4. SWOT Analysis
- 12.1.10 Fila
- 12.1.10.1. Company Overview
- 12.1.10.2. Products
- 12.1.10.3. Company Financials
- 12.1.10.4. SWOT Analysis
- 12.1.1 Adidas AG
- 12.2. Market Entropy
- 12.2.1 Company's Key Areas Served
- 12.2.2 Recent Developments
- 12.3. Company Market Share Analysis 2025
- 12.3.1 Top 5 Companies Market Share Analysis
- 12.3.2 Top 3 Companies Market Share Analysis
- 12.4. List of Potential Customers
- 13. Research Methodology
List of Figures
- Figure 1: Global Athletic Shoe Industry Revenue Breakdown (Million, %) by Region 2025 & 2033
- Figure 2: Global Athletic Shoe Industry Volume Breakdown (K Units, %) by Region 2025 & 2033
- Figure 3: North America Athletic Shoe Industry Revenue (Million), by Product Type 2025 & 2033
- Figure 4: North America Athletic Shoe Industry Volume (K Units), by Product Type 2025 & 2033
- Figure 5: North America Athletic Shoe Industry Revenue Share (%), by Product Type 2025 & 2033
- Figure 6: North America Athletic Shoe Industry Volume Share (%), by Product Type 2025 & 2033
- Figure 7: North America Athletic Shoe Industry Revenue (Million), by End User 2025 & 2033
- Figure 8: North America Athletic Shoe Industry Volume (K Units), by End User 2025 & 2033
- Figure 9: North America Athletic Shoe Industry Revenue Share (%), by End User 2025 & 2033
- Figure 10: North America Athletic Shoe Industry Volume Share (%), by End User 2025 & 2033
- Figure 11: North America Athletic Shoe Industry Revenue (Million), by Distribution Channel 2025 & 2033
- Figure 12: North America Athletic Shoe Industry Volume (K Units), by Distribution Channel 2025 & 2033
- Figure 13: North America Athletic Shoe Industry Revenue Share (%), by Distribution Channel 2025 & 2033
- Figure 14: North America Athletic Shoe Industry Volume Share (%), by Distribution Channel 2025 & 2033
- Figure 15: North America Athletic Shoe Industry Revenue (Million), by Country 2025 & 2033
- Figure 16: North America Athletic Shoe Industry Volume (K Units), by Country 2025 & 2033
- Figure 17: North America Athletic Shoe Industry Revenue Share (%), by Country 2025 & 2033
- Figure 18: North America Athletic Shoe Industry Volume Share (%), by Country 2025 & 2033
- Figure 19: Europe Athletic Shoe Industry Revenue (Million), by Product Type 2025 & 2033
- Figure 20: Europe Athletic Shoe Industry Volume (K Units), by Product Type 2025 & 2033
- Figure 21: Europe Athletic Shoe Industry Revenue Share (%), by Product Type 2025 & 2033
- Figure 22: Europe Athletic Shoe Industry Volume Share (%), by Product Type 2025 & 2033
- Figure 23: Europe Athletic Shoe Industry Revenue (Million), by End User 2025 & 2033
- Figure 24: Europe Athletic Shoe Industry Volume (K Units), by End User 2025 & 2033
- Figure 25: Europe Athletic Shoe Industry Revenue Share (%), by End User 2025 & 2033
- Figure 26: Europe Athletic Shoe Industry Volume Share (%), by End User 2025 & 2033
- Figure 27: Europe Athletic Shoe Industry Revenue (Million), by Distribution Channel 2025 & 2033
- Figure 28: Europe Athletic Shoe Industry Volume (K Units), by Distribution Channel 2025 & 2033
- Figure 29: Europe Athletic Shoe Industry Revenue Share (%), by Distribution Channel 2025 & 2033
- Figure 30: Europe Athletic Shoe Industry Volume Share (%), by Distribution Channel 2025 & 2033
- Figure 31: Europe Athletic Shoe Industry Revenue (Million), by Country 2025 & 2033
- Figure 32: Europe Athletic Shoe Industry Volume (K Units), by Country 2025 & 2033
- Figure 33: Europe Athletic Shoe Industry Revenue Share (%), by Country 2025 & 2033
- Figure 34: Europe Athletic Shoe Industry Volume Share (%), by Country 2025 & 2033
- Figure 35: Asia Pacific Athletic Shoe Industry Revenue (Million), by Product Type 2025 & 2033
- Figure 36: Asia Pacific Athletic Shoe Industry Volume (K Units), by Product Type 2025 & 2033
- Figure 37: Asia Pacific Athletic Shoe Industry Revenue Share (%), by Product Type 2025 & 2033
- Figure 38: Asia Pacific Athletic Shoe Industry Volume Share (%), by Product Type 2025 & 2033
- Figure 39: Asia Pacific Athletic Shoe Industry Revenue (Million), by End User 2025 & 2033
- Figure 40: Asia Pacific Athletic Shoe Industry Volume (K Units), by End User 2025 & 2033
- Figure 41: Asia Pacific Athletic Shoe Industry Revenue Share (%), by End User 2025 & 2033
- Figure 42: Asia Pacific Athletic Shoe Industry Volume Share (%), by End User 2025 & 2033
- Figure 43: Asia Pacific Athletic Shoe Industry Revenue (Million), by Distribution Channel 2025 & 2033
- Figure 44: Asia Pacific Athletic Shoe Industry Volume (K Units), by Distribution Channel 2025 & 2033
- Figure 45: Asia Pacific Athletic Shoe Industry Revenue Share (%), by Distribution Channel 2025 & 2033
- Figure 46: Asia Pacific Athletic Shoe Industry Volume Share (%), by Distribution Channel 2025 & 2033
- Figure 47: Asia Pacific Athletic Shoe Industry Revenue (Million), by Country 2025 & 2033
- Figure 48: Asia Pacific Athletic Shoe Industry Volume (K Units), by Country 2025 & 2033
- Figure 49: Asia Pacific Athletic Shoe Industry Revenue Share (%), by Country 2025 & 2033
- Figure 50: Asia Pacific Athletic Shoe Industry Volume Share (%), by Country 2025 & 2033
- Figure 51: South America Athletic Shoe Industry Revenue (Million), by Product Type 2025 & 2033
- Figure 52: South America Athletic Shoe Industry Volume (K Units), by Product Type 2025 & 2033
- Figure 53: South America Athletic Shoe Industry Revenue Share (%), by Product Type 2025 & 2033
- Figure 54: South America Athletic Shoe Industry Volume Share (%), by Product Type 2025 & 2033
- Figure 55: South America Athletic Shoe Industry Revenue (Million), by End User 2025 & 2033
- Figure 56: South America Athletic Shoe Industry Volume (K Units), by End User 2025 & 2033
- Figure 57: South America Athletic Shoe Industry Revenue Share (%), by End User 2025 & 2033
- Figure 58: South America Athletic Shoe Industry Volume Share (%), by End User 2025 & 2033
- Figure 59: South America Athletic Shoe Industry Revenue (Million), by Distribution Channel 2025 & 2033
- Figure 60: South America Athletic Shoe Industry Volume (K Units), by Distribution Channel 2025 & 2033
- Figure 61: South America Athletic Shoe Industry Revenue Share (%), by Distribution Channel 2025 & 2033
- Figure 62: South America Athletic Shoe Industry Volume Share (%), by Distribution Channel 2025 & 2033
- Figure 63: South America Athletic Shoe Industry Revenue (Million), by Country 2025 & 2033
- Figure 64: South America Athletic Shoe Industry Volume (K Units), by Country 2025 & 2033
- Figure 65: South America Athletic Shoe Industry Revenue Share (%), by Country 2025 & 2033
- Figure 66: South America Athletic Shoe Industry Volume Share (%), by Country 2025 & 2033
- Figure 67: Middle East and Africa Athletic Shoe Industry Revenue (Million), by Product Type 2025 & 2033
- Figure 68: Middle East and Africa Athletic Shoe Industry Volume (K Units), by Product Type 2025 & 2033
- Figure 69: Middle East and Africa Athletic Shoe Industry Revenue Share (%), by Product Type 2025 & 2033
- Figure 70: Middle East and Africa Athletic Shoe Industry Volume Share (%), by Product Type 2025 & 2033
- Figure 71: Middle East and Africa Athletic Shoe Industry Revenue (Million), by End User 2025 & 2033
- Figure 72: Middle East and Africa Athletic Shoe Industry Volume (K Units), by End User 2025 & 2033
- Figure 73: Middle East and Africa Athletic Shoe Industry Revenue Share (%), by End User 2025 & 2033
- Figure 74: Middle East and Africa Athletic Shoe Industry Volume Share (%), by End User 2025 & 2033
- Figure 75: Middle East and Africa Athletic Shoe Industry Revenue (Million), by Distribution Channel 2025 & 2033
- Figure 76: Middle East and Africa Athletic Shoe Industry Volume (K Units), by Distribution Channel 2025 & 2033
- Figure 77: Middle East and Africa Athletic Shoe Industry Revenue Share (%), by Distribution Channel 2025 & 2033
- Figure 78: Middle East and Africa Athletic Shoe Industry Volume Share (%), by Distribution Channel 2025 & 2033
- Figure 79: Middle East and Africa Athletic Shoe Industry Revenue (Million), by Country 2025 & 2033
- Figure 80: Middle East and Africa Athletic Shoe Industry Volume (K Units), by Country 2025 & 2033
- Figure 81: Middle East and Africa Athletic Shoe Industry Revenue Share (%), by Country 2025 & 2033
- Figure 82: Middle East and Africa Athletic Shoe Industry Volume Share (%), by Country 2025 & 2033
List of Tables
- Table 1: Global Athletic Shoe Industry Revenue Million Forecast, by Product Type 2020 & 2033
- Table 2: Global Athletic Shoe Industry Volume K Units Forecast, by Product Type 2020 & 2033
- Table 3: Global Athletic Shoe Industry Revenue Million Forecast, by End User 2020 & 2033
- Table 4: Global Athletic Shoe Industry Volume K Units Forecast, by End User 2020 & 2033
- Table 5: Global Athletic Shoe Industry Revenue Million Forecast, by Distribution Channel 2020 & 2033
- Table 6: Global Athletic Shoe Industry Volume K Units Forecast, by Distribution Channel 2020 & 2033
- Table 7: Global Athletic Shoe Industry Revenue Million Forecast, by Region 2020 & 2033
- Table 8: Global Athletic Shoe Industry Volume K Units Forecast, by Region 2020 & 2033
- Table 9: Global Athletic Shoe Industry Revenue Million Forecast, by Product Type 2020 & 2033
- Table 10: Global Athletic Shoe Industry Volume K Units Forecast, by Product Type 2020 & 2033
- Table 11: Global Athletic Shoe Industry Revenue Million Forecast, by End User 2020 & 2033
- Table 12: Global Athletic Shoe Industry Volume K Units Forecast, by End User 2020 & 2033
- Table 13: Global Athletic Shoe Industry Revenue Million Forecast, by Distribution Channel 2020 & 2033
- Table 14: Global Athletic Shoe Industry Volume K Units Forecast, by Distribution Channel 2020 & 2033
- Table 15: Global Athletic Shoe Industry Revenue Million Forecast, by Country 2020 & 2033
- Table 16: Global Athletic Shoe Industry Volume K Units Forecast, by Country 2020 & 2033
- Table 17: United States Athletic Shoe Industry Revenue (Million) Forecast, by Application 2020 & 2033
- Table 18: United States Athletic Shoe Industry Volume (K Units) Forecast, by Application 2020 & 2033
- Table 19: Canada Athletic Shoe Industry Revenue (Million) Forecast, by Application 2020 & 2033
- Table 20: Canada Athletic Shoe Industry Volume (K Units) Forecast, by Application 2020 & 2033
- Table 21: Mexico Athletic Shoe Industry Revenue (Million) Forecast, by Application 2020 & 2033
- Table 22: Mexico Athletic Shoe Industry Volume (K Units) Forecast, by Application 2020 & 2033
- Table 23: Rest of North America Athletic Shoe Industry Revenue (Million) Forecast, by Application 2020 & 2033
- Table 24: Rest of North America Athletic Shoe Industry Volume (K Units) Forecast, by Application 2020 & 2033
- Table 25: Global Athletic Shoe Industry Revenue Million Forecast, by Product Type 2020 & 2033
- Table 26: Global Athletic Shoe Industry Volume K Units Forecast, by Product Type 2020 & 2033
- Table 27: Global Athletic Shoe Industry Revenue Million Forecast, by End User 2020 & 2033
- Table 28: Global Athletic Shoe Industry Volume K Units Forecast, by End User 2020 & 2033
- Table 29: Global Athletic Shoe Industry Revenue Million Forecast, by Distribution Channel 2020 & 2033
- Table 30: Global Athletic Shoe Industry Volume K Units Forecast, by Distribution Channel 2020 & 2033
- Table 31: Global Athletic Shoe Industry Revenue Million Forecast, by Country 2020 & 2033
- Table 32: Global Athletic Shoe Industry Volume K Units Forecast, by Country 2020 & 2033
- Table 33: United Kingdom Athletic Shoe Industry Revenue (Million) Forecast, by Application 2020 & 2033
- Table 34: United Kingdom Athletic Shoe Industry Volume (K Units) Forecast, by Application 2020 & 2033
- Table 35: Germany Athletic Shoe Industry Revenue (Million) Forecast, by Application 2020 & 2033
- Table 36: Germany Athletic Shoe Industry Volume (K Units) Forecast, by Application 2020 & 2033
- Table 37: Spain Athletic Shoe Industry Revenue (Million) Forecast, by Application 2020 & 2033
- Table 38: Spain Athletic Shoe Industry Volume (K Units) Forecast, by Application 2020 & 2033
- Table 39: France Athletic Shoe Industry Revenue (Million) Forecast, by Application 2020 & 2033
- Table 40: France Athletic Shoe Industry Volume (K Units) Forecast, by Application 2020 & 2033
- Table 41: Italy Athletic Shoe Industry Revenue (Million) Forecast, by Application 2020 & 2033
- Table 42: Italy Athletic Shoe Industry Volume (K Units) Forecast, by Application 2020 & 2033
- Table 43: Netherlands Athletic Shoe Industry Revenue (Million) Forecast, by Application 2020 & 2033
- Table 44: Netherlands Athletic Shoe Industry Volume (K Units) Forecast, by Application 2020 & 2033
- Table 45: Rest of Europe Athletic Shoe Industry Revenue (Million) Forecast, by Application 2020 & 2033
- Table 46: Rest of Europe Athletic Shoe Industry Volume (K Units) Forecast, by Application 2020 & 2033
- Table 47: Global Athletic Shoe Industry Revenue Million Forecast, by Product Type 2020 & 2033
- Table 48: Global Athletic Shoe Industry Volume K Units Forecast, by Product Type 2020 & 2033
- Table 49: Global Athletic Shoe Industry Revenue Million Forecast, by End User 2020 & 2033
- Table 50: Global Athletic Shoe Industry Volume K Units Forecast, by End User 2020 & 2033
- Table 51: Global Athletic Shoe Industry Revenue Million Forecast, by Distribution Channel 2020 & 2033
- Table 52: Global Athletic Shoe Industry Volume K Units Forecast, by Distribution Channel 2020 & 2033
- Table 53: Global Athletic Shoe Industry Revenue Million Forecast, by Country 2020 & 2033
- Table 54: Global Athletic Shoe Industry Volume K Units Forecast, by Country 2020 & 2033
- Table 55: China Athletic Shoe Industry Revenue (Million) Forecast, by Application 2020 & 2033
- Table 56: China Athletic Shoe Industry Volume (K Units) Forecast, by Application 2020 & 2033
- Table 57: Japan Athletic Shoe Industry Revenue (Million) Forecast, by Application 2020 & 2033
- Table 58: Japan Athletic Shoe Industry Volume (K Units) Forecast, by Application 2020 & 2033
- Table 59: India Athletic Shoe Industry Revenue (Million) Forecast, by Application 2020 & 2033
- Table 60: India Athletic Shoe Industry Volume (K Units) Forecast, by Application 2020 & 2033
- Table 61: Australia Athletic Shoe Industry Revenue (Million) Forecast, by Application 2020 & 2033
- Table 62: Australia Athletic Shoe Industry Volume (K Units) Forecast, by Application 2020 & 2033
- Table 63: Rest of Asia Pacific Athletic Shoe Industry Revenue (Million) Forecast, by Application 2020 & 2033
- Table 64: Rest of Asia Pacific Athletic Shoe Industry Volume (K Units) Forecast, by Application 2020 & 2033
- Table 65: Global Athletic Shoe Industry Revenue Million Forecast, by Product Type 2020 & 2033
- Table 66: Global Athletic Shoe Industry Volume K Units Forecast, by Product Type 2020 & 2033
- Table 67: Global Athletic Shoe Industry Revenue Million Forecast, by End User 2020 & 2033
- Table 68: Global Athletic Shoe Industry Volume K Units Forecast, by End User 2020 & 2033
- Table 69: Global Athletic Shoe Industry Revenue Million Forecast, by Distribution Channel 2020 & 2033
- Table 70: Global Athletic Shoe Industry Volume K Units Forecast, by Distribution Channel 2020 & 2033
- Table 71: Global Athletic Shoe Industry Revenue Million Forecast, by Country 2020 & 2033
- Table 72: Global Athletic Shoe Industry Volume K Units Forecast, by Country 2020 & 2033
- Table 73: Brazil Athletic Shoe Industry Revenue (Million) Forecast, by Application 2020 & 2033
- Table 74: Brazil Athletic Shoe Industry Volume (K Units) Forecast, by Application 2020 & 2033
- Table 75: Argentina Athletic Shoe Industry Revenue (Million) Forecast, by Application 2020 & 2033
- Table 76: Argentina Athletic Shoe Industry Volume (K Units) Forecast, by Application 2020 & 2033
- Table 77: Rest of South America Athletic Shoe Industry Revenue (Million) Forecast, by Application 2020 & 2033
- Table 78: Rest of South America Athletic Shoe Industry Volume (K Units) Forecast, by Application 2020 & 2033
- Table 79: Global Athletic Shoe Industry Revenue Million Forecast, by Product Type 2020 & 2033
- Table 80: Global Athletic Shoe Industry Volume K Units Forecast, by Product Type 2020 & 2033
- Table 81: Global Athletic Shoe Industry Revenue Million Forecast, by End User 2020 & 2033
- Table 82: Global Athletic Shoe Industry Volume K Units Forecast, by End User 2020 & 2033
- Table 83: Global Athletic Shoe Industry Revenue Million Forecast, by Distribution Channel 2020 & 2033
- Table 84: Global Athletic Shoe Industry Volume K Units Forecast, by Distribution Channel 2020 & 2033
- Table 85: Global Athletic Shoe Industry Revenue Million Forecast, by Country 2020 & 2033
- Table 86: Global Athletic Shoe Industry Volume K Units Forecast, by Country 2020 & 2033
- Table 87: Saudi Arabia Athletic Shoe Industry Revenue (Million) Forecast, by Application 2020 & 2033
- Table 88: Saudi Arabia Athletic Shoe Industry Volume (K Units) Forecast, by Application 2020 & 2033
- Table 89: South Africa Athletic Shoe Industry Revenue (Million) Forecast, by Application 2020 & 2033
- Table 90: South Africa Athletic Shoe Industry Volume (K Units) Forecast, by Application 2020 & 2033
- Table 91: Rest of Middle East and Africa Athletic Shoe Industry Revenue (Million) Forecast, by Application 2020 & 2033
- Table 92: Rest of Middle East and Africa Athletic Shoe Industry Volume (K Units) Forecast, by Application 2020 & 2033
Frequently Asked Questions
1. What is the projected Compound Annual Growth Rate (CAGR) of the Athletic Shoe Industry?
The projected CAGR is approximately 6.86%.
2. Which companies are prominent players in the Athletic Shoe Industry?
Key companies in the market include Adidas AG, Columbia Sportswear Company, VF Corporation, SKECHERS USA Inc, Asics Corporation, Puma SE, Under Armour Inc, Nike Inc, New Balance Athletics Inc, Fila.
3. What are the main segments of the Athletic Shoe Industry?
The market segments include Product Type, End User, Distribution Channel.
4. Can you provide details about the market size?
The market size is estimated to be USD 173.89 Million as of 2022.
5. What are some drivers contributing to market growth?
Aggressive Marketing And Strategies By Brands; Enhanced Participation In Recreational And Outdoor/Sports Activities.
6. What are the notable trends driving market growth?
Growing Sports Participation and Influence of Athleisure.
7. Are there any restraints impacting market growth?
Unorganized Footwear Sector And Availability Of Counterfeit Goods.
8. Can you provide examples of recent developments in the market?
June 2024: Nike launched the Converse Run Star Trainer, a low-profile shoe built from the ground up, combining retro and modern aesthetics. The silhouette is inspired by Converse’s deep history in sport but designed for modern life.
9. What pricing options are available for accessing the report?
Pricing options include single-user, multi-user, and enterprise licenses priced at USD 4750, USD 5250, and USD 8750 respectively.
10. Is the market size provided in terms of value or volume?
The market size is provided in terms of value, measured in Million and volume, measured in K Units.
11. Are there any specific market keywords associated with the report?
Yes, the market keyword associated with the report is "Athletic Shoe Industry," which aids in identifying and referencing the specific market segment covered.
12. How do I determine which pricing option suits my needs best?
The pricing options vary based on user requirements and access needs. Individual users may opt for single-user licenses, while businesses requiring broader access may choose multi-user or enterprise licenses for cost-effective access to the report.
13. Are there any additional resources or data provided in the Athletic Shoe Industry report?
While the report offers comprehensive insights, it's advisable to review the specific contents or supplementary materials provided to ascertain if additional resources or data are available.
14. How can I stay updated on further developments or reports in the Athletic Shoe Industry?
To stay informed about further developments, trends, and reports in the Athletic Shoe Industry, consider subscribing to industry newsletters, following relevant companies and organizations, or regularly checking reputable industry news sources and publications.
Methodology
Step 1 - Identification of Relevant Samples Size from Population Database


Step 2 - Approaches for Defining Global Market Size (Value, Volume* & Price*)

Note*: In applicable scenarios
Step 3 - Data Sources
Primary Research
- Web Analytics
- Survey Reports
- Research Institute
- Latest Research Reports
- Opinion Leaders
Secondary Research
- Annual Reports
- White Paper
- Latest Press Release
- Industry Association
- Paid Database
- Investor Presentations

Step 4 - Data Triangulation
Involves using different sources of information in order to increase the validity of a study
These sources are likely to be stakeholders in a program - participants, other researchers, program staff, other community members, and so on.
Then we put all data in single framework & apply various statistical tools to find out the dynamic on the market.
During the analysis stage, feedback from the stakeholder groups would be compared to determine areas of agreement as well as areas of divergence