

Key Insights
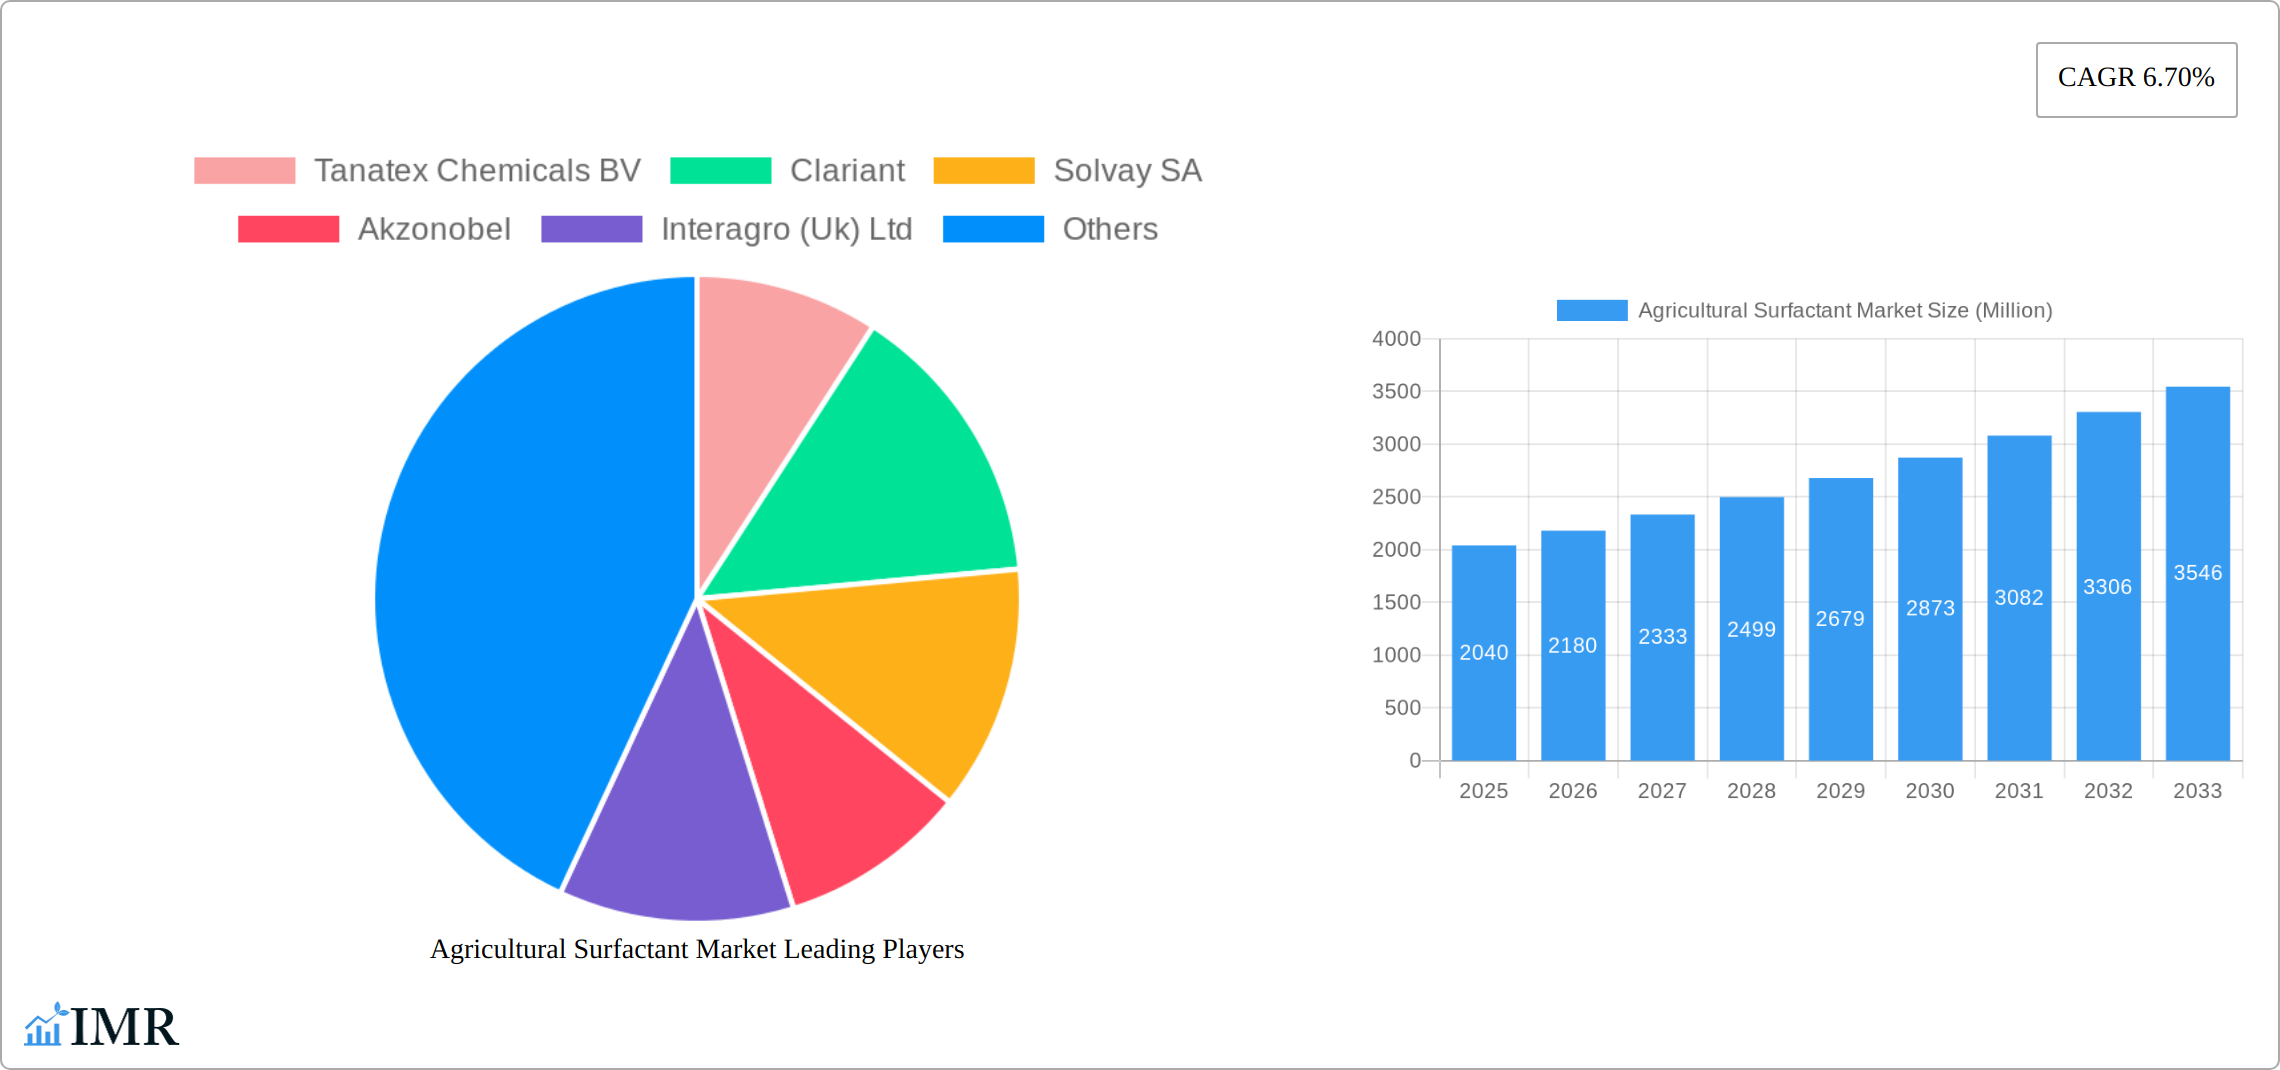
The global agricultural surfactant market, valued at $2.04 billion in 2025, is projected to experience robust growth, exhibiting a Compound Annual Growth Rate (CAGR) of 6.70% from 2025 to 2033. This expansion is driven by several key factors. The increasing demand for high-yield agriculture, coupled with the growing adoption of precision farming techniques, necessitates the use of surfactants to enhance the efficacy of pesticides and fertilizers. Furthermore, the rising global population and the consequent need for increased food production are bolstering market growth. The shift towards sustainable agricultural practices, including the growing preference for bio-based surfactants, presents a significant opportunity for market players. Specific growth drivers include the rising adoption of crop protection products, increased demand for improved crop yields, and the burgeoning use of adjuvants to optimize pesticide and fertilizer application. However, market growth faces certain restraints, including stringent regulations on the use of certain surfactant types and concerns regarding potential environmental impacts. Despite these challenges, the market's inherent growth potential is undeniable, fueled by continuous innovation in surfactant technology and increasing awareness of its benefits among farmers.
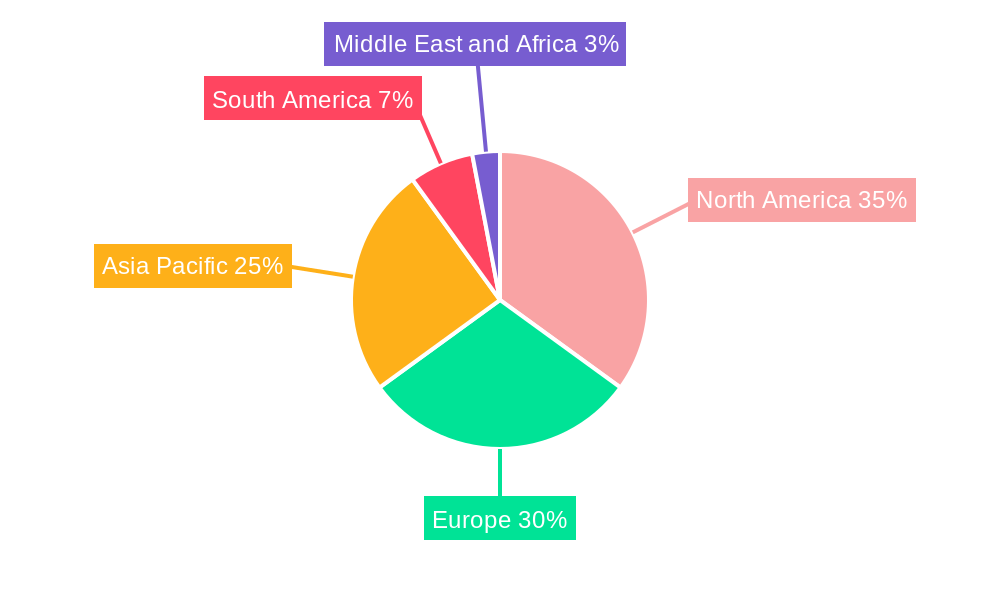
The market segmentation reveals significant opportunities across various categories. The fruits and vegetables segment, especially non-crop-based applications, is expected to show strong growth due to increasing demand for high-quality produce. Among surfactant types, the anionic and nonionic segments dominate, while amphoteric and cationic surfactants are witnessing increased adoption due to their enhanced performance characteristics in specific applications. Geographically, North America and Europe are currently leading the market, driven by high agricultural productivity and stringent regulatory frameworks. However, the Asia-Pacific region, particularly India and China, is poised for substantial growth due to expanding agricultural land and increasing investments in agricultural technologies. Major players in the market, including Tanatex Chemicals BV, Clariant, Solvay SA, and BASF SE, are continuously investing in research and development to enhance product performance and expand their market share through strategic partnerships and acquisitions. The forecast period (2025-2033) is expected to witness intensified competition and further market consolidation.
Agricultural Surfactant Market: A Comprehensive Report (2019-2033)
This comprehensive report provides an in-depth analysis of the Agricultural Surfactant Market, encompassing market dynamics, growth trends, regional dominance, product landscape, key players, and future outlook. The study period covers 2019-2033, with 2025 as the base and estimated year. The report utilizes a robust methodology, incorporating both quantitative and qualitative data to deliver actionable insights for industry professionals. The market is segmented by type (Anionic, Nonionic, Cationic, Amphoteric), application (Insecticide, Herbicide, Fungicide, Other Applications), substrate (Synthetic, Bio-based), and crop application (Crop-based, Non-crop-based – Fruits and Vegetables). The market size is valued in Million units.
Agricultural Surfactant Market Dynamics & Structure
The Agricultural Surfactant Market is characterized by a moderately consolidated structure, with key players such as BASF SE, Clariant, and Solvay SA holding significant market share. Technological innovation, driven by the need for enhanced efficacy and sustainability, is a major driver. Stringent regulatory frameworks concerning pesticide use and environmental impact significantly influence market dynamics. The market faces competition from alternative formulations and practices, while mergers and acquisitions (M&A) activity contribute to market consolidation. The increasing demand for sustainable agricultural practices fuels growth in bio-based surfactants.
- Market Concentration: The top 5 players account for approximately xx% of the global market share in 2025.
- Technological Innovation: Focus on bio-based and biodegradable surfactants, improved efficacy, and reduced environmental impact drive innovation.
- Regulatory Landscape: Stringent regulations concerning pesticide residues and environmental protection shape market trends and product development.
- Competitive Substitutes: Alternative methods of crop protection, such as biological controls, pose some level of competitive pressure.
- M&A Activity: Consolidation through acquisitions and partnerships is expected to continue, shaping the market landscape. Between 2019 and 2024, approximately xx M&A deals were recorded in this sector.
Agricultural Surfactant Market Growth Trends & Insights
The Agricultural Surfactant Market is poised for robust expansion throughout the forecast period (2025-2033). While precise figures for market size and CAGR require further specification (replace "xx Million units" and "xx%"), the market's trajectory is undeniably upward. This growth is fueled by a confluence of factors: the escalating global demand for food, the widespread adoption of advanced farming technologies, and the increasing preference for high-yield, efficient agricultural practices. A critical driver is the burgeoning shift towards sustainable agriculture, coupled with intensifying regulatory pressures to minimize the environmental footprint of pesticides. This necessitates a transition towards bio-based surfactants. Simultaneously, technological advancements, such as the development of novel surfactant formulations with enhanced properties (e.g., improved efficacy, reduced environmental impact, and increased compatibility), are significantly contributing to market expansion. Furthermore, the rising consumer preference for pesticide-free or low-pesticide produce is acting as a powerful catalyst for market growth.
Dominant Regions, Countries, or Segments in Agricultural Surfactant Market
North America and Europe currently hold the leading positions in the Agricultural Surfactant Market, driven by their established agricultural sectors, advanced farming practices, and robust regulatory frameworks. However, the Asia-Pacific region is projected to experience the most substantial growth in the coming years, fueled by its rapidly expanding agricultural activities and the surging demand for high-yielding crops. Analyzing market segments, nonionic surfactants command the largest market share due to their exceptional versatility, cost-effectiveness, and broad compatibility with diverse pesticide formulations. The insecticide application segment is a key driver of market growth, with significant demand stemming from both crop-based and non-crop-based agricultural production. The increasing awareness of environmental sustainability is further propelling the adoption of bio-based surfactants, which are gaining significant traction within the market.
- Key Drivers in North America: A mature agricultural sector, high adoption rates of modern farming technologies, and stringent environmental regulations promoting sustainable solutions are key drivers.
- Key Drivers in Europe: Similar to North America, with a strong emphasis on sustainable agriculture and strict adherence to regulatory compliance.
- Key Drivers in Asia-Pacific: Rapid expansion of the agricultural sector, escalating food demand, and government initiatives actively supporting agricultural modernization are primary growth drivers.
- Dominant Segment: Nonionic Surfactants: The dominance of nonionic surfactants stems from their high versatility, cost-effectiveness, and excellent compatibility with a wide range of formulations.
- Dominant Application: Insecticides: The high demand for efficient insect control solutions is a major driver for the application of surfactants in insecticide formulations.
Agricultural Surfactant Market Product Landscape
The agricultural surfactant market showcases continuous product innovation, focusing on enhancing efficacy, biodegradability, and compatibility with various pesticides. New formulations offer improved wetting, spreading, and penetration properties, leading to enhanced pesticide performance and reduced application rates. The market is witnessing a strong shift towards bio-based surfactants derived from renewable sources, addressing sustainability concerns. Unique selling propositions include improved crop protection, reduced environmental footprint, and enhanced cost-effectiveness.
Key Drivers, Barriers & Challenges in Agricultural Surfactant Market
Key Drivers: Rising global food demand, increasing adoption of precision agriculture, government support for sustainable agricultural practices, and the growing need for effective and environmentally friendly pest control solutions.
Key Challenges: Fluctuations in raw material prices, stringent regulatory compliance requirements, potential environmental concerns related to some surfactant types, and competitive pressures from alternative crop protection methods. The estimated impact of supply chain disruptions on market growth in 2024 was approximately xx%.
Emerging Opportunities in Agricultural Surfactant Market
Significant emerging opportunities exist in several key areas: the development and adoption of bio-based and biodegradable surfactants, expansion into untapped markets in developing economies, and the exploration of novel applications, such as enhancing nutrient uptake efficiency in crops. The rising demand for organic and sustainable farming practices presents considerable growth potential for environmentally friendly surfactant formulations. Furthermore, ongoing research into advanced targeted delivery systems holds the promise of substantially improving pesticide efficacy while simultaneously minimizing potential environmental impacts.
Growth Accelerators in the Agricultural Surfactant Market Industry
Technological breakthroughs in surfactant formulation, strategic collaborations and partnerships among manufacturers, and the expansion into emerging markets are key growth accelerators. Focus on developing high-performance, cost-effective, and environmentally sound products will drive long-term growth. Strategic acquisitions and investments in research and development will play a crucial role in fostering innovation and market expansion.
Key Players Shaping the Agricultural Surfactant Market Market
- Tanatex Chemicals BV
- Clariant
- Solvay SA
- Akzonobel
- Interagro (Uk) Ltd
- Brandt Consolidated Inc
- Garrco Products Inc
- Lamberti SPA
- Kao Corporation
- Helena Chemical Company
- Air Products and Chemicals
- Nufarm Limited
- Wilbur-Ellis Company
- Huntsman
- Corteva Agriscience
- Croda International PLC
- Evonik Industries
- BASF SE
Notable Milestones in Agricultural Surfactant Market Sector
- March 2022: Dow Chemical Company announced a new product extension of its VORASURF™ Silicone Surfactants line, emphasizing its commitment to sustainable solutions.
- September 2021: BASF SE increased prices for non-ionic surfactants in response to heightened market demand.
- March 2021: BASF SE forged strategic partnerships to bolster its market position in bio-based surfactants.
- [Add more recent milestones here – Include specifics like company names, product launches, mergers & acquisitions, regulatory changes, or significant market research publications. Be sure to cite your sources.]
In-Depth Agricultural Surfactant Market Market Outlook
The Agricultural Surfactant Market presents significant growth potential, driven by technological advancements, increasing sustainability concerns, and rising global food demands. Strategic partnerships, expansion into emerging markets, and the development of innovative, eco-friendly formulations will be key to unlocking long-term growth opportunities. The market is poised for continued expansion, offering significant opportunities for both established players and new entrants.
Agricultural Surfactant Market Segmentation
- 1. Production Analysis
- 2. Consumption Analysis
- 3. Import Market Analysis (Value & Volume)
- 4. Export Market Analysis (Value & Volume)
- 5. Price Trend Analysis
Agricultural Surfactant Market Segmentation By Geography
-
1. North America
- 1.1. United States
- 1.2. Canada
- 1.3. Mexico
-
2. South America
- 2.1. Brazil
- 2.2. Argentina
- 2.3. Rest of South America
-
3. Europe
- 3.1. United Kingdom
- 3.2. Germany
- 3.3. France
- 3.4. Italy
- 3.5. Spain
- 3.6. Russia
- 3.7. Benelux
- 3.8. Nordics
- 3.9. Rest of Europe
-
4. Middle East & Africa
- 4.1. Turkey
- 4.2. Israel
- 4.3. GCC
- 4.4. North Africa
- 4.5. South Africa
- 4.6. Rest of Middle East & Africa
-
5. Asia Pacific
- 5.1. China
- 5.2. India
- 5.3. Japan
- 5.4. South Korea
- 5.5. ASEAN
- 5.6. Oceania
- 5.7. Rest of Asia Pacific
Agricultural Surfactant Market REPORT HIGHLIGHTS
| Aspects | Details |
|---|---|
| Study Period | 2019-2033 |
| Base Year | 2024 |
| Estimated Year | 2025 |
| Forecast Period | 2025-2033 |
| Historical Period | 2019-2024 |
| Growth Rate | CAGR of 6.70% from 2019-2033 |
| Segmentation |
|
Table of Contents
- 1. Introduction
- 1.1. Research Scope
- 1.2. Market Segmentation
- 1.3. Research Methodology
- 1.4. Definitions and Assumptions
- 2. Executive Summary
- 2.1. Introduction
- 3. Market Dynamics
- 3.1. Introduction
- 3.2. Market Drivers
- 3.2.1. Shortage of Skilled Labor; Government Support to Enhance Farm Mechanization
- 3.3. Market Restrains
- 3.3.1. Heavy Initial Procurement Cost and High Expenditure on Maintenance
- 3.4. Market Trends
- 3.4.1. Rising Demand for Food and Shrinking Land Driving the Market
- 4. Market Factor Analysis
- 4.1. Porters Five Forces
- 4.2. Supply/Value Chain
- 4.3. PESTEL analysis
- 4.4. Market Entropy
- 4.5. Patent/Trademark Analysis
- 5. Global Agricultural Surfactant Market Analysis, Insights and Forecast, 2019-2031
- 5.1. Market Analysis, Insights and Forecast - by Production Analysis
- 5.2. Market Analysis, Insights and Forecast - by Consumption Analysis
- 5.3. Market Analysis, Insights and Forecast - by Import Market Analysis (Value & Volume)
- 5.4. Market Analysis, Insights and Forecast - by Export Market Analysis (Value & Volume)
- 5.5. Market Analysis, Insights and Forecast - by Price Trend Analysis
- 5.6. Market Analysis, Insights and Forecast - by Region
- 5.6.1. North America
- 5.6.2. South America
- 5.6.3. Europe
- 5.6.4. Middle East & Africa
- 5.6.5. Asia Pacific
- 5.1. Market Analysis, Insights and Forecast - by Production Analysis
- 6. North America Agricultural Surfactant Market Analysis, Insights and Forecast, 2019-2031
- 6.1. Market Analysis, Insights and Forecast - by Production Analysis
- 6.2. Market Analysis, Insights and Forecast - by Consumption Analysis
- 6.3. Market Analysis, Insights and Forecast - by Import Market Analysis (Value & Volume)
- 6.4. Market Analysis, Insights and Forecast - by Export Market Analysis (Value & Volume)
- 6.5. Market Analysis, Insights and Forecast - by Price Trend Analysis
- 6.1. Market Analysis, Insights and Forecast - by Production Analysis
- 7. South America Agricultural Surfactant Market Analysis, Insights and Forecast, 2019-2031
- 7.1. Market Analysis, Insights and Forecast - by Production Analysis
- 7.2. Market Analysis, Insights and Forecast - by Consumption Analysis
- 7.3. Market Analysis, Insights and Forecast - by Import Market Analysis (Value & Volume)
- 7.4. Market Analysis, Insights and Forecast - by Export Market Analysis (Value & Volume)
- 7.5. Market Analysis, Insights and Forecast - by Price Trend Analysis
- 7.1. Market Analysis, Insights and Forecast - by Production Analysis
- 8. Europe Agricultural Surfactant Market Analysis, Insights and Forecast, 2019-2031
- 8.1. Market Analysis, Insights and Forecast - by Production Analysis
- 8.2. Market Analysis, Insights and Forecast - by Consumption Analysis
- 8.3. Market Analysis, Insights and Forecast - by Import Market Analysis (Value & Volume)
- 8.4. Market Analysis, Insights and Forecast - by Export Market Analysis (Value & Volume)
- 8.5. Market Analysis, Insights and Forecast - by Price Trend Analysis
- 8.1. Market Analysis, Insights and Forecast - by Production Analysis
- 9. Middle East & Africa Agricultural Surfactant Market Analysis, Insights and Forecast, 2019-2031
- 9.1. Market Analysis, Insights and Forecast - by Production Analysis
- 9.2. Market Analysis, Insights and Forecast - by Consumption Analysis
- 9.3. Market Analysis, Insights and Forecast - by Import Market Analysis (Value & Volume)
- 9.4. Market Analysis, Insights and Forecast - by Export Market Analysis (Value & Volume)
- 9.5. Market Analysis, Insights and Forecast - by Price Trend Analysis
- 9.1. Market Analysis, Insights and Forecast - by Production Analysis
- 10. Asia Pacific Agricultural Surfactant Market Analysis, Insights and Forecast, 2019-2031
- 10.1. Market Analysis, Insights and Forecast - by Production Analysis
- 10.2. Market Analysis, Insights and Forecast - by Consumption Analysis
- 10.3. Market Analysis, Insights and Forecast - by Import Market Analysis (Value & Volume)
- 10.4. Market Analysis, Insights and Forecast - by Export Market Analysis (Value & Volume)
- 10.5. Market Analysis, Insights and Forecast - by Price Trend Analysis
- 10.1. Market Analysis, Insights and Forecast - by Production Analysis
- 11. North America Agricultural Surfactant Market Analysis, Insights and Forecast, 2019-2031
- 11.1. Market Analysis, Insights and Forecast - By Country/Sub-region
- 11.1.1 United States
- 11.1.2 Canada
- 11.1.3 Mexico
- 11.1.4 Rest of North America
- 12. Europe Agricultural Surfactant Market Analysis, Insights and Forecast, 2019-2031
- 12.1. Market Analysis, Insights and Forecast - By Country/Sub-region
- 12.1.1 Germany
- 12.1.2 United Kingdom
- 12.1.3 France
- 12.1.4 Spain
- 12.1.5 Italy
- 12.1.6 Russia
- 12.1.7 Rest of Europe
- 13. Asia Pacific Agricultural Surfactant Market Analysis, Insights and Forecast, 2019-2031
- 13.1. Market Analysis, Insights and Forecast - By Country/Sub-region
- 13.1.1 China
- 13.1.2 Japan
- 13.1.3 India
- 13.1.4 Australia
- 13.1.5 Rest of Asia Pacific
- 14. South America Agricultural Surfactant Market Analysis, Insights and Forecast, 2019-2031
- 14.1. Market Analysis, Insights and Forecast - By Country/Sub-region
- 14.1.1 Brazil
- 14.1.2 Argentina
- 14.1.3 Rest of South America
- 15. Middle East and Africa Agricultural Surfactant Market Analysis, Insights and Forecast, 2019-2031
- 15.1. Market Analysis, Insights and Forecast - By Country/Sub-region
- 15.1.1 South Africa
- 15.1.2 Rest of Middle East and Africa
- 16. Competitive Analysis
- 16.1. Global Market Share Analysis 2024
- 16.2. Company Profiles
- 16.2.1 Tanatex Chemicals BV
- 16.2.1.1. Overview
- 16.2.1.2. Products
- 16.2.1.3. SWOT Analysis
- 16.2.1.4. Recent Developments
- 16.2.1.5. Financials (Based on Availability)
- 16.2.2 Clariant
- 16.2.2.1. Overview
- 16.2.2.2. Products
- 16.2.2.3. SWOT Analysis
- 16.2.2.4. Recent Developments
- 16.2.2.5. Financials (Based on Availability)
- 16.2.3 Solvay SA
- 16.2.3.1. Overview
- 16.2.3.2. Products
- 16.2.3.3. SWOT Analysis
- 16.2.3.4. Recent Developments
- 16.2.3.5. Financials (Based on Availability)
- 16.2.4 Akzonobel
- 16.2.4.1. Overview
- 16.2.4.2. Products
- 16.2.4.3. SWOT Analysis
- 16.2.4.4. Recent Developments
- 16.2.4.5. Financials (Based on Availability)
- 16.2.5 Interagro (Uk) Ltd
- 16.2.5.1. Overview
- 16.2.5.2. Products
- 16.2.5.3. SWOT Analysis
- 16.2.5.4. Recent Developments
- 16.2.5.5. Financials (Based on Availability)
- 16.2.6 Brandt Consolidated Inc
- 16.2.6.1. Overview
- 16.2.6.2. Products
- 16.2.6.3. SWOT Analysis
- 16.2.6.4. Recent Developments
- 16.2.6.5. Financials (Based on Availability)
- 16.2.7 Garrco Products Inc
- 16.2.7.1. Overview
- 16.2.7.2. Products
- 16.2.7.3. SWOT Analysis
- 16.2.7.4. Recent Developments
- 16.2.7.5. Financials (Based on Availability)
- 16.2.8 Lamberti SPA
- 16.2.8.1. Overview
- 16.2.8.2. Products
- 16.2.8.3. SWOT Analysis
- 16.2.8.4. Recent Developments
- 16.2.8.5. Financials (Based on Availability)
- 16.2.9 Kao Corporation
- 16.2.9.1. Overview
- 16.2.9.2. Products
- 16.2.9.3. SWOT Analysis
- 16.2.9.4. Recent Developments
- 16.2.9.5. Financials (Based on Availability)
- 16.2.10 Helena Chemical Company
- 16.2.10.1. Overview
- 16.2.10.2. Products
- 16.2.10.3. SWOT Analysis
- 16.2.10.4. Recent Developments
- 16.2.10.5. Financials (Based on Availability)
- 16.2.11 Air Products and Chemicals
- 16.2.11.1. Overview
- 16.2.11.2. Products
- 16.2.11.3. SWOT Analysis
- 16.2.11.4. Recent Developments
- 16.2.11.5. Financials (Based on Availability)
- 16.2.12 Nufarm Limited
- 16.2.12.1. Overview
- 16.2.12.2. Products
- 16.2.12.3. SWOT Analysis
- 16.2.12.4. Recent Developments
- 16.2.12.5. Financials (Based on Availability)
- 16.2.13 Wilbur-Ellis Company
- 16.2.13.1. Overview
- 16.2.13.2. Products
- 16.2.13.3. SWOT Analysis
- 16.2.13.4. Recent Developments
- 16.2.13.5. Financials (Based on Availability)
- 16.2.14 Huntsman
- 16.2.14.1. Overview
- 16.2.14.2. Products
- 16.2.14.3. SWOT Analysis
- 16.2.14.4. Recent Developments
- 16.2.14.5. Financials (Based on Availability)
- 16.2.15 Corteva Agriscience
- 16.2.15.1. Overview
- 16.2.15.2. Products
- 16.2.15.3. SWOT Analysis
- 16.2.15.4. Recent Developments
- 16.2.15.5. Financials (Based on Availability)
- 16.2.16 Croda International PLC
- 16.2.16.1. Overview
- 16.2.16.2. Products
- 16.2.16.3. SWOT Analysis
- 16.2.16.4. Recent Developments
- 16.2.16.5. Financials (Based on Availability)
- 16.2.17 Evonik Industries
- 16.2.17.1. Overview
- 16.2.17.2. Products
- 16.2.17.3. SWOT Analysis
- 16.2.17.4. Recent Developments
- 16.2.17.5. Financials (Based on Availability)
- 16.2.18 BASF SE
- 16.2.18.1. Overview
- 16.2.18.2. Products
- 16.2.18.3. SWOT Analysis
- 16.2.18.4. Recent Developments
- 16.2.18.5. Financials (Based on Availability)
- 16.2.1 Tanatex Chemicals BV
List of Figures
- Figure 1: Global Agricultural Surfactant Market Revenue Breakdown (Million, %) by Region 2024 & 2032
- Figure 2: North America Agricultural Surfactant Market Revenue (Million), by Country 2024 & 2032
- Figure 3: North America Agricultural Surfactant Market Revenue Share (%), by Country 2024 & 2032
- Figure 4: Europe Agricultural Surfactant Market Revenue (Million), by Country 2024 & 2032
- Figure 5: Europe Agricultural Surfactant Market Revenue Share (%), by Country 2024 & 2032
- Figure 6: Asia Pacific Agricultural Surfactant Market Revenue (Million), by Country 2024 & 2032
- Figure 7: Asia Pacific Agricultural Surfactant Market Revenue Share (%), by Country 2024 & 2032
- Figure 8: South America Agricultural Surfactant Market Revenue (Million), by Country 2024 & 2032
- Figure 9: South America Agricultural Surfactant Market Revenue Share (%), by Country 2024 & 2032
- Figure 10: Middle East and Africa Agricultural Surfactant Market Revenue (Million), by Country 2024 & 2032
- Figure 11: Middle East and Africa Agricultural Surfactant Market Revenue Share (%), by Country 2024 & 2032
- Figure 12: North America Agricultural Surfactant Market Revenue (Million), by Production Analysis 2024 & 2032
- Figure 13: North America Agricultural Surfactant Market Revenue Share (%), by Production Analysis 2024 & 2032
- Figure 14: North America Agricultural Surfactant Market Revenue (Million), by Consumption Analysis 2024 & 2032
- Figure 15: North America Agricultural Surfactant Market Revenue Share (%), by Consumption Analysis 2024 & 2032
- Figure 16: North America Agricultural Surfactant Market Revenue (Million), by Import Market Analysis (Value & Volume) 2024 & 2032
- Figure 17: North America Agricultural Surfactant Market Revenue Share (%), by Import Market Analysis (Value & Volume) 2024 & 2032
- Figure 18: North America Agricultural Surfactant Market Revenue (Million), by Export Market Analysis (Value & Volume) 2024 & 2032
- Figure 19: North America Agricultural Surfactant Market Revenue Share (%), by Export Market Analysis (Value & Volume) 2024 & 2032
- Figure 20: North America Agricultural Surfactant Market Revenue (Million), by Price Trend Analysis 2024 & 2032
- Figure 21: North America Agricultural Surfactant Market Revenue Share (%), by Price Trend Analysis 2024 & 2032
- Figure 22: North America Agricultural Surfactant Market Revenue (Million), by Country 2024 & 2032
- Figure 23: North America Agricultural Surfactant Market Revenue Share (%), by Country 2024 & 2032
- Figure 24: South America Agricultural Surfactant Market Revenue (Million), by Production Analysis 2024 & 2032
- Figure 25: South America Agricultural Surfactant Market Revenue Share (%), by Production Analysis 2024 & 2032
- Figure 26: South America Agricultural Surfactant Market Revenue (Million), by Consumption Analysis 2024 & 2032
- Figure 27: South America Agricultural Surfactant Market Revenue Share (%), by Consumption Analysis 2024 & 2032
- Figure 28: South America Agricultural Surfactant Market Revenue (Million), by Import Market Analysis (Value & Volume) 2024 & 2032
- Figure 29: South America Agricultural Surfactant Market Revenue Share (%), by Import Market Analysis (Value & Volume) 2024 & 2032
- Figure 30: South America Agricultural Surfactant Market Revenue (Million), by Export Market Analysis (Value & Volume) 2024 & 2032
- Figure 31: South America Agricultural Surfactant Market Revenue Share (%), by Export Market Analysis (Value & Volume) 2024 & 2032
- Figure 32: South America Agricultural Surfactant Market Revenue (Million), by Price Trend Analysis 2024 & 2032
- Figure 33: South America Agricultural Surfactant Market Revenue Share (%), by Price Trend Analysis 2024 & 2032
- Figure 34: South America Agricultural Surfactant Market Revenue (Million), by Country 2024 & 2032
- Figure 35: South America Agricultural Surfactant Market Revenue Share (%), by Country 2024 & 2032
- Figure 36: Europe Agricultural Surfactant Market Revenue (Million), by Production Analysis 2024 & 2032
- Figure 37: Europe Agricultural Surfactant Market Revenue Share (%), by Production Analysis 2024 & 2032
- Figure 38: Europe Agricultural Surfactant Market Revenue (Million), by Consumption Analysis 2024 & 2032
- Figure 39: Europe Agricultural Surfactant Market Revenue Share (%), by Consumption Analysis 2024 & 2032
- Figure 40: Europe Agricultural Surfactant Market Revenue (Million), by Import Market Analysis (Value & Volume) 2024 & 2032
- Figure 41: Europe Agricultural Surfactant Market Revenue Share (%), by Import Market Analysis (Value & Volume) 2024 & 2032
- Figure 42: Europe Agricultural Surfactant Market Revenue (Million), by Export Market Analysis (Value & Volume) 2024 & 2032
- Figure 43: Europe Agricultural Surfactant Market Revenue Share (%), by Export Market Analysis (Value & Volume) 2024 & 2032
- Figure 44: Europe Agricultural Surfactant Market Revenue (Million), by Price Trend Analysis 2024 & 2032
- Figure 45: Europe Agricultural Surfactant Market Revenue Share (%), by Price Trend Analysis 2024 & 2032
- Figure 46: Europe Agricultural Surfactant Market Revenue (Million), by Country 2024 & 2032
- Figure 47: Europe Agricultural Surfactant Market Revenue Share (%), by Country 2024 & 2032
- Figure 48: Middle East & Africa Agricultural Surfactant Market Revenue (Million), by Production Analysis 2024 & 2032
- Figure 49: Middle East & Africa Agricultural Surfactant Market Revenue Share (%), by Production Analysis 2024 & 2032
- Figure 50: Middle East & Africa Agricultural Surfactant Market Revenue (Million), by Consumption Analysis 2024 & 2032
- Figure 51: Middle East & Africa Agricultural Surfactant Market Revenue Share (%), by Consumption Analysis 2024 & 2032
- Figure 52: Middle East & Africa Agricultural Surfactant Market Revenue (Million), by Import Market Analysis (Value & Volume) 2024 & 2032
- Figure 53: Middle East & Africa Agricultural Surfactant Market Revenue Share (%), by Import Market Analysis (Value & Volume) 2024 & 2032
- Figure 54: Middle East & Africa Agricultural Surfactant Market Revenue (Million), by Export Market Analysis (Value & Volume) 2024 & 2032
- Figure 55: Middle East & Africa Agricultural Surfactant Market Revenue Share (%), by Export Market Analysis (Value & Volume) 2024 & 2032
- Figure 56: Middle East & Africa Agricultural Surfactant Market Revenue (Million), by Price Trend Analysis 2024 & 2032
- Figure 57: Middle East & Africa Agricultural Surfactant Market Revenue Share (%), by Price Trend Analysis 2024 & 2032
- Figure 58: Middle East & Africa Agricultural Surfactant Market Revenue (Million), by Country 2024 & 2032
- Figure 59: Middle East & Africa Agricultural Surfactant Market Revenue Share (%), by Country 2024 & 2032
- Figure 60: Asia Pacific Agricultural Surfactant Market Revenue (Million), by Production Analysis 2024 & 2032
- Figure 61: Asia Pacific Agricultural Surfactant Market Revenue Share (%), by Production Analysis 2024 & 2032
- Figure 62: Asia Pacific Agricultural Surfactant Market Revenue (Million), by Consumption Analysis 2024 & 2032
- Figure 63: Asia Pacific Agricultural Surfactant Market Revenue Share (%), by Consumption Analysis 2024 & 2032
- Figure 64: Asia Pacific Agricultural Surfactant Market Revenue (Million), by Import Market Analysis (Value & Volume) 2024 & 2032
- Figure 65: Asia Pacific Agricultural Surfactant Market Revenue Share (%), by Import Market Analysis (Value & Volume) 2024 & 2032
- Figure 66: Asia Pacific Agricultural Surfactant Market Revenue (Million), by Export Market Analysis (Value & Volume) 2024 & 2032
- Figure 67: Asia Pacific Agricultural Surfactant Market Revenue Share (%), by Export Market Analysis (Value & Volume) 2024 & 2032
- Figure 68: Asia Pacific Agricultural Surfactant Market Revenue (Million), by Price Trend Analysis 2024 & 2032
- Figure 69: Asia Pacific Agricultural Surfactant Market Revenue Share (%), by Price Trend Analysis 2024 & 2032
- Figure 70: Asia Pacific Agricultural Surfactant Market Revenue (Million), by Country 2024 & 2032
- Figure 71: Asia Pacific Agricultural Surfactant Market Revenue Share (%), by Country 2024 & 2032
List of Tables
- Table 1: Global Agricultural Surfactant Market Revenue Million Forecast, by Region 2019 & 2032
- Table 2: Global Agricultural Surfactant Market Revenue Million Forecast, by Production Analysis 2019 & 2032
- Table 3: Global Agricultural Surfactant Market Revenue Million Forecast, by Consumption Analysis 2019 & 2032
- Table 4: Global Agricultural Surfactant Market Revenue Million Forecast, by Import Market Analysis (Value & Volume) 2019 & 2032
- Table 5: Global Agricultural Surfactant Market Revenue Million Forecast, by Export Market Analysis (Value & Volume) 2019 & 2032
- Table 6: Global Agricultural Surfactant Market Revenue Million Forecast, by Price Trend Analysis 2019 & 2032
- Table 7: Global Agricultural Surfactant Market Revenue Million Forecast, by Region 2019 & 2032
- Table 8: Global Agricultural Surfactant Market Revenue Million Forecast, by Country 2019 & 2032
- Table 9: United States Agricultural Surfactant Market Revenue (Million) Forecast, by Application 2019 & 2032
- Table 10: Canada Agricultural Surfactant Market Revenue (Million) Forecast, by Application 2019 & 2032
- Table 11: Mexico Agricultural Surfactant Market Revenue (Million) Forecast, by Application 2019 & 2032
- Table 12: Rest of North America Agricultural Surfactant Market Revenue (Million) Forecast, by Application 2019 & 2032
- Table 13: Global Agricultural Surfactant Market Revenue Million Forecast, by Country 2019 & 2032
- Table 14: Germany Agricultural Surfactant Market Revenue (Million) Forecast, by Application 2019 & 2032
- Table 15: United Kingdom Agricultural Surfactant Market Revenue (Million) Forecast, by Application 2019 & 2032
- Table 16: France Agricultural Surfactant Market Revenue (Million) Forecast, by Application 2019 & 2032
- Table 17: Spain Agricultural Surfactant Market Revenue (Million) Forecast, by Application 2019 & 2032
- Table 18: Italy Agricultural Surfactant Market Revenue (Million) Forecast, by Application 2019 & 2032
- Table 19: Russia Agricultural Surfactant Market Revenue (Million) Forecast, by Application 2019 & 2032
- Table 20: Rest of Europe Agricultural Surfactant Market Revenue (Million) Forecast, by Application 2019 & 2032
- Table 21: Global Agricultural Surfactant Market Revenue Million Forecast, by Country 2019 & 2032
- Table 22: China Agricultural Surfactant Market Revenue (Million) Forecast, by Application 2019 & 2032
- Table 23: Japan Agricultural Surfactant Market Revenue (Million) Forecast, by Application 2019 & 2032
- Table 24: India Agricultural Surfactant Market Revenue (Million) Forecast, by Application 2019 & 2032
- Table 25: Australia Agricultural Surfactant Market Revenue (Million) Forecast, by Application 2019 & 2032
- Table 26: Rest of Asia Pacific Agricultural Surfactant Market Revenue (Million) Forecast, by Application 2019 & 2032
- Table 27: Global Agricultural Surfactant Market Revenue Million Forecast, by Country 2019 & 2032
- Table 28: Brazil Agricultural Surfactant Market Revenue (Million) Forecast, by Application 2019 & 2032
- Table 29: Argentina Agricultural Surfactant Market Revenue (Million) Forecast, by Application 2019 & 2032
- Table 30: Rest of South America Agricultural Surfactant Market Revenue (Million) Forecast, by Application 2019 & 2032
- Table 31: Global Agricultural Surfactant Market Revenue Million Forecast, by Country 2019 & 2032
- Table 32: South Africa Agricultural Surfactant Market Revenue (Million) Forecast, by Application 2019 & 2032
- Table 33: Rest of Middle East and Africa Agricultural Surfactant Market Revenue (Million) Forecast, by Application 2019 & 2032
- Table 34: Global Agricultural Surfactant Market Revenue Million Forecast, by Production Analysis 2019 & 2032
- Table 35: Global Agricultural Surfactant Market Revenue Million Forecast, by Consumption Analysis 2019 & 2032
- Table 36: Global Agricultural Surfactant Market Revenue Million Forecast, by Import Market Analysis (Value & Volume) 2019 & 2032
- Table 37: Global Agricultural Surfactant Market Revenue Million Forecast, by Export Market Analysis (Value & Volume) 2019 & 2032
- Table 38: Global Agricultural Surfactant Market Revenue Million Forecast, by Price Trend Analysis 2019 & 2032
- Table 39: Global Agricultural Surfactant Market Revenue Million Forecast, by Country 2019 & 2032
- Table 40: United States Agricultural Surfactant Market Revenue (Million) Forecast, by Application 2019 & 2032
- Table 41: Canada Agricultural Surfactant Market Revenue (Million) Forecast, by Application 2019 & 2032
- Table 42: Mexico Agricultural Surfactant Market Revenue (Million) Forecast, by Application 2019 & 2032
- Table 43: Global Agricultural Surfactant Market Revenue Million Forecast, by Production Analysis 2019 & 2032
- Table 44: Global Agricultural Surfactant Market Revenue Million Forecast, by Consumption Analysis 2019 & 2032
- Table 45: Global Agricultural Surfactant Market Revenue Million Forecast, by Import Market Analysis (Value & Volume) 2019 & 2032
- Table 46: Global Agricultural Surfactant Market Revenue Million Forecast, by Export Market Analysis (Value & Volume) 2019 & 2032
- Table 47: Global Agricultural Surfactant Market Revenue Million Forecast, by Price Trend Analysis 2019 & 2032
- Table 48: Global Agricultural Surfactant Market Revenue Million Forecast, by Country 2019 & 2032
- Table 49: Brazil Agricultural Surfactant Market Revenue (Million) Forecast, by Application 2019 & 2032
- Table 50: Argentina Agricultural Surfactant Market Revenue (Million) Forecast, by Application 2019 & 2032
- Table 51: Rest of South America Agricultural Surfactant Market Revenue (Million) Forecast, by Application 2019 & 2032
- Table 52: Global Agricultural Surfactant Market Revenue Million Forecast, by Production Analysis 2019 & 2032
- Table 53: Global Agricultural Surfactant Market Revenue Million Forecast, by Consumption Analysis 2019 & 2032
- Table 54: Global Agricultural Surfactant Market Revenue Million Forecast, by Import Market Analysis (Value & Volume) 2019 & 2032
- Table 55: Global Agricultural Surfactant Market Revenue Million Forecast, by Export Market Analysis (Value & Volume) 2019 & 2032
- Table 56: Global Agricultural Surfactant Market Revenue Million Forecast, by Price Trend Analysis 2019 & 2032
- Table 57: Global Agricultural Surfactant Market Revenue Million Forecast, by Country 2019 & 2032
- Table 58: United Kingdom Agricultural Surfactant Market Revenue (Million) Forecast, by Application 2019 & 2032
- Table 59: Germany Agricultural Surfactant Market Revenue (Million) Forecast, by Application 2019 & 2032
- Table 60: France Agricultural Surfactant Market Revenue (Million) Forecast, by Application 2019 & 2032
- Table 61: Italy Agricultural Surfactant Market Revenue (Million) Forecast, by Application 2019 & 2032
- Table 62: Spain Agricultural Surfactant Market Revenue (Million) Forecast, by Application 2019 & 2032
- Table 63: Russia Agricultural Surfactant Market Revenue (Million) Forecast, by Application 2019 & 2032
- Table 64: Benelux Agricultural Surfactant Market Revenue (Million) Forecast, by Application 2019 & 2032
- Table 65: Nordics Agricultural Surfactant Market Revenue (Million) Forecast, by Application 2019 & 2032
- Table 66: Rest of Europe Agricultural Surfactant Market Revenue (Million) Forecast, by Application 2019 & 2032
- Table 67: Global Agricultural Surfactant Market Revenue Million Forecast, by Production Analysis 2019 & 2032
- Table 68: Global Agricultural Surfactant Market Revenue Million Forecast, by Consumption Analysis 2019 & 2032
- Table 69: Global Agricultural Surfactant Market Revenue Million Forecast, by Import Market Analysis (Value & Volume) 2019 & 2032
- Table 70: Global Agricultural Surfactant Market Revenue Million Forecast, by Export Market Analysis (Value & Volume) 2019 & 2032
- Table 71: Global Agricultural Surfactant Market Revenue Million Forecast, by Price Trend Analysis 2019 & 2032
- Table 72: Global Agricultural Surfactant Market Revenue Million Forecast, by Country 2019 & 2032
- Table 73: Turkey Agricultural Surfactant Market Revenue (Million) Forecast, by Application 2019 & 2032
- Table 74: Israel Agricultural Surfactant Market Revenue (Million) Forecast, by Application 2019 & 2032
- Table 75: GCC Agricultural Surfactant Market Revenue (Million) Forecast, by Application 2019 & 2032
- Table 76: North Africa Agricultural Surfactant Market Revenue (Million) Forecast, by Application 2019 & 2032
- Table 77: South Africa Agricultural Surfactant Market Revenue (Million) Forecast, by Application 2019 & 2032
- Table 78: Rest of Middle East & Africa Agricultural Surfactant Market Revenue (Million) Forecast, by Application 2019 & 2032
- Table 79: Global Agricultural Surfactant Market Revenue Million Forecast, by Production Analysis 2019 & 2032
- Table 80: Global Agricultural Surfactant Market Revenue Million Forecast, by Consumption Analysis 2019 & 2032
- Table 81: Global Agricultural Surfactant Market Revenue Million Forecast, by Import Market Analysis (Value & Volume) 2019 & 2032
- Table 82: Global Agricultural Surfactant Market Revenue Million Forecast, by Export Market Analysis (Value & Volume) 2019 & 2032
- Table 83: Global Agricultural Surfactant Market Revenue Million Forecast, by Price Trend Analysis 2019 & 2032
- Table 84: Global Agricultural Surfactant Market Revenue Million Forecast, by Country 2019 & 2032
- Table 85: China Agricultural Surfactant Market Revenue (Million) Forecast, by Application 2019 & 2032
- Table 86: India Agricultural Surfactant Market Revenue (Million) Forecast, by Application 2019 & 2032
- Table 87: Japan Agricultural Surfactant Market Revenue (Million) Forecast, by Application 2019 & 2032
- Table 88: South Korea Agricultural Surfactant Market Revenue (Million) Forecast, by Application 2019 & 2032
- Table 89: ASEAN Agricultural Surfactant Market Revenue (Million) Forecast, by Application 2019 & 2032
- Table 90: Oceania Agricultural Surfactant Market Revenue (Million) Forecast, by Application 2019 & 2032
- Table 91: Rest of Asia Pacific Agricultural Surfactant Market Revenue (Million) Forecast, by Application 2019 & 2032
Frequently Asked Questions
1. What is the projected Compound Annual Growth Rate (CAGR) of the Agricultural Surfactant Market?
The projected CAGR is approximately 6.70%.
2. Which companies are prominent players in the Agricultural Surfactant Market?
Key companies in the market include Tanatex Chemicals BV, Clariant, Solvay SA, Akzonobel, Interagro (Uk) Ltd, Brandt Consolidated Inc, Garrco Products Inc, Lamberti SPA, Kao Corporation, Helena Chemical Company, Air Products and Chemicals, Nufarm Limited, Wilbur-Ellis Company, Huntsman, Corteva Agriscience, Croda International PLC, Evonik Industries, BASF SE.
3. What are the main segments of the Agricultural Surfactant Market?
The market segments include Production Analysis, Consumption Analysis, Import Market Analysis (Value & Volume), Export Market Analysis (Value & Volume), Price Trend Analysis.
4. Can you provide details about the market size?
The market size is estimated to be USD 2.04 Million as of 2022.
5. What are some drivers contributing to market growth?
Shortage of Skilled Labor; Government Support to Enhance Farm Mechanization.
6. What are the notable trends driving market growth?
Rising Demand for Food and Shrinking Land Driving the Market.
7. Are there any restraints impacting market growth?
Heavy Initial Procurement Cost and High Expenditure on Maintenance.
8. Can you provide examples of recent developments in the market?
March 2022 - Dow announced a new product extension of VORASURF™ Silicone Surfactants to support the growing demand for enhanced energy efficiency and sustainable solutions in the rigid polyurethane foam market, with a specific focus on spray and construction applications.
9. What pricing options are available for accessing the report?
Pricing options include single-user, multi-user, and enterprise licenses priced at USD 4750, USD 5250, and USD 8750 respectively.
10. Is the market size provided in terms of value or volume?
The market size is provided in terms of value, measured in Million.
11. Are there any specific market keywords associated with the report?
Yes, the market keyword associated with the report is "Agricultural Surfactant Market," which aids in identifying and referencing the specific market segment covered.
12. How do I determine which pricing option suits my needs best?
The pricing options vary based on user requirements and access needs. Individual users may opt for single-user licenses, while businesses requiring broader access may choose multi-user or enterprise licenses for cost-effective access to the report.
13. Are there any additional resources or data provided in the Agricultural Surfactant Market report?
While the report offers comprehensive insights, it's advisable to review the specific contents or supplementary materials provided to ascertain if additional resources or data are available.
14. How can I stay updated on further developments or reports in the Agricultural Surfactant Market?
To stay informed about further developments, trends, and reports in the Agricultural Surfactant Market, consider subscribing to industry newsletters, following relevant companies and organizations, or regularly checking reputable industry news sources and publications.
Methodology
Step 1 - Identification of Relevant Samples Size from Population Database


Step 2 - Approaches for Defining Global Market Size (Value, Volume* & Price*)

Note*: In applicable scenarios
Step 3 - Data Sources
Primary Research
- Web Analytics
- Survey Reports
- Research Institute
- Latest Research Reports
- Opinion Leaders
Secondary Research
- Annual Reports
- White Paper
- Latest Press Release
- Industry Association
- Paid Database
- Investor Presentations

Step 4 - Data Triangulation
Involves using different sources of information in order to increase the validity of a study
These sources are likely to be stakeholders in a program - participants, other researchers, program staff, other community members, and so on.
Then we put all data in single framework & apply various statistical tools to find out the dynamic on the market.
During the analysis stage, feedback from the stakeholder groups would be compared to determine areas of agreement as well as areas of divergence
