

Key Insights
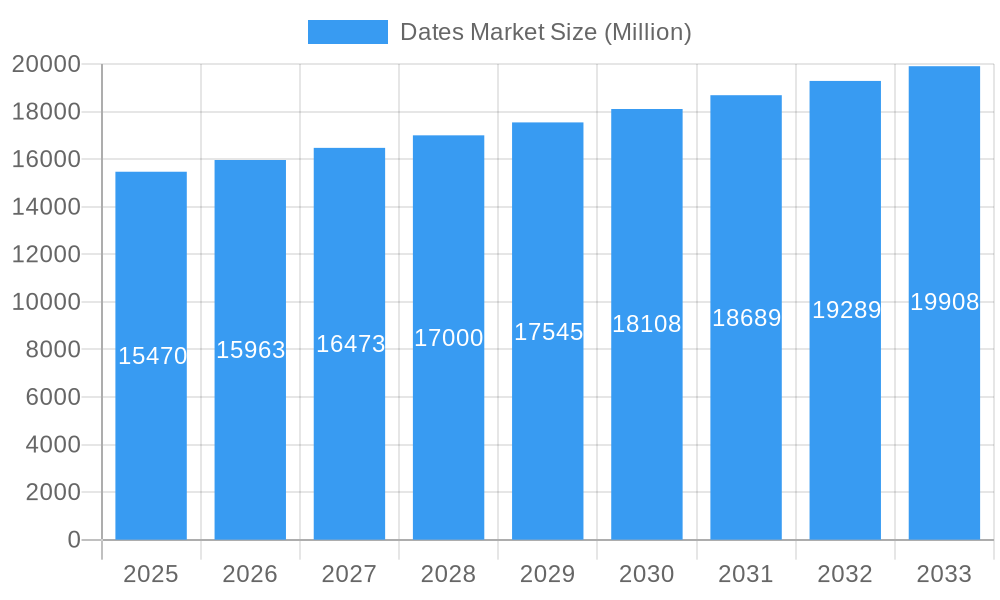
The global dates market, valued at $15.47 billion in 2025, is projected to experience steady growth, driven by increasing consumer awareness of the nutritional benefits of dates and their versatile applications in the food and beverage industry. The market's Compound Annual Growth Rate (CAGR) of 3.27% from 2025 to 2033 indicates a consistent expansion, fueled by factors such as rising health consciousness among consumers leading to increased demand for natural sweeteners and healthy snacks. The growing popularity of vegan and vegetarian diets further boosts the demand for dates as a natural and versatile ingredient. Key segments like Medjool and Deglet Noor dates hold significant market share due to their superior taste and quality, while the food and confectionery applications drive substantial consumption. Expanding distribution channels, both online and offline, and the increasing adoption of innovative packaging solutions contribute to the market's growth trajectory. However, factors like fluctuating prices of raw materials and seasonal variations in production could pose challenges to sustained growth. Regional variations in consumption patterns also play a role, with regions like the Middle East and Africa maintaining strong traditional consumption while North America and Europe exhibit growing adoption of dates as a premium natural food product. The competitive landscape features established players alongside emerging date producers, fostering innovation and product diversification.
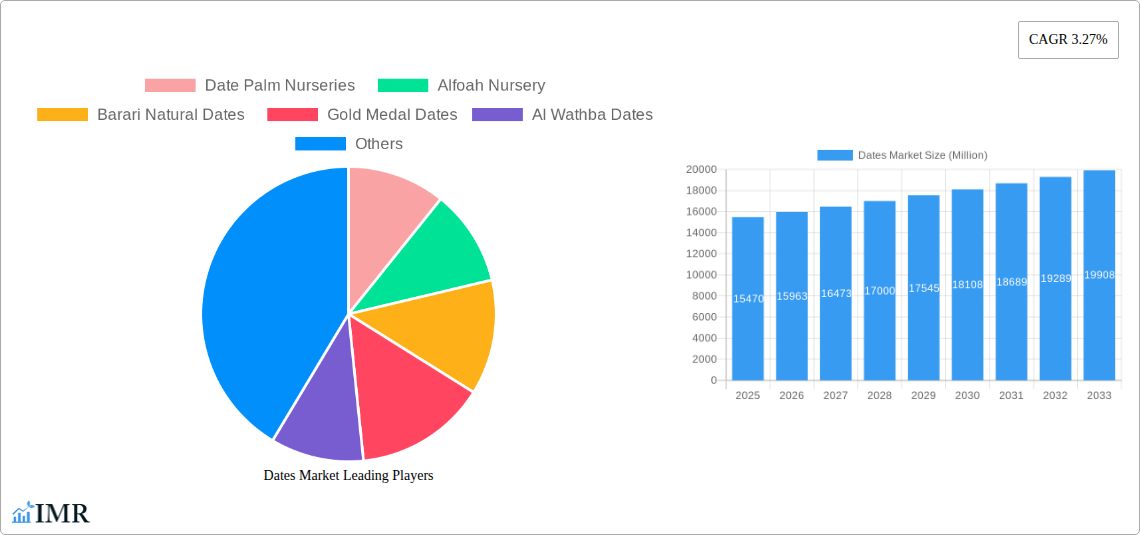
Dates Market Market Size (In Billion)
The forecast period (2025-2033) anticipates a continued expansion of the dates market, influenced by factors like growing health-conscious consumer preferences, the rise of functional foods, and increasing demand for convenient, healthy snack options. Strategic partnerships between producers and retailers are anticipated to enhance market reach, while product innovation, including the development of value-added products, will contribute to premiumization within the segment. Geographical expansion into new markets, particularly in developing economies, will further drive growth. While challenges remain, such as maintaining consistent supply chains and managing price fluctuations, the overall outlook for the dates market remains positive, with considerable potential for further expansion in the coming years. The market's segmentation by type (Medjool, Deglet Noor, etc.) and application (food, beverage, confectionery, etc.) offers opportunities for specialized product development and targeted marketing strategies.
Dates Market Company Market Share
Dates Market: A Comprehensive Market Report (2019-2033)
This comprehensive report provides an in-depth analysis of the global Dates Market, encompassing market dynamics, growth trends, regional dominance, product landscape, key players, and future outlook. The study period covers 2019-2033, with 2025 as the base and estimated year. This report is essential for industry professionals, investors, and stakeholders seeking a thorough understanding of this lucrative market. Parent market: Global Dried Fruits Market, Child Market: Global Specialty Food Market.
Dates Market Dynamics & Structure
The global dates market is characterized by a moderately concentrated structure with several key players commanding significant market share. Technological innovations, primarily in harvesting, processing, and packaging, are driving efficiency and product quality improvements. Stringent regulatory frameworks concerning food safety and hygiene influence market operations. Competition from other dried fruits and sweeteners acts as a substitute, while consumer demand for healthy snacks and natural sweeteners fuels market growth. Mergers and acquisitions (M&A) activity remains relatively low, with xx deals recorded between 2019 and 2024, representing a xx% market share change in the top 5 players.
- Market Concentration: Moderately concentrated, with top 5 players holding xx% market share in 2024.
- Technological Innovation: Focus on automation in harvesting and advanced processing techniques for enhanced shelf life and quality.
- Regulatory Framework: Stringent food safety standards and labeling regulations impacting market players.
- Competitive Substitutes: Dried fruits (raisins, figs), sweeteners (honey, sugar).
- End-User Demographics: Increasing health-conscious consumers driving demand for natural sweeteners.
- M&A Trends: Limited M&A activity, primarily focused on consolidation within specific regions.
Dates Market Growth Trends & Insights
The global dates market experienced robust growth during the historical period (2019-2024), with a CAGR of xx%. This growth is primarily attributed to rising consumer demand for healthy and natural food products, increasing awareness of the nutritional benefits of dates, and expanding applications across various food and beverage sectors. Technological advancements in cultivation, processing, and packaging have enhanced product quality and shelf life, further contributing to market expansion. Shifting consumer preferences towards convenient and ready-to-eat snacks have positively impacted the market. The market is expected to maintain a steady growth trajectory during the forecast period (2025-2033), with a projected CAGR of xx%, driven by factors including increasing disposable incomes, expanding retail channels, and product diversification. Market penetration is expected to reach xx% by 2033.
Dominant Regions, Countries, or Segments in Dates Market
The Middle East and North Africa (MENA) region remains the dominant producer and consumer of dates, accounting for xx% of global production in 2024. Within the MENA region, Saudi Arabia, Iran, and Egypt are key players, exhibiting high consumption rates and robust domestic production. The Medjool variety commands the highest price and market share due to its superior flavor and texture. In terms of application, the food sector dominates the market, with confectionery and beverage segments demonstrating significant growth potential.
- Key Drivers (MENA): Favorable climatic conditions, established cultivation practices, government support for the date palm industry.
- Key Drivers (Medjool): Premium quality, distinct flavor profile, high consumer preference.
- Key Drivers (Food Application): Versatile usage in various food products, growing health consciousness.
Dates Market Product Landscape
The dates market features a diverse range of products, categorized by type (Medjool, Deglet Noor, Khalas, Sayer, Sukari) and application (food, beverage, confectionery, other). Product innovation focuses on extending shelf life through improved packaging and processing techniques, while new product formats, such as date-based energy bars and spreads, are gaining traction. Unique selling propositions include organic certification, traceability, and unique flavor profiles. Technological advancements are improving efficiency in cultivation, harvesting, and processing.
Key Drivers, Barriers & Challenges in Dates Market
Key Drivers:
- Growing consumer demand for healthy and natural sweeteners.
- Increasing awareness of the nutritional benefits of dates.
- Expansion of the food and beverage industry.
- Government initiatives to promote date palm cultivation.
Challenges & Restraints:
- Fluctuations in date production due to climatic factors.
- Competition from other dried fruits and sweeteners.
- Challenges in maintaining consistent product quality across different regions.
- Supply chain inefficiencies impacting product availability and cost.
Emerging Opportunities in Dates Market
- Expanding into new markets in Asia and Europe through strategic partnerships.
- Development of value-added products such as date syrups, purees, and extracts.
- Exploring innovative applications of dates in functional foods and nutraceuticals.
- Growing demand for organic and sustainably sourced dates presenting significant opportunities.
Growth Accelerators in the Dates Market Industry
Technological advancements in cultivation, processing, and packaging, coupled with strategic partnerships between producers, processors, and retailers are accelerating market growth. Government initiatives promoting date palm cultivation and market diversification into new applications are further driving expansion. Increased consumer awareness of the nutritional benefits of dates, coupled with improved access to retail channels, are expected to boost long-term market growth.
Key Players Shaping the Dates Market Market
- Date Palm Nurseries
- Alfoah Nursery
- Barari Natural Dates
- Gold Medal Dates
- Al Wathba Dates
Notable Milestones in Dates Market Sector
- October 2022: Morocco's plan to double date production by 2030, aiming for 300,000 tons annually, signifies increased investment and market expansion.
- April 2022: Launch of the 'Saudidates' B2B platform facilitates efficient trading of dates globally, boosting market accessibility and efficiency.
In-Depth Dates Market Market Outlook
The global dates market is poised for sustained growth over the forecast period, driven by factors such as rising consumer demand, technological advancements, and supportive government policies. Strategic partnerships and market expansion into new geographical regions present significant opportunities for market players. The focus on product diversification, sustainable farming practices, and innovative applications will further contribute to the market's robust growth trajectory. The market is projected to reach xx million units by 2033, presenting a significant investment opportunity for stakeholders.
Dates Market Segmentation
- 1. Production Analysis
- 2. Consumption Analysis
- 3. Import Market Analysis (Value & Volume)
- 4. Export Market Analysis (Value & Volume)
- 5. Price Trend Analysis
Dates Market Segmentation By Geography
-
1. North America
- 1.1. United States
- 1.2. Canada
-
2. Europe
- 2.1. Germany
- 2.2. United Kingdom
- 2.3. France
- 2.4. Netherlands
- 2.5. Italy
-
3. Asia Pacific
- 3.1. India
- 3.2. Indonesia
- 3.3. Malaysia
- 3.4. Pakistan
-
4. South America
- 4.1. Brazil
- 4.2. Argentina
-
5. Middle East and Africa
- 5.1. Unites Arab Emirates
- 5.2. Saudi Arabia
- 5.3. Oman
- 5.4. Egypt
- 5.5. Morocco
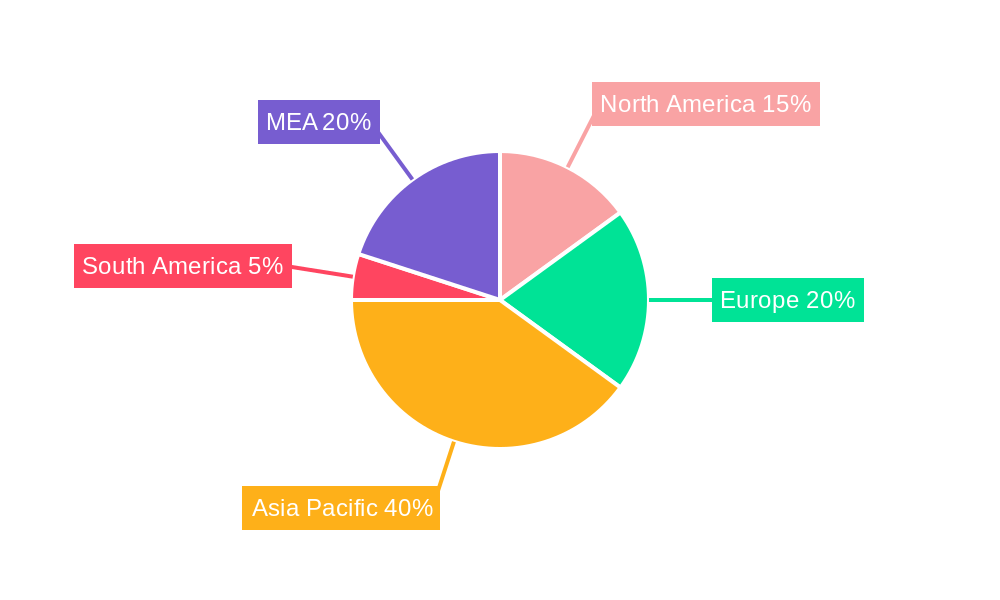
Dates Market Regional Market Share
Geographic Coverage of Dates Market
Dates Market REPORT HIGHLIGHTS
| Aspects | Details |
|---|---|
| Study Period | 2020-2034 |
| Base Year | 2025 |
| Estimated Year | 2026 |
| Forecast Period | 2026-2034 |
| Historical Period | 2020-2025 |
| Growth Rate | CAGR of 3.27% from 2020-2034 |
| Segmentation |
|
Table of Contents
- 1. Introduction
- 1.1. Research Scope
- 1.2. Market Segmentation
- 1.3. Research Objective
- 1.4. Definitions and Assumptions
- 2. Executive Summary
- 2.1. Market Snapshot
- 3. Market Dynamics
- 3.1. Market Drivers
- 3.2. Market Restrains
- 3.3. Market Trends
- 3.4. Market Opportunities
- 4. Market Factor Analysis
- 4.1. Porters Five Forces
- 4.1.1. Bargaining Power of Suppliers
- 4.1.2. Bargaining Power of Buyers
- 4.1.3. Threat of New Entrants
- 4.1.4. Threat of Substitutes
- 4.1.5. Competitive Rivalry
- 4.2. PESTEL analysis
- 4.3. BCG Analysis
- 4.3.1. Stars (High Growth, High Market Share)
- 4.3.2. Cash Cows (Low Growth, High Market Share)
- 4.3.3. Question Mark (High Growth, Low Market Share)
- 4.3.4. Dogs (Low Growth, Low Market Share)
- 4.4. Ansoff Matrix Analysis
- 4.5. Supply Chain Analysis
- 4.6. Regulatory Landscape
- 4.7. Current Market Potential and Opportunity Assessment (TAM–SAM–SOM Framework)
- 4.8. IMR Analyst Note
- 4.1. Porters Five Forces
- 5. Market Analysis, Insights and Forecast 2021-2033
- 5.1. Market Analysis, Insights and Forecast - by Production Analysis
- 5.2. Market Analysis, Insights and Forecast - by Consumption Analysis
- 5.3. Market Analysis, Insights and Forecast - by Import Market Analysis (Value & Volume)
- 5.4. Market Analysis, Insights and Forecast - by Export Market Analysis (Value & Volume)
- 5.5. Market Analysis, Insights and Forecast - by Price Trend Analysis
- 5.6. Market Analysis, Insights and Forecast - by Region
- 5.6.1. North America
- 5.6.2. Europe
- 5.6.3. Asia Pacific
- 5.6.4. South America
- 5.6.5. Middle East and Africa
- 6. Global Dates Market Analysis, Insights and Forecast, 2021-2033
- 6.1. Market Analysis, Insights and Forecast - by Production Analysis
- 6.2. Market Analysis, Insights and Forecast - by Consumption Analysis
- 6.3. Market Analysis, Insights and Forecast - by Import Market Analysis (Value & Volume)
- 6.4. Market Analysis, Insights and Forecast - by Export Market Analysis (Value & Volume)
- 6.5. Market Analysis, Insights and Forecast - by Price Trend Analysis
- 7. North America Dates Market Analysis, Insights and Forecast, 2020-2032
- 7.1. Market Analysis, Insights and Forecast - by Production Analysis
- 7.2. Market Analysis, Insights and Forecast - by Consumption Analysis
- 7.3. Market Analysis, Insights and Forecast - by Import Market Analysis (Value & Volume)
- 7.4. Market Analysis, Insights and Forecast - by Export Market Analysis (Value & Volume)
- 7.5. Market Analysis, Insights and Forecast - by Price Trend Analysis
- 8. Europe Dates Market Analysis, Insights and Forecast, 2020-2032
- 8.1. Market Analysis, Insights and Forecast - by Production Analysis
- 8.2. Market Analysis, Insights and Forecast - by Consumption Analysis
- 8.3. Market Analysis, Insights and Forecast - by Import Market Analysis (Value & Volume)
- 8.4. Market Analysis, Insights and Forecast - by Export Market Analysis (Value & Volume)
- 8.5. Market Analysis, Insights and Forecast - by Price Trend Analysis
- 9. Asia Pacific Dates Market Analysis, Insights and Forecast, 2020-2032
- 9.1. Market Analysis, Insights and Forecast - by Production Analysis
- 9.2. Market Analysis, Insights and Forecast - by Consumption Analysis
- 9.3. Market Analysis, Insights and Forecast - by Import Market Analysis (Value & Volume)
- 9.4. Market Analysis, Insights and Forecast - by Export Market Analysis (Value & Volume)
- 9.5. Market Analysis, Insights and Forecast - by Price Trend Analysis
- 10. South America Dates Market Analysis, Insights and Forecast, 2020-2032
- 10.1. Market Analysis, Insights and Forecast - by Production Analysis
- 10.2. Market Analysis, Insights and Forecast - by Consumption Analysis
- 10.3. Market Analysis, Insights and Forecast - by Import Market Analysis (Value & Volume)
- 10.4. Market Analysis, Insights and Forecast - by Export Market Analysis (Value & Volume)
- 10.5. Market Analysis, Insights and Forecast - by Price Trend Analysis
- 11. Middle East and Africa Dates Market Analysis, Insights and Forecast, 2020-2032
- 11.1. Market Analysis, Insights and Forecast - by Production Analysis
- 11.2. Market Analysis, Insights and Forecast - by Consumption Analysis
- 11.3. Market Analysis, Insights and Forecast - by Import Market Analysis (Value & Volume)
- 11.4. Market Analysis, Insights and Forecast - by Export Market Analysis (Value & Volume)
- 11.5. Market Analysis, Insights and Forecast - by Price Trend Analysis
- 12. Competitive Analysis
- 12.1. Company Profiles
- 12.1.1 Date Palm Nurseries
- 12.1.1.1. Company Overview
- 12.1.1.2. Products
- 12.1.1.3. Company Financials
- 12.1.1.4. SWOT Analysis
- 12.1.2 Alfoah Nursery
- 12.1.2.1. Company Overview
- 12.1.2.2. Products
- 12.1.2.3. Company Financials
- 12.1.2.4. SWOT Analysis
- 12.1.3 Barari Natural Dates
- 12.1.3.1. Company Overview
- 12.1.3.2. Products
- 12.1.3.3. Company Financials
- 12.1.3.4. SWOT Analysis
- 12.1.4 Gold Medal Dates
- 12.1.4.1. Company Overview
- 12.1.4.2. Products
- 12.1.4.3. Company Financials
- 12.1.4.4. SWOT Analysis
- 12.1.5 Al Wathba Dates
- 12.1.5.1. Company Overview
- 12.1.5.2. Products
- 12.1.5.3. Company Financials
- 12.1.5.4. SWOT Analysis
- 12.1.1 Date Palm Nurseries
- 12.2. Market Entropy
- 12.2.1 Company's Key Areas Served
- 12.2.2 Recent Developments
- 12.3. Company Market Share Analysis 2025
- 12.3.1 Top 5 Companies Market Share Analysis
- 12.3.2 Top 3 Companies Market Share Analysis
- 12.4. List of Potential Customers
- 13. Research Methodology
List of Figures
- Figure 1: Global Dates Market Revenue Breakdown (Million, %) by Region 2025 & 2033
- Figure 2: North America Dates Market Revenue (Million), by Production Analysis 2025 & 2033
- Figure 3: North America Dates Market Revenue Share (%), by Production Analysis 2025 & 2033
- Figure 4: North America Dates Market Revenue (Million), by Consumption Analysis 2025 & 2033
- Figure 5: North America Dates Market Revenue Share (%), by Consumption Analysis 2025 & 2033
- Figure 6: North America Dates Market Revenue (Million), by Import Market Analysis (Value & Volume) 2025 & 2033
- Figure 7: North America Dates Market Revenue Share (%), by Import Market Analysis (Value & Volume) 2025 & 2033
- Figure 8: North America Dates Market Revenue (Million), by Export Market Analysis (Value & Volume) 2025 & 2033
- Figure 9: North America Dates Market Revenue Share (%), by Export Market Analysis (Value & Volume) 2025 & 2033
- Figure 10: North America Dates Market Revenue (Million), by Price Trend Analysis 2025 & 2033
- Figure 11: North America Dates Market Revenue Share (%), by Price Trend Analysis 2025 & 2033
- Figure 12: North America Dates Market Revenue (Million), by Country 2025 & 2033
- Figure 13: North America Dates Market Revenue Share (%), by Country 2025 & 2033
- Figure 14: Europe Dates Market Revenue (Million), by Production Analysis 2025 & 2033
- Figure 15: Europe Dates Market Revenue Share (%), by Production Analysis 2025 & 2033
- Figure 16: Europe Dates Market Revenue (Million), by Consumption Analysis 2025 & 2033
- Figure 17: Europe Dates Market Revenue Share (%), by Consumption Analysis 2025 & 2033
- Figure 18: Europe Dates Market Revenue (Million), by Import Market Analysis (Value & Volume) 2025 & 2033
- Figure 19: Europe Dates Market Revenue Share (%), by Import Market Analysis (Value & Volume) 2025 & 2033
- Figure 20: Europe Dates Market Revenue (Million), by Export Market Analysis (Value & Volume) 2025 & 2033
- Figure 21: Europe Dates Market Revenue Share (%), by Export Market Analysis (Value & Volume) 2025 & 2033
- Figure 22: Europe Dates Market Revenue (Million), by Price Trend Analysis 2025 & 2033
- Figure 23: Europe Dates Market Revenue Share (%), by Price Trend Analysis 2025 & 2033
- Figure 24: Europe Dates Market Revenue (Million), by Country 2025 & 2033
- Figure 25: Europe Dates Market Revenue Share (%), by Country 2025 & 2033
- Figure 26: Asia Pacific Dates Market Revenue (Million), by Production Analysis 2025 & 2033
- Figure 27: Asia Pacific Dates Market Revenue Share (%), by Production Analysis 2025 & 2033
- Figure 28: Asia Pacific Dates Market Revenue (Million), by Consumption Analysis 2025 & 2033
- Figure 29: Asia Pacific Dates Market Revenue Share (%), by Consumption Analysis 2025 & 2033
- Figure 30: Asia Pacific Dates Market Revenue (Million), by Import Market Analysis (Value & Volume) 2025 & 2033
- Figure 31: Asia Pacific Dates Market Revenue Share (%), by Import Market Analysis (Value & Volume) 2025 & 2033
- Figure 32: Asia Pacific Dates Market Revenue (Million), by Export Market Analysis (Value & Volume) 2025 & 2033
- Figure 33: Asia Pacific Dates Market Revenue Share (%), by Export Market Analysis (Value & Volume) 2025 & 2033
- Figure 34: Asia Pacific Dates Market Revenue (Million), by Price Trend Analysis 2025 & 2033
- Figure 35: Asia Pacific Dates Market Revenue Share (%), by Price Trend Analysis 2025 & 2033
- Figure 36: Asia Pacific Dates Market Revenue (Million), by Country 2025 & 2033
- Figure 37: Asia Pacific Dates Market Revenue Share (%), by Country 2025 & 2033
- Figure 38: South America Dates Market Revenue (Million), by Production Analysis 2025 & 2033
- Figure 39: South America Dates Market Revenue Share (%), by Production Analysis 2025 & 2033
- Figure 40: South America Dates Market Revenue (Million), by Consumption Analysis 2025 & 2033
- Figure 41: South America Dates Market Revenue Share (%), by Consumption Analysis 2025 & 2033
- Figure 42: South America Dates Market Revenue (Million), by Import Market Analysis (Value & Volume) 2025 & 2033
- Figure 43: South America Dates Market Revenue Share (%), by Import Market Analysis (Value & Volume) 2025 & 2033
- Figure 44: South America Dates Market Revenue (Million), by Export Market Analysis (Value & Volume) 2025 & 2033
- Figure 45: South America Dates Market Revenue Share (%), by Export Market Analysis (Value & Volume) 2025 & 2033
- Figure 46: South America Dates Market Revenue (Million), by Price Trend Analysis 2025 & 2033
- Figure 47: South America Dates Market Revenue Share (%), by Price Trend Analysis 2025 & 2033
- Figure 48: South America Dates Market Revenue (Million), by Country 2025 & 2033
- Figure 49: South America Dates Market Revenue Share (%), by Country 2025 & 2033
- Figure 50: Middle East and Africa Dates Market Revenue (Million), by Production Analysis 2025 & 2033
- Figure 51: Middle East and Africa Dates Market Revenue Share (%), by Production Analysis 2025 & 2033
- Figure 52: Middle East and Africa Dates Market Revenue (Million), by Consumption Analysis 2025 & 2033
- Figure 53: Middle East and Africa Dates Market Revenue Share (%), by Consumption Analysis 2025 & 2033
- Figure 54: Middle East and Africa Dates Market Revenue (Million), by Import Market Analysis (Value & Volume) 2025 & 2033
- Figure 55: Middle East and Africa Dates Market Revenue Share (%), by Import Market Analysis (Value & Volume) 2025 & 2033
- Figure 56: Middle East and Africa Dates Market Revenue (Million), by Export Market Analysis (Value & Volume) 2025 & 2033
- Figure 57: Middle East and Africa Dates Market Revenue Share (%), by Export Market Analysis (Value & Volume) 2025 & 2033
- Figure 58: Middle East and Africa Dates Market Revenue (Million), by Price Trend Analysis 2025 & 2033
- Figure 59: Middle East and Africa Dates Market Revenue Share (%), by Price Trend Analysis 2025 & 2033
- Figure 60: Middle East and Africa Dates Market Revenue (Million), by Country 2025 & 2033
- Figure 61: Middle East and Africa Dates Market Revenue Share (%), by Country 2025 & 2033
List of Tables
- Table 1: Global Dates Market Revenue Million Forecast, by Production Analysis 2020 & 2033
- Table 2: Global Dates Market Revenue Million Forecast, by Consumption Analysis 2020 & 2033
- Table 3: Global Dates Market Revenue Million Forecast, by Import Market Analysis (Value & Volume) 2020 & 2033
- Table 4: Global Dates Market Revenue Million Forecast, by Export Market Analysis (Value & Volume) 2020 & 2033
- Table 5: Global Dates Market Revenue Million Forecast, by Price Trend Analysis 2020 & 2033
- Table 6: Global Dates Market Revenue Million Forecast, by Region 2020 & 2033
- Table 7: Global Dates Market Revenue Million Forecast, by Production Analysis 2020 & 2033
- Table 8: Global Dates Market Revenue Million Forecast, by Consumption Analysis 2020 & 2033
- Table 9: Global Dates Market Revenue Million Forecast, by Import Market Analysis (Value & Volume) 2020 & 2033
- Table 10: Global Dates Market Revenue Million Forecast, by Export Market Analysis (Value & Volume) 2020 & 2033
- Table 11: Global Dates Market Revenue Million Forecast, by Price Trend Analysis 2020 & 2033
- Table 12: Global Dates Market Revenue Million Forecast, by Country 2020 & 2033
- Table 13: United States Dates Market Revenue (Million) Forecast, by Application 2020 & 2033
- Table 14: Canada Dates Market Revenue (Million) Forecast, by Application 2020 & 2033
- Table 15: Global Dates Market Revenue Million Forecast, by Production Analysis 2020 & 2033
- Table 16: Global Dates Market Revenue Million Forecast, by Consumption Analysis 2020 & 2033
- Table 17: Global Dates Market Revenue Million Forecast, by Import Market Analysis (Value & Volume) 2020 & 2033
- Table 18: Global Dates Market Revenue Million Forecast, by Export Market Analysis (Value & Volume) 2020 & 2033
- Table 19: Global Dates Market Revenue Million Forecast, by Price Trend Analysis 2020 & 2033
- Table 20: Global Dates Market Revenue Million Forecast, by Country 2020 & 2033
- Table 21: Germany Dates Market Revenue (Million) Forecast, by Application 2020 & 2033
- Table 22: United Kingdom Dates Market Revenue (Million) Forecast, by Application 2020 & 2033
- Table 23: France Dates Market Revenue (Million) Forecast, by Application 2020 & 2033
- Table 24: Netherlands Dates Market Revenue (Million) Forecast, by Application 2020 & 2033
- Table 25: Italy Dates Market Revenue (Million) Forecast, by Application 2020 & 2033
- Table 26: Global Dates Market Revenue Million Forecast, by Production Analysis 2020 & 2033
- Table 27: Global Dates Market Revenue Million Forecast, by Consumption Analysis 2020 & 2033
- Table 28: Global Dates Market Revenue Million Forecast, by Import Market Analysis (Value & Volume) 2020 & 2033
- Table 29: Global Dates Market Revenue Million Forecast, by Export Market Analysis (Value & Volume) 2020 & 2033
- Table 30: Global Dates Market Revenue Million Forecast, by Price Trend Analysis 2020 & 2033
- Table 31: Global Dates Market Revenue Million Forecast, by Country 2020 & 2033
- Table 32: India Dates Market Revenue (Million) Forecast, by Application 2020 & 2033
- Table 33: Indonesia Dates Market Revenue (Million) Forecast, by Application 2020 & 2033
- Table 34: Malaysia Dates Market Revenue (Million) Forecast, by Application 2020 & 2033
- Table 35: Pakistan Dates Market Revenue (Million) Forecast, by Application 2020 & 2033
- Table 36: Global Dates Market Revenue Million Forecast, by Production Analysis 2020 & 2033
- Table 37: Global Dates Market Revenue Million Forecast, by Consumption Analysis 2020 & 2033
- Table 38: Global Dates Market Revenue Million Forecast, by Import Market Analysis (Value & Volume) 2020 & 2033
- Table 39: Global Dates Market Revenue Million Forecast, by Export Market Analysis (Value & Volume) 2020 & 2033
- Table 40: Global Dates Market Revenue Million Forecast, by Price Trend Analysis 2020 & 2033
- Table 41: Global Dates Market Revenue Million Forecast, by Country 2020 & 2033
- Table 42: Brazil Dates Market Revenue (Million) Forecast, by Application 2020 & 2033
- Table 43: Argentina Dates Market Revenue (Million) Forecast, by Application 2020 & 2033
- Table 44: Global Dates Market Revenue Million Forecast, by Production Analysis 2020 & 2033
- Table 45: Global Dates Market Revenue Million Forecast, by Consumption Analysis 2020 & 2033
- Table 46: Global Dates Market Revenue Million Forecast, by Import Market Analysis (Value & Volume) 2020 & 2033
- Table 47: Global Dates Market Revenue Million Forecast, by Export Market Analysis (Value & Volume) 2020 & 2033
- Table 48: Global Dates Market Revenue Million Forecast, by Price Trend Analysis 2020 & 2033
- Table 49: Global Dates Market Revenue Million Forecast, by Country 2020 & 2033
- Table 50: Unites Arab Emirates Dates Market Revenue (Million) Forecast, by Application 2020 & 2033
- Table 51: Saudi Arabia Dates Market Revenue (Million) Forecast, by Application 2020 & 2033
- Table 52: Oman Dates Market Revenue (Million) Forecast, by Application 2020 & 2033
- Table 53: Egypt Dates Market Revenue (Million) Forecast, by Application 2020 & 2033
- Table 54: Morocco Dates Market Revenue (Million) Forecast, by Application 2020 & 2033
Frequently Asked Questions
1. What is the projected Compound Annual Growth Rate (CAGR) of the Dates Market?
The projected CAGR is approximately 3.27%.
2. Which companies are prominent players in the Dates Market?
Key companies in the market include Date Palm Nurseries , Alfoah Nursery , Barari Natural Dates , Gold Medal Dates, Al Wathba Dates .
3. What are the main segments of the Dates Market?
The market segments include Production Analysis, Consumption Analysis, Import Market Analysis (Value & Volume), Export Market Analysis (Value & Volume), Price Trend Analysis.
4. Can you provide details about the market size?
The market size is estimated to be USD 15.47 Million as of 2022.
5. What are some drivers contributing to market growth?
Increasing Berry Consumption for Health Benefits; Increasing Adoption of High-Technology Farm Practices; Growing Usage of Berries in the Food and Beverage Industries.
6. What are the notable trends driving market growth?
Rising Awareness of Health Benefits of Dates is Driving the Market.
7. Are there any restraints impacting market growth?
High Production Cost Involved in Berry Production; Increasing Disease and Pest Infestations.
8. Can you provide examples of recent developments in the market?
October 2022: Morocco aims to double its dates production by 2030 to reach 300,000 tons per year, against 149,000 tons in 2021, according to data from the Ministry of Agriculture, Maritime Fisheries, Rural Development and Water and Forests. This goal will be achieved through the implementation of the new strategy Generation Green 2020-2030 for the development of the sector of date palm aims to continue the rehabilitation of the traditional palm grove and the extension of plantations outside the palm grove.
9. What pricing options are available for accessing the report?
Pricing options include single-user, multi-user, and enterprise licenses priced at USD 4750, USD 5250, and USD 8750 respectively.
10. Is the market size provided in terms of value or volume?
The market size is provided in terms of value, measured in Million.
11. Are there any specific market keywords associated with the report?
Yes, the market keyword associated with the report is "Dates Market," which aids in identifying and referencing the specific market segment covered.
12. How do I determine which pricing option suits my needs best?
The pricing options vary based on user requirements and access needs. Individual users may opt for single-user licenses, while businesses requiring broader access may choose multi-user or enterprise licenses for cost-effective access to the report.
13. Are there any additional resources or data provided in the Dates Market report?
While the report offers comprehensive insights, it's advisable to review the specific contents or supplementary materials provided to ascertain if additional resources or data are available.
14. How can I stay updated on further developments or reports in the Dates Market?
To stay informed about further developments, trends, and reports in the Dates Market, consider subscribing to industry newsletters, following relevant companies and organizations, or regularly checking reputable industry news sources and publications.
Methodology
Step 1 - Identification of Relevant Samples Size from Population Database


Step 2 - Approaches for Defining Global Market Size (Value, Volume* & Price*)

Note*: In applicable scenarios
Step 3 - Data Sources
Primary Research
- Web Analytics
- Survey Reports
- Research Institute
- Latest Research Reports
- Opinion Leaders
Secondary Research
- Annual Reports
- White Paper
- Latest Press Release
- Industry Association
- Paid Database
- Investor Presentations

Step 4 - Data Triangulation
Involves using different sources of information in order to increase the validity of a study
These sources are likely to be stakeholders in a program - participants, other researchers, program staff, other community members, and so on.
Then we put all data in single framework & apply various statistical tools to find out the dynamic on the market.
During the analysis stage, feedback from the stakeholder groups would be compared to determine areas of agreement as well as areas of divergence