

Key Insights
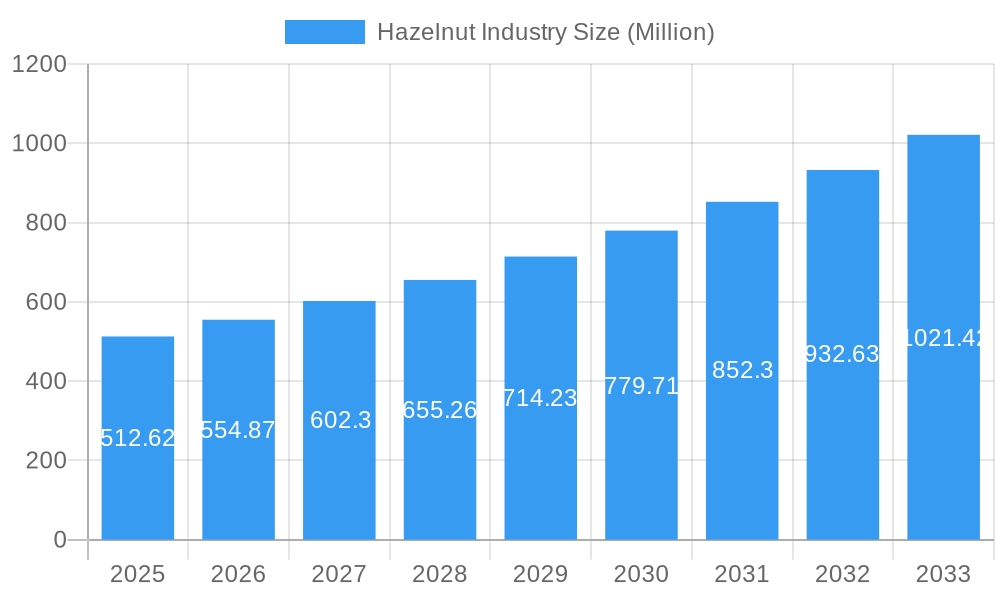
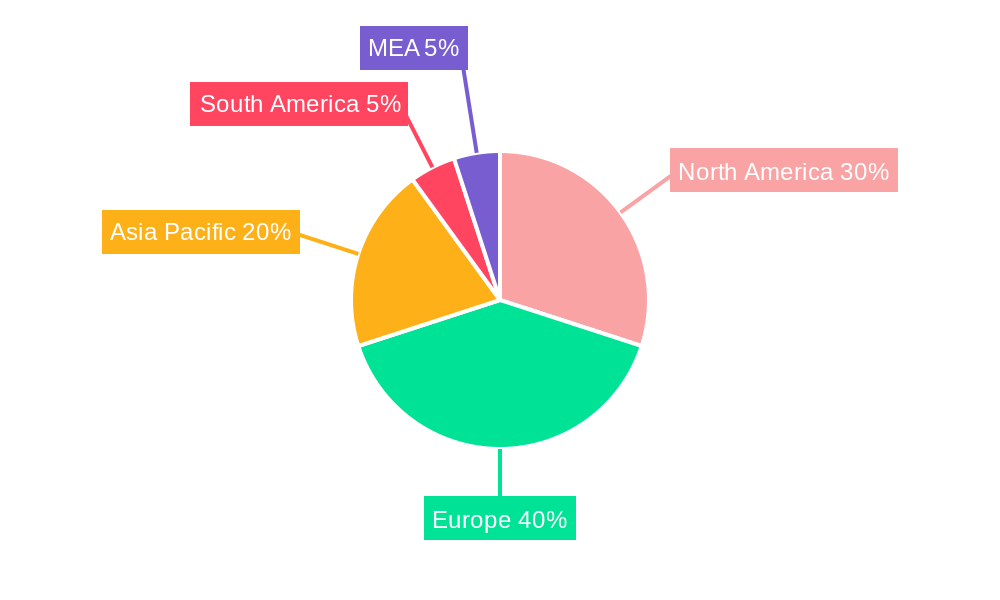
The global hazelnut market, valued at $512.62 million in 2025, is projected to experience robust growth, driven by increasing consumer demand for healthy snacks and the versatility of hazelnuts in various food applications. The market's Compound Annual Growth Rate (CAGR) of 8.10% from 2025 to 2033 signifies a substantial expansion opportunity. Key drivers include the rising popularity of hazelnut-based confectionery, bakery products, and beverages, fueled by evolving consumer preferences for natural and nutritious ingredients. The growing awareness of hazelnuts' health benefits, such as high vitamin E content and antioxidants, further bolsters market growth. Significant regional markets include North America and Europe, with strong potential for expansion in Asia-Pacific, driven by rising disposable incomes and changing dietary habits. However, factors like price volatility due to fluctuating harvests and potential competition from substitute products could pose challenges to sustained growth. The segmentation by product type (natural, roasted, chopped, paste, oil) and application (food & beverage, confectionery, bakery, other) highlights diversified market opportunities. Leading players like Ferrero, Mondelez International, and others are strategically investing in product innovation and expansion into new markets to capitalize on this growth trajectory.
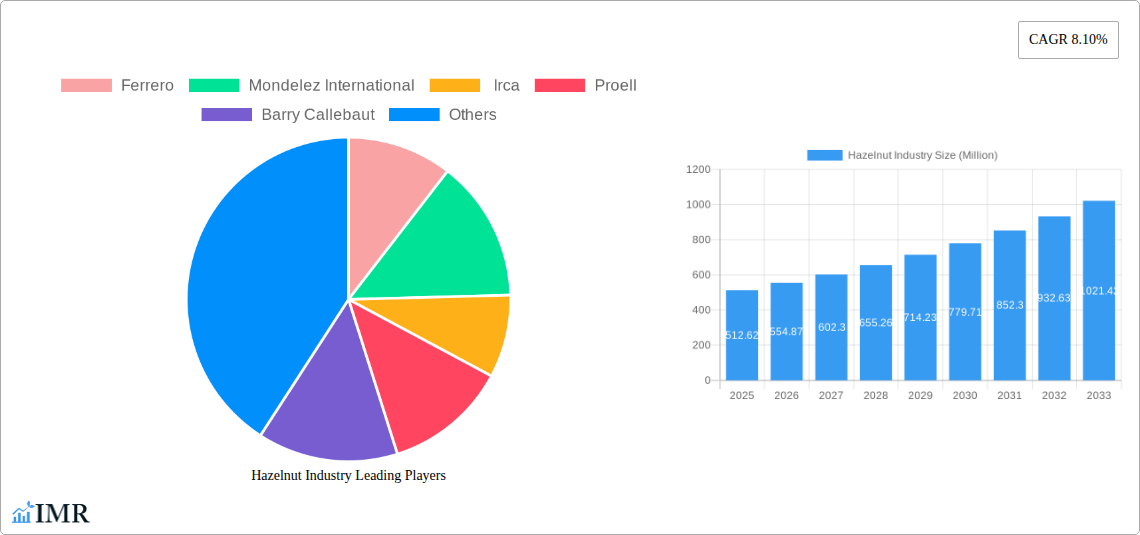
Hazelnut Industry Market Size (In Million)
The segmentation analysis reveals that the food and beverage sector dominates the application segment, while roasted hazelnuts represent a significant portion of the product type segment. Future growth will be significantly influenced by product innovation, particularly in value-added hazelnut products like spreads and specialty oils. The expansion into emerging markets presents a substantial opportunity for growth, demanding tailored product development and marketing strategies to align with local consumer preferences. Furthermore, sustainable sourcing practices and supply chain transparency are becoming increasingly important for hazelnut producers, influencing consumer choices and driving industry standards. The market is expected to witness further consolidation through mergers and acquisitions as major players compete for market share and seek vertical integration within the supply chain.
Hazelnut Industry Company Market Share
Hazelnut Industry Market Report: 2019-2033
This comprehensive report provides an in-depth analysis of the global hazelnut industry, encompassing market dynamics, growth trends, regional dominance, product landscape, challenges, opportunities, and key players. The report covers the historical period (2019-2024), base year (2025), and forecast period (2025-2033), offering valuable insights for industry professionals, investors, and strategists. Market values are presented in millions of units.
Keywords: Hazelnut market, hazelnut industry, hazelnut paste, hazelnut oil, roasted hazelnuts, chopped hazelnuts, natural hazelnuts, confectionery, bakery, food and beverage, Ferrero, Mondelez International, Irca, Proell, Barry Callebaut, market size, market share, CAGR, market growth, industry trends, M&A, supply chain.
Hazelnut Industry Market Dynamics & Structure
The global hazelnut market is characterized by moderate concentration, with key players like Ferrero, Mondelez International, and Barry Callebaut holding significant market share. Technological advancements in processing and automation are driving efficiency gains, while regulatory frameworks concerning food safety and labeling influence market practices. Substitutes, such as other nuts or seed-based alternatives, pose a competitive threat. The industry is witnessing increasing consolidation through M&A activity, driven by the desire for vertical integration and enhanced supply chain control. End-user demographics, particularly growing demand from health-conscious consumers and expanding confectionery markets, are key market drivers.
- Market Concentration: Highly concentrated, with top 5 players accounting for xx% of market share in 2025.
- Technological Innovation: Focus on automation, improved processing techniques, and waste reduction.
- Regulatory Landscape: Stringent food safety and labeling regulations impacting production and trade.
- Competitive Substitutes: Almonds, cashews, and other nuts present competitive challenges.
- M&A Activity: xx major M&A deals completed between 2019-2024, totaling an estimated value of xx million.
- End-User Demographics: Growing demand from health-conscious consumers and expanding global confectionery market.
Hazelnut Industry Growth Trends & Insights
The global hazelnut market exhibited a CAGR of xx% during 2019-2024 and is projected to maintain a CAGR of xx% from 2025 to 2033, driven by increasing consumer preference for healthier snacks, the rise of the confectionery industry, and expanding application in various food and beverage products. Technological disruptions, such as improved harvesting techniques and efficient processing methods, have contributed to increased production and improved product quality. Consumer behavior shifts towards convenient, ready-to-eat snacks are further bolstering market growth. Market penetration in emerging economies remains relatively low, presenting significant opportunities for future expansion. The market size in 2025 is estimated at xx million, and is expected to reach xx million by 2033.
Dominant Regions, Countries, or Segments in Hazelnut Industry
Turkey and Italy remain dominant hazelnut producing regions, primarily due to favorable climatic conditions and established cultivation practices. Within product types, natural hazelnuts command the largest market share, followed by roasted and chopped hazelnuts. The confectionery segment holds the most significant share in application, while the food and beverage and bakery segments are exhibiting robust growth.
- Leading Region: Turkey and Italy account for xx% of global hazelnut production in 2025.
- Key Drivers in Turkey: Established cultivation practices, favorable climate, government support for the agricultural sector.
- Key Drivers in Italy: Long-standing tradition of hazelnut cultivation, sophisticated processing infrastructure, high-quality hazelnut production.
- Dominant Product Type: Natural hazelnuts hold the largest market share (xx%) due to wider applications and processing flexibility.
- Dominant Application: Confectionery segment leads due to high hazelnut demand in chocolate and other confectionery products.
Hazelnut Industry Product Landscape
The hazelnut industry offers a diverse product range, including natural, roasted, and chopped hazelnuts, as well as value-added products like hazelnut paste and hazelnut oil. Recent innovations focus on sustainable cultivation practices, improved processing technologies to enhance flavor and texture, and extended shelf life. Unique selling propositions encompass organic certification, traceability, and specific flavor profiles tailored to different applications. Technological advancements in extraction methods are improving the quality and yield of hazelnut oil.
Key Drivers, Barriers & Challenges in Hazelnut Industry
Key Drivers: Growing consumer demand for healthy snacks, increasing popularity of hazelnut-based products in confectionery and bakery, expansion of the food and beverage industry, and continuous innovations in product development.
Challenges: Price volatility due to weather patterns affecting harvests, increasing production costs, and maintaining consistent product quality. Supply chain disruptions and regulatory complexities related to food safety and traceability pose significant barriers. Competition from other nut varieties and the potential impact of climate change on hazelnut yields also pose significant challenges. The impact of these challenges is estimated to reduce market growth by xx% in the next 5 years.
Emerging Opportunities in Hazelnut Industry
Untapped markets in Asia and Africa represent significant growth opportunities, as does the development of novel hazelnut-based products targeting specific health and wellness trends. The rising popularity of plant-based alternatives presents opportunities for hazelnut-based ingredients in vegan and vegetarian products. Exploring innovative applications in cosmetics and personal care products could unlock new market segments.
Growth Accelerators in the Hazelnut Industry
Technological breakthroughs in precision agriculture and automation can significantly enhance production efficiency and yield. Strategic partnerships between producers, processors, and retailers can optimize the supply chain and improve market access. Expansion into new geographical markets and innovative product development are crucial for long-term growth.
Key Players Shaping the Hazelnut Industry Market
- Ferrero
- Mondelez International
- Irca
- Proell
- Barry Callebaut
Notable Milestones in Hazelnut Industry Sector
- 2021: Introduction of a new hazelnut processing technology by a leading producer, resulting in improved efficiency and reduced waste.
- 2022: A major merger between two hazelnut processing companies leading to increased market share.
- 2023: Launch of a new line of organic hazelnuts by a leading brand, targeting the growing health-conscious consumer segment.
In-Depth Hazelnut Industry Market Outlook
The hazelnut industry is poised for continued growth, driven by strong consumer demand, technological advancements, and expansion into new markets. Strategic investments in sustainable agriculture, efficient processing, and innovative product development will be crucial for success. The market’s potential for expansion, particularly in emerging economies and novel applications, presents significant opportunities for established players and new entrants alike. The projected market value of xx million by 2033 highlights the strong long-term growth potential of this sector.
Hazelnut Industry Segmentation
- 1. Production Analysis
- 2. Consumption Analysis
- 3. Import Market Analysis (Value & Volume)
- 4. Export Market Analysis (Value & Volume)
- 5. Price Trend Analysis
Hazelnut Industry Segmentation By Geography
-
1. North America
- 1.1. United States
- 1.2. Canada
- 1.3. Mexico
-
2. Europe
- 2.1. Germany
- 2.2. United Kingdom
- 2.3. France
- 2.4. Italy
- 2.5. Austria
- 2.6. Netherlands
- 2.7. Spain
-
3. Asia Pacific
- 3.1. China
- 3.2. Australia
- 3.3. India
- 3.4. Japan
-
4. South America
- 4.1. Brazil
- 4.2. Argentina
-
5. Middle East and Africa
- 5.1. Turkey
- 5.2. South Africa
Hazelnut Industry Regional Market Share
Geographic Coverage of Hazelnut Industry
Hazelnut Industry REPORT HIGHLIGHTS
| Aspects | Details |
|---|---|
| Study Period | 2020-2034 |
| Base Year | 2025 |
| Estimated Year | 2026 |
| Forecast Period | 2026-2034 |
| Historical Period | 2020-2025 |
| Growth Rate | CAGR of 8.10% from 2020-2034 |
| Segmentation |
|
Table of Contents
- 1. Introduction
- 1.1. Research Scope
- 1.2. Market Segmentation
- 1.3. Research Objective
- 1.4. Definitions and Assumptions
- 2. Executive Summary
- 2.1. Market Snapshot
- 3. Market Dynamics
- 3.1. Market Drivers
- 3.2. Market Restrains
- 3.3. Market Trends
- 3.4. Market Opportunities
- 4. Market Factor Analysis
- 4.1. Porters Five Forces
- 4.1.1. Bargaining Power of Suppliers
- 4.1.2. Bargaining Power of Buyers
- 4.1.3. Threat of New Entrants
- 4.1.4. Threat of Substitutes
- 4.1.5. Competitive Rivalry
- 4.2. PESTEL analysis
- 4.3. BCG Analysis
- 4.3.1. Stars (High Growth, High Market Share)
- 4.3.2. Cash Cows (Low Growth, High Market Share)
- 4.3.3. Question Mark (High Growth, Low Market Share)
- 4.3.4. Dogs (Low Growth, Low Market Share)
- 4.4. Ansoff Matrix Analysis
- 4.5. Supply Chain Analysis
- 4.6. Regulatory Landscape
- 4.7. Current Market Potential and Opportunity Assessment (TAM–SAM–SOM Framework)
- 4.8. IMR Analyst Note
- 4.1. Porters Five Forces
- 5. Market Analysis, Insights and Forecast 2021-2033
- 5.1. Market Analysis, Insights and Forecast - by Production Analysis
- 5.2. Market Analysis, Insights and Forecast - by Consumption Analysis
- 5.3. Market Analysis, Insights and Forecast - by Import Market Analysis (Value & Volume)
- 5.4. Market Analysis, Insights and Forecast - by Export Market Analysis (Value & Volume)
- 5.5. Market Analysis, Insights and Forecast - by Price Trend Analysis
- 5.6. Market Analysis, Insights and Forecast - by Region
- 5.6.1. North America
- 5.6.2. Europe
- 5.6.3. Asia Pacific
- 5.6.4. South America
- 5.6.5. Middle East and Africa
- 6. Global Hazelnut Industry Analysis, Insights and Forecast, 2021-2033
- 6.1. Market Analysis, Insights and Forecast - by Production Analysis
- 6.2. Market Analysis, Insights and Forecast - by Consumption Analysis
- 6.3. Market Analysis, Insights and Forecast - by Import Market Analysis (Value & Volume)
- 6.4. Market Analysis, Insights and Forecast - by Export Market Analysis (Value & Volume)
- 6.5. Market Analysis, Insights and Forecast - by Price Trend Analysis
- 7. North America Hazelnut Industry Analysis, Insights and Forecast, 2020-2032
- 7.1. Market Analysis, Insights and Forecast - by Production Analysis
- 7.2. Market Analysis, Insights and Forecast - by Consumption Analysis
- 7.3. Market Analysis, Insights and Forecast - by Import Market Analysis (Value & Volume)
- 7.4. Market Analysis, Insights and Forecast - by Export Market Analysis (Value & Volume)
- 7.5. Market Analysis, Insights and Forecast - by Price Trend Analysis
- 8. Europe Hazelnut Industry Analysis, Insights and Forecast, 2020-2032
- 8.1. Market Analysis, Insights and Forecast - by Production Analysis
- 8.2. Market Analysis, Insights and Forecast - by Consumption Analysis
- 8.3. Market Analysis, Insights and Forecast - by Import Market Analysis (Value & Volume)
- 8.4. Market Analysis, Insights and Forecast - by Export Market Analysis (Value & Volume)
- 8.5. Market Analysis, Insights and Forecast - by Price Trend Analysis
- 9. Asia Pacific Hazelnut Industry Analysis, Insights and Forecast, 2020-2032
- 9.1. Market Analysis, Insights and Forecast - by Production Analysis
- 9.2. Market Analysis, Insights and Forecast - by Consumption Analysis
- 9.3. Market Analysis, Insights and Forecast - by Import Market Analysis (Value & Volume)
- 9.4. Market Analysis, Insights and Forecast - by Export Market Analysis (Value & Volume)
- 9.5. Market Analysis, Insights and Forecast - by Price Trend Analysis
- 10. South America Hazelnut Industry Analysis, Insights and Forecast, 2020-2032
- 10.1. Market Analysis, Insights and Forecast - by Production Analysis
- 10.2. Market Analysis, Insights and Forecast - by Consumption Analysis
- 10.3. Market Analysis, Insights and Forecast - by Import Market Analysis (Value & Volume)
- 10.4. Market Analysis, Insights and Forecast - by Export Market Analysis (Value & Volume)
- 10.5. Market Analysis, Insights and Forecast - by Price Trend Analysis
- 11. Middle East and Africa Hazelnut Industry Analysis, Insights and Forecast, 2020-2032
- 11.1. Market Analysis, Insights and Forecast - by Production Analysis
- 11.2. Market Analysis, Insights and Forecast - by Consumption Analysis
- 11.3. Market Analysis, Insights and Forecast - by Import Market Analysis (Value & Volume)
- 11.4. Market Analysis, Insights and Forecast - by Export Market Analysis (Value & Volume)
- 11.5. Market Analysis, Insights and Forecast - by Price Trend Analysis
- 12. Competitive Analysis
- 12.1. Company Profiles
- 12.1.1 Ferrero
- 12.1.1.1. Company Overview
- 12.1.1.2. Products
- 12.1.1.3. Company Financials
- 12.1.1.4. SWOT Analysis
- 12.1.2 Mondelez International
- 12.1.2.1. Company Overview
- 12.1.2.2. Products
- 12.1.2.3. Company Financials
- 12.1.2.4. SWOT Analysis
- 12.1.3 Irca
- 12.1.3.1. Company Overview
- 12.1.3.2. Products
- 12.1.3.3. Company Financials
- 12.1.3.4. SWOT Analysis
- 12.1.4 Proell
- 12.1.4.1. Company Overview
- 12.1.4.2. Products
- 12.1.4.3. Company Financials
- 12.1.4.4. SWOT Analysis
- 12.1.5 Barry Callebaut
- 12.1.5.1. Company Overview
- 12.1.5.2. Products
- 12.1.5.3. Company Financials
- 12.1.5.4. SWOT Analysis
- 12.1.1 Ferrero
- 12.2. Market Entropy
- 12.2.1 Company's Key Areas Served
- 12.2.2 Recent Developments
- 12.3. Company Market Share Analysis 2025
- 12.3.1 Top 5 Companies Market Share Analysis
- 12.3.2 Top 3 Companies Market Share Analysis
- 12.4. List of Potential Customers
- 13. Research Methodology
List of Figures
- Figure 1: Global Hazelnut Industry Revenue Breakdown (Million, %) by Region 2025 & 2033
- Figure 2: North America Hazelnut Industry Revenue (Million), by Production Analysis 2025 & 2033
- Figure 3: North America Hazelnut Industry Revenue Share (%), by Production Analysis 2025 & 2033
- Figure 4: North America Hazelnut Industry Revenue (Million), by Consumption Analysis 2025 & 2033
- Figure 5: North America Hazelnut Industry Revenue Share (%), by Consumption Analysis 2025 & 2033
- Figure 6: North America Hazelnut Industry Revenue (Million), by Import Market Analysis (Value & Volume) 2025 & 2033
- Figure 7: North America Hazelnut Industry Revenue Share (%), by Import Market Analysis (Value & Volume) 2025 & 2033
- Figure 8: North America Hazelnut Industry Revenue (Million), by Export Market Analysis (Value & Volume) 2025 & 2033
- Figure 9: North America Hazelnut Industry Revenue Share (%), by Export Market Analysis (Value & Volume) 2025 & 2033
- Figure 10: North America Hazelnut Industry Revenue (Million), by Price Trend Analysis 2025 & 2033
- Figure 11: North America Hazelnut Industry Revenue Share (%), by Price Trend Analysis 2025 & 2033
- Figure 12: North America Hazelnut Industry Revenue (Million), by Country 2025 & 2033
- Figure 13: North America Hazelnut Industry Revenue Share (%), by Country 2025 & 2033
- Figure 14: Europe Hazelnut Industry Revenue (Million), by Production Analysis 2025 & 2033
- Figure 15: Europe Hazelnut Industry Revenue Share (%), by Production Analysis 2025 & 2033
- Figure 16: Europe Hazelnut Industry Revenue (Million), by Consumption Analysis 2025 & 2033
- Figure 17: Europe Hazelnut Industry Revenue Share (%), by Consumption Analysis 2025 & 2033
- Figure 18: Europe Hazelnut Industry Revenue (Million), by Import Market Analysis (Value & Volume) 2025 & 2033
- Figure 19: Europe Hazelnut Industry Revenue Share (%), by Import Market Analysis (Value & Volume) 2025 & 2033
- Figure 20: Europe Hazelnut Industry Revenue (Million), by Export Market Analysis (Value & Volume) 2025 & 2033
- Figure 21: Europe Hazelnut Industry Revenue Share (%), by Export Market Analysis (Value & Volume) 2025 & 2033
- Figure 22: Europe Hazelnut Industry Revenue (Million), by Price Trend Analysis 2025 & 2033
- Figure 23: Europe Hazelnut Industry Revenue Share (%), by Price Trend Analysis 2025 & 2033
- Figure 24: Europe Hazelnut Industry Revenue (Million), by Country 2025 & 2033
- Figure 25: Europe Hazelnut Industry Revenue Share (%), by Country 2025 & 2033
- Figure 26: Asia Pacific Hazelnut Industry Revenue (Million), by Production Analysis 2025 & 2033
- Figure 27: Asia Pacific Hazelnut Industry Revenue Share (%), by Production Analysis 2025 & 2033
- Figure 28: Asia Pacific Hazelnut Industry Revenue (Million), by Consumption Analysis 2025 & 2033
- Figure 29: Asia Pacific Hazelnut Industry Revenue Share (%), by Consumption Analysis 2025 & 2033
- Figure 30: Asia Pacific Hazelnut Industry Revenue (Million), by Import Market Analysis (Value & Volume) 2025 & 2033
- Figure 31: Asia Pacific Hazelnut Industry Revenue Share (%), by Import Market Analysis (Value & Volume) 2025 & 2033
- Figure 32: Asia Pacific Hazelnut Industry Revenue (Million), by Export Market Analysis (Value & Volume) 2025 & 2033
- Figure 33: Asia Pacific Hazelnut Industry Revenue Share (%), by Export Market Analysis (Value & Volume) 2025 & 2033
- Figure 34: Asia Pacific Hazelnut Industry Revenue (Million), by Price Trend Analysis 2025 & 2033
- Figure 35: Asia Pacific Hazelnut Industry Revenue Share (%), by Price Trend Analysis 2025 & 2033
- Figure 36: Asia Pacific Hazelnut Industry Revenue (Million), by Country 2025 & 2033
- Figure 37: Asia Pacific Hazelnut Industry Revenue Share (%), by Country 2025 & 2033
- Figure 38: South America Hazelnut Industry Revenue (Million), by Production Analysis 2025 & 2033
- Figure 39: South America Hazelnut Industry Revenue Share (%), by Production Analysis 2025 & 2033
- Figure 40: South America Hazelnut Industry Revenue (Million), by Consumption Analysis 2025 & 2033
- Figure 41: South America Hazelnut Industry Revenue Share (%), by Consumption Analysis 2025 & 2033
- Figure 42: South America Hazelnut Industry Revenue (Million), by Import Market Analysis (Value & Volume) 2025 & 2033
- Figure 43: South America Hazelnut Industry Revenue Share (%), by Import Market Analysis (Value & Volume) 2025 & 2033
- Figure 44: South America Hazelnut Industry Revenue (Million), by Export Market Analysis (Value & Volume) 2025 & 2033
- Figure 45: South America Hazelnut Industry Revenue Share (%), by Export Market Analysis (Value & Volume) 2025 & 2033
- Figure 46: South America Hazelnut Industry Revenue (Million), by Price Trend Analysis 2025 & 2033
- Figure 47: South America Hazelnut Industry Revenue Share (%), by Price Trend Analysis 2025 & 2033
- Figure 48: South America Hazelnut Industry Revenue (Million), by Country 2025 & 2033
- Figure 49: South America Hazelnut Industry Revenue Share (%), by Country 2025 & 2033
- Figure 50: Middle East and Africa Hazelnut Industry Revenue (Million), by Production Analysis 2025 & 2033
- Figure 51: Middle East and Africa Hazelnut Industry Revenue Share (%), by Production Analysis 2025 & 2033
- Figure 52: Middle East and Africa Hazelnut Industry Revenue (Million), by Consumption Analysis 2025 & 2033
- Figure 53: Middle East and Africa Hazelnut Industry Revenue Share (%), by Consumption Analysis 2025 & 2033
- Figure 54: Middle East and Africa Hazelnut Industry Revenue (Million), by Import Market Analysis (Value & Volume) 2025 & 2033
- Figure 55: Middle East and Africa Hazelnut Industry Revenue Share (%), by Import Market Analysis (Value & Volume) 2025 & 2033
- Figure 56: Middle East and Africa Hazelnut Industry Revenue (Million), by Export Market Analysis (Value & Volume) 2025 & 2033
- Figure 57: Middle East and Africa Hazelnut Industry Revenue Share (%), by Export Market Analysis (Value & Volume) 2025 & 2033
- Figure 58: Middle East and Africa Hazelnut Industry Revenue (Million), by Price Trend Analysis 2025 & 2033
- Figure 59: Middle East and Africa Hazelnut Industry Revenue Share (%), by Price Trend Analysis 2025 & 2033
- Figure 60: Middle East and Africa Hazelnut Industry Revenue (Million), by Country 2025 & 2033
- Figure 61: Middle East and Africa Hazelnut Industry Revenue Share (%), by Country 2025 & 2033
List of Tables
- Table 1: Global Hazelnut Industry Revenue Million Forecast, by Production Analysis 2020 & 2033
- Table 2: Global Hazelnut Industry Revenue Million Forecast, by Consumption Analysis 2020 & 2033
- Table 3: Global Hazelnut Industry Revenue Million Forecast, by Import Market Analysis (Value & Volume) 2020 & 2033
- Table 4: Global Hazelnut Industry Revenue Million Forecast, by Export Market Analysis (Value & Volume) 2020 & 2033
- Table 5: Global Hazelnut Industry Revenue Million Forecast, by Price Trend Analysis 2020 & 2033
- Table 6: Global Hazelnut Industry Revenue Million Forecast, by Region 2020 & 2033
- Table 7: Global Hazelnut Industry Revenue Million Forecast, by Production Analysis 2020 & 2033
- Table 8: Global Hazelnut Industry Revenue Million Forecast, by Consumption Analysis 2020 & 2033
- Table 9: Global Hazelnut Industry Revenue Million Forecast, by Import Market Analysis (Value & Volume) 2020 & 2033
- Table 10: Global Hazelnut Industry Revenue Million Forecast, by Export Market Analysis (Value & Volume) 2020 & 2033
- Table 11: Global Hazelnut Industry Revenue Million Forecast, by Price Trend Analysis 2020 & 2033
- Table 12: Global Hazelnut Industry Revenue Million Forecast, by Country 2020 & 2033
- Table 13: United States Hazelnut Industry Revenue (Million) Forecast, by Application 2020 & 2033
- Table 14: Canada Hazelnut Industry Revenue (Million) Forecast, by Application 2020 & 2033
- Table 15: Mexico Hazelnut Industry Revenue (Million) Forecast, by Application 2020 & 2033
- Table 16: Global Hazelnut Industry Revenue Million Forecast, by Production Analysis 2020 & 2033
- Table 17: Global Hazelnut Industry Revenue Million Forecast, by Consumption Analysis 2020 & 2033
- Table 18: Global Hazelnut Industry Revenue Million Forecast, by Import Market Analysis (Value & Volume) 2020 & 2033
- Table 19: Global Hazelnut Industry Revenue Million Forecast, by Export Market Analysis (Value & Volume) 2020 & 2033
- Table 20: Global Hazelnut Industry Revenue Million Forecast, by Price Trend Analysis 2020 & 2033
- Table 21: Global Hazelnut Industry Revenue Million Forecast, by Country 2020 & 2033
- Table 22: Germany Hazelnut Industry Revenue (Million) Forecast, by Application 2020 & 2033
- Table 23: United Kingdom Hazelnut Industry Revenue (Million) Forecast, by Application 2020 & 2033
- Table 24: France Hazelnut Industry Revenue (Million) Forecast, by Application 2020 & 2033
- Table 25: Italy Hazelnut Industry Revenue (Million) Forecast, by Application 2020 & 2033
- Table 26: Austria Hazelnut Industry Revenue (Million) Forecast, by Application 2020 & 2033
- Table 27: Netherlands Hazelnut Industry Revenue (Million) Forecast, by Application 2020 & 2033
- Table 28: Spain Hazelnut Industry Revenue (Million) Forecast, by Application 2020 & 2033
- Table 29: Global Hazelnut Industry Revenue Million Forecast, by Production Analysis 2020 & 2033
- Table 30: Global Hazelnut Industry Revenue Million Forecast, by Consumption Analysis 2020 & 2033
- Table 31: Global Hazelnut Industry Revenue Million Forecast, by Import Market Analysis (Value & Volume) 2020 & 2033
- Table 32: Global Hazelnut Industry Revenue Million Forecast, by Export Market Analysis (Value & Volume) 2020 & 2033
- Table 33: Global Hazelnut Industry Revenue Million Forecast, by Price Trend Analysis 2020 & 2033
- Table 34: Global Hazelnut Industry Revenue Million Forecast, by Country 2020 & 2033
- Table 35: China Hazelnut Industry Revenue (Million) Forecast, by Application 2020 & 2033
- Table 36: Australia Hazelnut Industry Revenue (Million) Forecast, by Application 2020 & 2033
- Table 37: India Hazelnut Industry Revenue (Million) Forecast, by Application 2020 & 2033
- Table 38: Japan Hazelnut Industry Revenue (Million) Forecast, by Application 2020 & 2033
- Table 39: Global Hazelnut Industry Revenue Million Forecast, by Production Analysis 2020 & 2033
- Table 40: Global Hazelnut Industry Revenue Million Forecast, by Consumption Analysis 2020 & 2033
- Table 41: Global Hazelnut Industry Revenue Million Forecast, by Import Market Analysis (Value & Volume) 2020 & 2033
- Table 42: Global Hazelnut Industry Revenue Million Forecast, by Export Market Analysis (Value & Volume) 2020 & 2033
- Table 43: Global Hazelnut Industry Revenue Million Forecast, by Price Trend Analysis 2020 & 2033
- Table 44: Global Hazelnut Industry Revenue Million Forecast, by Country 2020 & 2033
- Table 45: Brazil Hazelnut Industry Revenue (Million) Forecast, by Application 2020 & 2033
- Table 46: Argentina Hazelnut Industry Revenue (Million) Forecast, by Application 2020 & 2033
- Table 47: Global Hazelnut Industry Revenue Million Forecast, by Production Analysis 2020 & 2033
- Table 48: Global Hazelnut Industry Revenue Million Forecast, by Consumption Analysis 2020 & 2033
- Table 49: Global Hazelnut Industry Revenue Million Forecast, by Import Market Analysis (Value & Volume) 2020 & 2033
- Table 50: Global Hazelnut Industry Revenue Million Forecast, by Export Market Analysis (Value & Volume) 2020 & 2033
- Table 51: Global Hazelnut Industry Revenue Million Forecast, by Price Trend Analysis 2020 & 2033
- Table 52: Global Hazelnut Industry Revenue Million Forecast, by Country 2020 & 2033
- Table 53: Turkey Hazelnut Industry Revenue (Million) Forecast, by Application 2020 & 2033
- Table 54: South Africa Hazelnut Industry Revenue (Million) Forecast, by Application 2020 & 2033
Frequently Asked Questions
1. What is the projected Compound Annual Growth Rate (CAGR) of the Hazelnut Industry?
The projected CAGR is approximately 8.10%.
2. Which companies are prominent players in the Hazelnut Industry?
Key companies in the market include Ferrero, Mondelez International, Irca, Proell, Barry Callebaut.
3. What are the main segments of the Hazelnut Industry?
The market segments include Production Analysis, Consumption Analysis, Import Market Analysis (Value & Volume), Export Market Analysis (Value & Volume), Price Trend Analysis.
4. Can you provide details about the market size?
The market size is estimated to be USD 512.62 Million as of 2022.
5. What are some drivers contributing to market growth?
Increasing Demand for Garlic Due to Various Uses in Industries; Rising Demad of Organic Garlic; Increasing Government Initiatives.
6. What are the notable trends driving market growth?
High Demand from the Chocolate Industry.
7. Are there any restraints impacting market growth?
Lack of Technical Knowledge of Farmers; Price Fluctuations.
8. Can you provide examples of recent developments in the market?
N/A
9. What pricing options are available for accessing the report?
Pricing options include single-user, multi-user, and enterprise licenses priced at USD 4750, USD 5250, and USD 8750 respectively.
10. Is the market size provided in terms of value or volume?
The market size is provided in terms of value, measured in Million.
11. Are there any specific market keywords associated with the report?
Yes, the market keyword associated with the report is "Hazelnut Industry," which aids in identifying and referencing the specific market segment covered.
12. How do I determine which pricing option suits my needs best?
The pricing options vary based on user requirements and access needs. Individual users may opt for single-user licenses, while businesses requiring broader access may choose multi-user or enterprise licenses for cost-effective access to the report.
13. Are there any additional resources or data provided in the Hazelnut Industry report?
While the report offers comprehensive insights, it's advisable to review the specific contents or supplementary materials provided to ascertain if additional resources or data are available.
14. How can I stay updated on further developments or reports in the Hazelnut Industry?
To stay informed about further developments, trends, and reports in the Hazelnut Industry, consider subscribing to industry newsletters, following relevant companies and organizations, or regularly checking reputable industry news sources and publications.
Methodology
Step 1 - Identification of Relevant Samples Size from Population Database


Step 2 - Approaches for Defining Global Market Size (Value, Volume* & Price*)

Note*: In applicable scenarios
Step 3 - Data Sources
Primary Research
- Web Analytics
- Survey Reports
- Research Institute
- Latest Research Reports
- Opinion Leaders
Secondary Research
- Annual Reports
- White Paper
- Latest Press Release
- Industry Association
- Paid Database
- Investor Presentations

Step 4 - Data Triangulation
Involves using different sources of information in order to increase the validity of a study
These sources are likely to be stakeholders in a program - participants, other researchers, program staff, other community members, and so on.
Then we put all data in single framework & apply various statistical tools to find out the dynamic on the market.
During the analysis stage, feedback from the stakeholder groups would be compared to determine areas of agreement as well as areas of divergence