

Key Insights
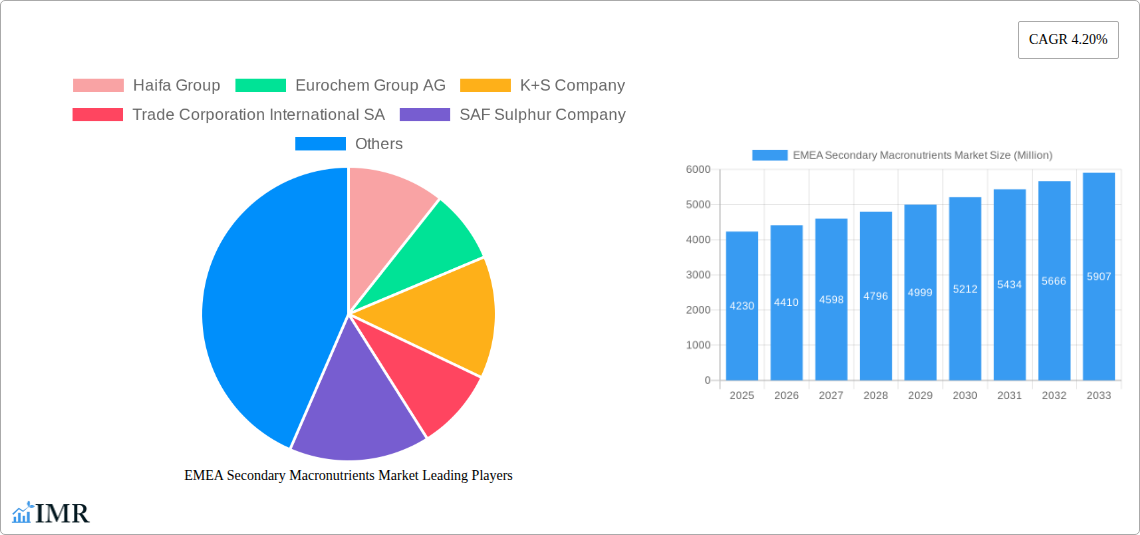
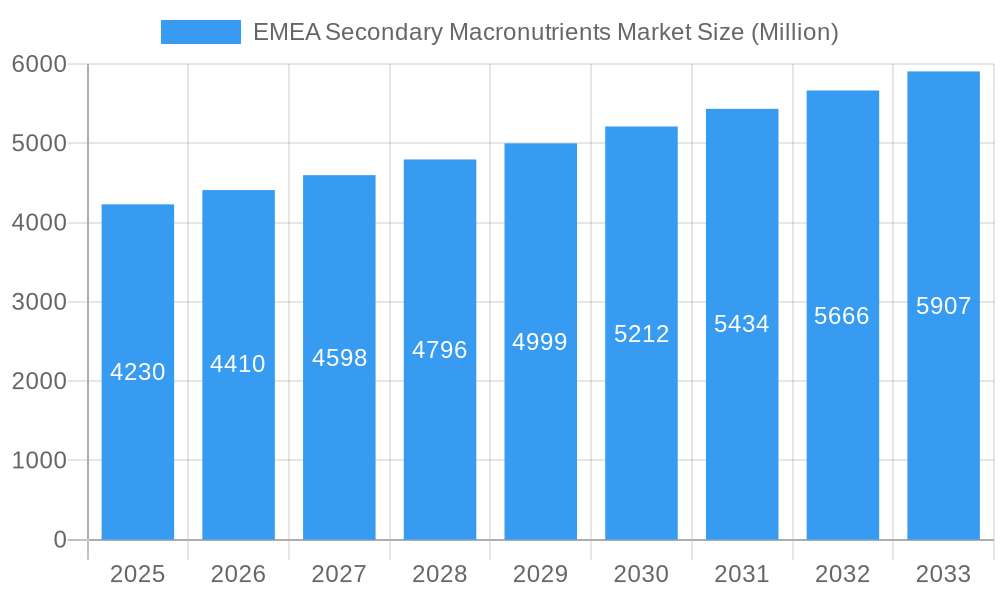
The EMEA Secondary Macronutrients Market, valued at approximately $4.23 billion in 2025, is projected to experience robust growth, driven by the increasing demand for enhanced crop yields and improved soil health across diverse agricultural sectors. This growth is fueled by several factors, including the rising global population leading to increased food demand, the expanding acreage under cultivation particularly in high-growth economies within EMEA, and the growing awareness amongst farmers regarding the crucial role of secondary macronutrients (sulfur, calcium, magnesium) in optimizing crop nutrition. The market's segmental composition reflects this, with grains and cereals likely dominating the crop type segment, followed by pulses and oilseeds, given the substantial agricultural output in the region. Liquid application methods are anticipated to witness faster growth compared to solid application methods due to their ease of use and precise application capabilities. Key players, including Haifa Group, Eurochem Group AG, and K+S Company, are actively investing in research and development to improve product efficacy and expand their market presence. However, potential restraints include price volatility of raw materials, stringent environmental regulations, and the fluctuating global economic landscape.
EMEA Secondary Macronutrients Market Market Size (In Billion)
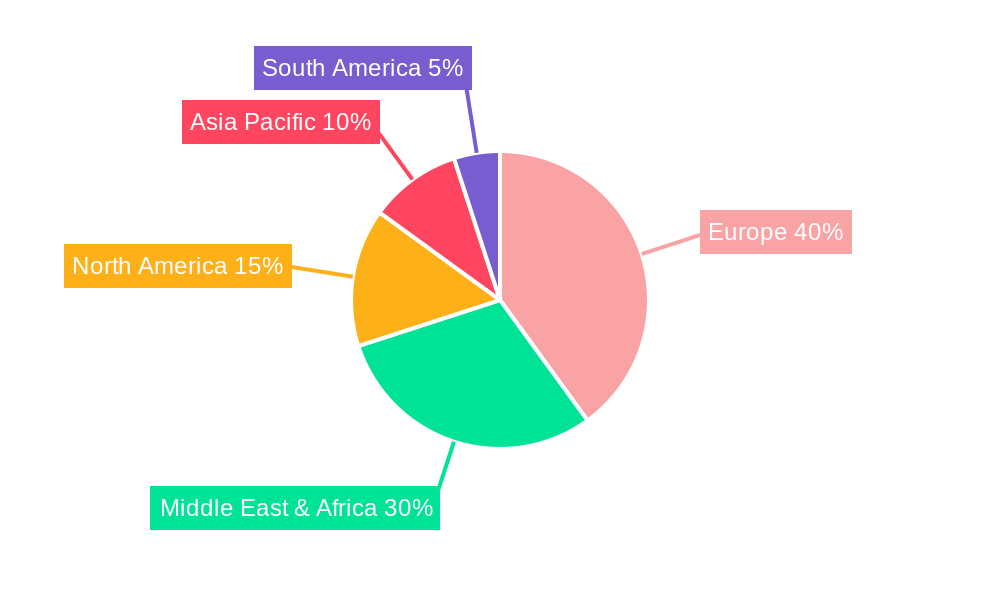
The regional distribution of the EMEA market mirrors the concentration of agricultural activities. Countries like Germany, France, and the UK within Europe, alongside key economies in the Middle East and Africa (e.g., Saudi Arabia, South Africa) are expected to be major contributors to market growth. The predicted CAGR of 4.20% suggests a steady, albeit moderate, expansion over the forecast period (2025-2033). Competitive dynamics within the market are likely to intensify, with companies focusing on strategic partnerships, mergers, and acquisitions to strengthen their position and expand their product portfolios. This involves investments in advanced technologies and sustainable agricultural practices to enhance market competitiveness.
EMEA Secondary Macronutrients Market Company Market Share
This comprehensive report provides a detailed analysis of the EMEA Secondary Macronutrients Market, encompassing market dynamics, growth trends, regional performance, product landscape, key players, and future outlook. The study period covers 2019-2033, with 2025 serving as the base and estimated year. The report is invaluable for industry professionals, investors, and strategic decision-makers seeking a deep understanding of this crucial agricultural input market. The market is segmented by Nutrient Type (Sulfur, Calcium, Magnesium), Application Method (Solid, Liquid), and Crop Type (Grains and Cereals, Pulses and Oilseeds, Fruits and Vegetables, Turfs and Ornamentals, Other Crop Types). The total market value is projected to reach xx Million units by 2033.
EMEA Secondary Macronutrients Market Dynamics & Structure
This section analyzes the competitive landscape, technological advancements, regulatory influences, and market consolidation within the EMEA Secondary Macronutrients market. The report delves into market concentration, revealing the market share held by key players like Haifa Group, Eurochem Group AG, and Yara International ASA. It also explores the impact of mergers and acquisitions (M&A) activities, estimating the volume of deals during the historical period (2019-2024) at approximately xx deals, contributing to a market share shift of approximately xx%.
- Market Concentration: High, with top 5 players holding xx% market share in 2024.
- Technological Innovation: Driven by advancements in formulation and delivery systems, enhancing nutrient efficiency and crop yields. Barriers include high R&D costs and regulatory approvals.
- Regulatory Frameworks: Vary across EMEA countries, influencing product registration, labeling, and environmental compliance. Harmonization efforts are ongoing but fragmented.
- Competitive Product Substitutes: Limited direct substitutes, but competition exists from alternative fertilization strategies and organic farming practices.
- End-User Demographics: Primarily driven by large-scale commercial farming operations, with a growing segment of smaller farms adopting secondary macronutrients.
- M&A Trends: Consolidation is expected to continue, driven by economies of scale and access to new markets and technologies.
EMEA Secondary Macronutrients Market Growth Trends & Insights
This section leverages extensive market research and data analysis to provide a detailed understanding of market size evolution, adoption rates, technological disruptions, and consumer behavior shifts within the EMEA Secondary Macronutrients market. The Compound Annual Growth Rate (CAGR) for the forecast period (2025-2033) is estimated at xx%, driven by increasing crop production, demand for higher yields, and government support for agricultural development. Market penetration for secondary macronutrients is expected to reach xx% by 2033. Detailed analysis of consumer behavior, including adoption patterns and preferences across different crop types and application methods is provided. The impact of changing climatic conditions and sustainable agriculture practices on market growth is also evaluated.
Dominant Regions, Countries, or Segments in EMEA Secondary Macronutrients Market
Western Europe holds the largest market share (xx%), followed by Eastern Europe (xx%) and the Middle East and Africa (xx%). Within nutrient types, Sulfur dominates with xx% market share, driven by its vital role in crop sulfur deficiency mitigation. The liquid application method shows high growth potential. Grains and Cereals remain the largest crop segment. Regional dominance is attributed to factors like higher agricultural productivity, favorable government policies, and well-developed distribution networks. Key drivers in specific regions include:
- Western Europe: High agricultural intensity, strong regulatory framework, and well-established distribution channels.
- Eastern Europe: Growing adoption of modern farming techniques and increasing investments in agricultural infrastructure.
- Middle East and Africa: Expanding irrigated farmland, rising demand for food security, and government initiatives to boost agricultural output.
- Nutrient Type: Sulfur dominates due to widespread soil deficiencies.
- Application Method: Liquid application shows higher growth due to convenience and efficiency.
- Crop Type: Grains and Cereals account for the largest share due to extensive cultivation.
EMEA Secondary Macronutrients Market Product Landscape
The EMEA secondary macronutrient market offers a diverse range of products tailored to specific crop needs and application methods. Innovations focus on improved nutrient bioavailability, controlled-release formulations, and environmentally friendly packaging. Technological advancements include the use of nanotechnology and biostimulants to enhance nutrient uptake and plant growth. Unique selling propositions often center on superior efficacy, ease of application, and minimized environmental impact.
Key Drivers, Barriers & Challenges in EMEA Secondary Macronutrients Market
Key Drivers:
- Increasing demand for food security driving higher crop production.
- Growing awareness of secondary macronutrient deficiencies among farmers.
- Government initiatives promoting sustainable agriculture and efficient fertilizer use.
- Technological advancements in fertilizer formulation and application techniques.
Key Challenges and Restraints:
- Price volatility of raw materials and fluctuating energy costs.
- Stringent environmental regulations and concerns about fertilizer runoff.
- Competition from alternative farming practices and organic farming methods.
- Supply chain disruptions, particularly in transportation and logistics. The impact of these disruptions, estimated at a xx% reduction in market growth in 2022, is highlighted.
Emerging Opportunities in EMEA Secondary Macronutrients Market
Emerging opportunities include:
- Expanding into untapped markets in sub-Saharan Africa.
- Development of specialized formulations for specific crop varieties and soil types.
- Growing demand for organic and bio-based secondary macronutrients.
- Increased focus on precision agriculture technologies for targeted nutrient application.
Growth Accelerators in the EMEA Secondary Macronutrients Market Industry
Long-term growth will be accelerated by technological advancements, strategic partnerships, and market expansion into developing regions. Innovations in controlled-release fertilizers and precision agriculture technologies will drive higher efficiency and reduce environmental impact. Strategic collaborations between fertilizer producers, agricultural technology companies, and research institutions will foster innovation and market expansion.
Key Players Shaping the EMEA Secondary Macronutrients Market Market
- Haifa Group
- Eurochem Group AG
- K+S Company
- Trade Corporation International SA (Note: Using US link as a global representation as the main website is not easily accessible)
- SAF Sulphur Company
- Saudi United Fertilizer Company (al-asmida)
- Al-tayseer Chemical Industry
- Israel Chemical Company
- Takamul National Agriculture
- Yara International ASA
Notable Milestones in EMEA Secondary Macronutrients Market Sector
- 2021, Q3: Haifa Group launches a new line of controlled-release magnesium fertilizers.
- 2022, Q1: Eurochem Group AG acquires a smaller fertilizer producer in Eastern Europe.
- 2023, Q2: New EU regulations on fertilizer labeling come into effect.
In-Depth EMEA Secondary Macronutrients Market Market Outlook
The EMEA secondary macronutrients market is poised for significant growth in the coming years. Continued technological advancements, increasing demand from the agricultural sector, and supportive government policies will drive market expansion. Strategic investments in research and development, coupled with effective marketing and distribution strategies, will play a key role in shaping future market dynamics. The market's future growth will largely depend on addressing the challenges related to price volatility, environmental regulations, and supply chain resilience.
EMEA Secondary Macronutrients Market Segmentation
- 1. Production Analysis
- 2. Consumption Analysis
- 3. Import Market Analysis (Value & Volume)
- 4. Export Market Analysis (Value & Volume)
- 5. Price Trend Analysis
EMEA Secondary Macronutrients Market Segmentation By Geography
-
1. North America
- 1.1. United States
- 1.2. Canada
- 1.3. Mexico
-
2. South America
- 2.1. Brazil
- 2.2. Argentina
- 2.3. Rest of South America
-
3. Europe
- 3.1. United Kingdom
- 3.2. Germany
- 3.3. France
- 3.4. Italy
- 3.5. Spain
- 3.6. Russia
- 3.7. Benelux
- 3.8. Nordics
- 3.9. Rest of Europe
-
4. Middle East & Africa
- 4.1. Turkey
- 4.2. Israel
- 4.3. GCC
- 4.4. North Africa
- 4.5. South Africa
- 4.6. Rest of Middle East & Africa
-
5. Asia Pacific
- 5.1. China
- 5.2. India
- 5.3. Japan
- 5.4. South Korea
- 5.5. ASEAN
- 5.6. Oceania
- 5.7. Rest of Asia Pacific
EMEA Secondary Macronutrients Market Regional Market Share
Geographic Coverage of EMEA Secondary Macronutrients Market
EMEA Secondary Macronutrients Market REPORT HIGHLIGHTS
| Aspects | Details |
|---|---|
| Study Period | 2020-2034 |
| Base Year | 2025 |
| Estimated Year | 2026 |
| Forecast Period | 2026-2034 |
| Historical Period | 2020-2025 |
| Growth Rate | CAGR of 4.20% from 2020-2034 |
| Segmentation |
|
Table of Contents
- 1. Introduction
- 1.1. Research Scope
- 1.2. Market Segmentation
- 1.3. Research Objective
- 1.4. Definitions and Assumptions
- 2. Executive Summary
- 2.1. Market Snapshot
- 3. Market Dynamics
- 3.1. Market Drivers
- 3.2. Market Restrains
- 3.3. Market Trends
- 3.4. Market Opportunities
- 4. Market Factor Analysis
- 4.1. Porters Five Forces
- 4.1.1. Bargaining Power of Suppliers
- 4.1.2. Bargaining Power of Buyers
- 4.1.3. Threat of New Entrants
- 4.1.4. Threat of Substitutes
- 4.1.5. Competitive Rivalry
- 4.2. PESTEL analysis
- 4.3. BCG Analysis
- 4.3.1. Stars (High Growth, High Market Share)
- 4.3.2. Cash Cows (Low Growth, High Market Share)
- 4.3.3. Question Mark (High Growth, Low Market Share)
- 4.3.4. Dogs (Low Growth, Low Market Share)
- 4.4. Ansoff Matrix Analysis
- 4.5. Supply Chain Analysis
- 4.6. Regulatory Landscape
- 4.7. Current Market Potential and Opportunity Assessment (TAM–SAM–SOM Framework)
- 4.8. IMR Analyst Note
- 4.1. Porters Five Forces
- 5. Market Analysis, Insights and Forecast 2021-2033
- 5.1. Market Analysis, Insights and Forecast - by Production Analysis
- 5.2. Market Analysis, Insights and Forecast - by Consumption Analysis
- 5.3. Market Analysis, Insights and Forecast - by Import Market Analysis (Value & Volume)
- 5.4. Market Analysis, Insights and Forecast - by Export Market Analysis (Value & Volume)
- 5.5. Market Analysis, Insights and Forecast - by Price Trend Analysis
- 5.6. Market Analysis, Insights and Forecast - by Region
- 5.6.1. North America
- 5.6.2. South America
- 5.6.3. Europe
- 5.6.4. Middle East & Africa
- 5.6.5. Asia Pacific
- 6. Global EMEA Secondary Macronutrients Market Analysis, Insights and Forecast, 2021-2033
- 6.1. Market Analysis, Insights and Forecast - by Production Analysis
- 6.2. Market Analysis, Insights and Forecast - by Consumption Analysis
- 6.3. Market Analysis, Insights and Forecast - by Import Market Analysis (Value & Volume)
- 6.4. Market Analysis, Insights and Forecast - by Export Market Analysis (Value & Volume)
- 6.5. Market Analysis, Insights and Forecast - by Price Trend Analysis
- 7. North America EMEA Secondary Macronutrients Market Analysis, Insights and Forecast, 2020-2032
- 7.1. Market Analysis, Insights and Forecast - by Production Analysis
- 7.2. Market Analysis, Insights and Forecast - by Consumption Analysis
- 7.3. Market Analysis, Insights and Forecast - by Import Market Analysis (Value & Volume)
- 7.4. Market Analysis, Insights and Forecast - by Export Market Analysis (Value & Volume)
- 7.5. Market Analysis, Insights and Forecast - by Price Trend Analysis
- 8. South America EMEA Secondary Macronutrients Market Analysis, Insights and Forecast, 2020-2032
- 8.1. Market Analysis, Insights and Forecast - by Production Analysis
- 8.2. Market Analysis, Insights and Forecast - by Consumption Analysis
- 8.3. Market Analysis, Insights and Forecast - by Import Market Analysis (Value & Volume)
- 8.4. Market Analysis, Insights and Forecast - by Export Market Analysis (Value & Volume)
- 8.5. Market Analysis, Insights and Forecast - by Price Trend Analysis
- 9. Europe EMEA Secondary Macronutrients Market Analysis, Insights and Forecast, 2020-2032
- 9.1. Market Analysis, Insights and Forecast - by Production Analysis
- 9.2. Market Analysis, Insights and Forecast - by Consumption Analysis
- 9.3. Market Analysis, Insights and Forecast - by Import Market Analysis (Value & Volume)
- 9.4. Market Analysis, Insights and Forecast - by Export Market Analysis (Value & Volume)
- 9.5. Market Analysis, Insights and Forecast - by Price Trend Analysis
- 10. Middle East & Africa EMEA Secondary Macronutrients Market Analysis, Insights and Forecast, 2020-2032
- 10.1. Market Analysis, Insights and Forecast - by Production Analysis
- 10.2. Market Analysis, Insights and Forecast - by Consumption Analysis
- 10.3. Market Analysis, Insights and Forecast - by Import Market Analysis (Value & Volume)
- 10.4. Market Analysis, Insights and Forecast - by Export Market Analysis (Value & Volume)
- 10.5. Market Analysis, Insights and Forecast - by Price Trend Analysis
- 11. Asia Pacific EMEA Secondary Macronutrients Market Analysis, Insights and Forecast, 2020-2032
- 11.1. Market Analysis, Insights and Forecast - by Production Analysis
- 11.2. Market Analysis, Insights and Forecast - by Consumption Analysis
- 11.3. Market Analysis, Insights and Forecast - by Import Market Analysis (Value & Volume)
- 11.4. Market Analysis, Insights and Forecast - by Export Market Analysis (Value & Volume)
- 11.5. Market Analysis, Insights and Forecast - by Price Trend Analysis
- 12. Competitive Analysis
- 12.1. Company Profiles
- 12.1.1 Haifa Group
- 12.1.1.1. Company Overview
- 12.1.1.2. Products
- 12.1.1.3. Company Financials
- 12.1.1.4. SWOT Analysis
- 12.1.2 Eurochem Group AG
- 12.1.2.1. Company Overview
- 12.1.2.2. Products
- 12.1.2.3. Company Financials
- 12.1.2.4. SWOT Analysis
- 12.1.3 K+S Company
- 12.1.3.1. Company Overview
- 12.1.3.2. Products
- 12.1.3.3. Company Financials
- 12.1.3.4. SWOT Analysis
- 12.1.4 Trade Corporation International SA
- 12.1.4.1. Company Overview
- 12.1.4.2. Products
- 12.1.4.3. Company Financials
- 12.1.4.4. SWOT Analysis
- 12.1.5 SAF Sulphur Company
- 12.1.5.1. Company Overview
- 12.1.5.2. Products
- 12.1.5.3. Company Financials
- 12.1.5.4. SWOT Analysis
- 12.1.6 Saudi United Fertilizer Company (al-asmida)
- 12.1.6.1. Company Overview
- 12.1.6.2. Products
- 12.1.6.3. Company Financials
- 12.1.6.4. SWOT Analysis
- 12.1.7 Al-tayseer Chemical Industry
- 12.1.7.1. Company Overview
- 12.1.7.2. Products
- 12.1.7.3. Company Financials
- 12.1.7.4. SWOT Analysis
- 12.1.8 Israel Chemical Company
- 12.1.8.1. Company Overview
- 12.1.8.2. Products
- 12.1.8.3. Company Financials
- 12.1.8.4. SWOT Analysis
- 12.1.9 Takamul National Agriculture
- 12.1.9.1. Company Overview
- 12.1.9.2. Products
- 12.1.9.3. Company Financials
- 12.1.9.4. SWOT Analysis
- 12.1.10 Yara International ASA
- 12.1.10.1. Company Overview
- 12.1.10.2. Products
- 12.1.10.3. Company Financials
- 12.1.10.4. SWOT Analysis
- 12.1.1 Haifa Group
- 12.2. Market Entropy
- 12.2.1 Company's Key Areas Served
- 12.2.2 Recent Developments
- 12.3. Company Market Share Analysis 2025
- 12.3.1 Top 5 Companies Market Share Analysis
- 12.3.2 Top 3 Companies Market Share Analysis
- 12.4. List of Potential Customers
- 13. Research Methodology
List of Figures
- Figure 1: Global EMEA Secondary Macronutrients Market Revenue Breakdown (Million, %) by Region 2025 & 2033
- Figure 2: North America EMEA Secondary Macronutrients Market Revenue (Million), by Production Analysis 2025 & 2033
- Figure 3: North America EMEA Secondary Macronutrients Market Revenue Share (%), by Production Analysis 2025 & 2033
- Figure 4: North America EMEA Secondary Macronutrients Market Revenue (Million), by Consumption Analysis 2025 & 2033
- Figure 5: North America EMEA Secondary Macronutrients Market Revenue Share (%), by Consumption Analysis 2025 & 2033
- Figure 6: North America EMEA Secondary Macronutrients Market Revenue (Million), by Import Market Analysis (Value & Volume) 2025 & 2033
- Figure 7: North America EMEA Secondary Macronutrients Market Revenue Share (%), by Import Market Analysis (Value & Volume) 2025 & 2033
- Figure 8: North America EMEA Secondary Macronutrients Market Revenue (Million), by Export Market Analysis (Value & Volume) 2025 & 2033
- Figure 9: North America EMEA Secondary Macronutrients Market Revenue Share (%), by Export Market Analysis (Value & Volume) 2025 & 2033
- Figure 10: North America EMEA Secondary Macronutrients Market Revenue (Million), by Price Trend Analysis 2025 & 2033
- Figure 11: North America EMEA Secondary Macronutrients Market Revenue Share (%), by Price Trend Analysis 2025 & 2033
- Figure 12: North America EMEA Secondary Macronutrients Market Revenue (Million), by Country 2025 & 2033
- Figure 13: North America EMEA Secondary Macronutrients Market Revenue Share (%), by Country 2025 & 2033
- Figure 14: South America EMEA Secondary Macronutrients Market Revenue (Million), by Production Analysis 2025 & 2033
- Figure 15: South America EMEA Secondary Macronutrients Market Revenue Share (%), by Production Analysis 2025 & 2033
- Figure 16: South America EMEA Secondary Macronutrients Market Revenue (Million), by Consumption Analysis 2025 & 2033
- Figure 17: South America EMEA Secondary Macronutrients Market Revenue Share (%), by Consumption Analysis 2025 & 2033
- Figure 18: South America EMEA Secondary Macronutrients Market Revenue (Million), by Import Market Analysis (Value & Volume) 2025 & 2033
- Figure 19: South America EMEA Secondary Macronutrients Market Revenue Share (%), by Import Market Analysis (Value & Volume) 2025 & 2033
- Figure 20: South America EMEA Secondary Macronutrients Market Revenue (Million), by Export Market Analysis (Value & Volume) 2025 & 2033
- Figure 21: South America EMEA Secondary Macronutrients Market Revenue Share (%), by Export Market Analysis (Value & Volume) 2025 & 2033
- Figure 22: South America EMEA Secondary Macronutrients Market Revenue (Million), by Price Trend Analysis 2025 & 2033
- Figure 23: South America EMEA Secondary Macronutrients Market Revenue Share (%), by Price Trend Analysis 2025 & 2033
- Figure 24: South America EMEA Secondary Macronutrients Market Revenue (Million), by Country 2025 & 2033
- Figure 25: South America EMEA Secondary Macronutrients Market Revenue Share (%), by Country 2025 & 2033
- Figure 26: Europe EMEA Secondary Macronutrients Market Revenue (Million), by Production Analysis 2025 & 2033
- Figure 27: Europe EMEA Secondary Macronutrients Market Revenue Share (%), by Production Analysis 2025 & 2033
- Figure 28: Europe EMEA Secondary Macronutrients Market Revenue (Million), by Consumption Analysis 2025 & 2033
- Figure 29: Europe EMEA Secondary Macronutrients Market Revenue Share (%), by Consumption Analysis 2025 & 2033
- Figure 30: Europe EMEA Secondary Macronutrients Market Revenue (Million), by Import Market Analysis (Value & Volume) 2025 & 2033
- Figure 31: Europe EMEA Secondary Macronutrients Market Revenue Share (%), by Import Market Analysis (Value & Volume) 2025 & 2033
- Figure 32: Europe EMEA Secondary Macronutrients Market Revenue (Million), by Export Market Analysis (Value & Volume) 2025 & 2033
- Figure 33: Europe EMEA Secondary Macronutrients Market Revenue Share (%), by Export Market Analysis (Value & Volume) 2025 & 2033
- Figure 34: Europe EMEA Secondary Macronutrients Market Revenue (Million), by Price Trend Analysis 2025 & 2033
- Figure 35: Europe EMEA Secondary Macronutrients Market Revenue Share (%), by Price Trend Analysis 2025 & 2033
- Figure 36: Europe EMEA Secondary Macronutrients Market Revenue (Million), by Country 2025 & 2033
- Figure 37: Europe EMEA Secondary Macronutrients Market Revenue Share (%), by Country 2025 & 2033
- Figure 38: Middle East & Africa EMEA Secondary Macronutrients Market Revenue (Million), by Production Analysis 2025 & 2033
- Figure 39: Middle East & Africa EMEA Secondary Macronutrients Market Revenue Share (%), by Production Analysis 2025 & 2033
- Figure 40: Middle East & Africa EMEA Secondary Macronutrients Market Revenue (Million), by Consumption Analysis 2025 & 2033
- Figure 41: Middle East & Africa EMEA Secondary Macronutrients Market Revenue Share (%), by Consumption Analysis 2025 & 2033
- Figure 42: Middle East & Africa EMEA Secondary Macronutrients Market Revenue (Million), by Import Market Analysis (Value & Volume) 2025 & 2033
- Figure 43: Middle East & Africa EMEA Secondary Macronutrients Market Revenue Share (%), by Import Market Analysis (Value & Volume) 2025 & 2033
- Figure 44: Middle East & Africa EMEA Secondary Macronutrients Market Revenue (Million), by Export Market Analysis (Value & Volume) 2025 & 2033
- Figure 45: Middle East & Africa EMEA Secondary Macronutrients Market Revenue Share (%), by Export Market Analysis (Value & Volume) 2025 & 2033
- Figure 46: Middle East & Africa EMEA Secondary Macronutrients Market Revenue (Million), by Price Trend Analysis 2025 & 2033
- Figure 47: Middle East & Africa EMEA Secondary Macronutrients Market Revenue Share (%), by Price Trend Analysis 2025 & 2033
- Figure 48: Middle East & Africa EMEA Secondary Macronutrients Market Revenue (Million), by Country 2025 & 2033
- Figure 49: Middle East & Africa EMEA Secondary Macronutrients Market Revenue Share (%), by Country 2025 & 2033
- Figure 50: Asia Pacific EMEA Secondary Macronutrients Market Revenue (Million), by Production Analysis 2025 & 2033
- Figure 51: Asia Pacific EMEA Secondary Macronutrients Market Revenue Share (%), by Production Analysis 2025 & 2033
- Figure 52: Asia Pacific EMEA Secondary Macronutrients Market Revenue (Million), by Consumption Analysis 2025 & 2033
- Figure 53: Asia Pacific EMEA Secondary Macronutrients Market Revenue Share (%), by Consumption Analysis 2025 & 2033
- Figure 54: Asia Pacific EMEA Secondary Macronutrients Market Revenue (Million), by Import Market Analysis (Value & Volume) 2025 & 2033
- Figure 55: Asia Pacific EMEA Secondary Macronutrients Market Revenue Share (%), by Import Market Analysis (Value & Volume) 2025 & 2033
- Figure 56: Asia Pacific EMEA Secondary Macronutrients Market Revenue (Million), by Export Market Analysis (Value & Volume) 2025 & 2033
- Figure 57: Asia Pacific EMEA Secondary Macronutrients Market Revenue Share (%), by Export Market Analysis (Value & Volume) 2025 & 2033
- Figure 58: Asia Pacific EMEA Secondary Macronutrients Market Revenue (Million), by Price Trend Analysis 2025 & 2033
- Figure 59: Asia Pacific EMEA Secondary Macronutrients Market Revenue Share (%), by Price Trend Analysis 2025 & 2033
- Figure 60: Asia Pacific EMEA Secondary Macronutrients Market Revenue (Million), by Country 2025 & 2033
- Figure 61: Asia Pacific EMEA Secondary Macronutrients Market Revenue Share (%), by Country 2025 & 2033
List of Tables
- Table 1: Global EMEA Secondary Macronutrients Market Revenue Million Forecast, by Production Analysis 2020 & 2033
- Table 2: Global EMEA Secondary Macronutrients Market Revenue Million Forecast, by Consumption Analysis 2020 & 2033
- Table 3: Global EMEA Secondary Macronutrients Market Revenue Million Forecast, by Import Market Analysis (Value & Volume) 2020 & 2033
- Table 4: Global EMEA Secondary Macronutrients Market Revenue Million Forecast, by Export Market Analysis (Value & Volume) 2020 & 2033
- Table 5: Global EMEA Secondary Macronutrients Market Revenue Million Forecast, by Price Trend Analysis 2020 & 2033
- Table 6: Global EMEA Secondary Macronutrients Market Revenue Million Forecast, by Region 2020 & 2033
- Table 7: Global EMEA Secondary Macronutrients Market Revenue Million Forecast, by Production Analysis 2020 & 2033
- Table 8: Global EMEA Secondary Macronutrients Market Revenue Million Forecast, by Consumption Analysis 2020 & 2033
- Table 9: Global EMEA Secondary Macronutrients Market Revenue Million Forecast, by Import Market Analysis (Value & Volume) 2020 & 2033
- Table 10: Global EMEA Secondary Macronutrients Market Revenue Million Forecast, by Export Market Analysis (Value & Volume) 2020 & 2033
- Table 11: Global EMEA Secondary Macronutrients Market Revenue Million Forecast, by Price Trend Analysis 2020 & 2033
- Table 12: Global EMEA Secondary Macronutrients Market Revenue Million Forecast, by Country 2020 & 2033
- Table 13: United States EMEA Secondary Macronutrients Market Revenue (Million) Forecast, by Application 2020 & 2033
- Table 14: Canada EMEA Secondary Macronutrients Market Revenue (Million) Forecast, by Application 2020 & 2033
- Table 15: Mexico EMEA Secondary Macronutrients Market Revenue (Million) Forecast, by Application 2020 & 2033
- Table 16: Global EMEA Secondary Macronutrients Market Revenue Million Forecast, by Production Analysis 2020 & 2033
- Table 17: Global EMEA Secondary Macronutrients Market Revenue Million Forecast, by Consumption Analysis 2020 & 2033
- Table 18: Global EMEA Secondary Macronutrients Market Revenue Million Forecast, by Import Market Analysis (Value & Volume) 2020 & 2033
- Table 19: Global EMEA Secondary Macronutrients Market Revenue Million Forecast, by Export Market Analysis (Value & Volume) 2020 & 2033
- Table 20: Global EMEA Secondary Macronutrients Market Revenue Million Forecast, by Price Trend Analysis 2020 & 2033
- Table 21: Global EMEA Secondary Macronutrients Market Revenue Million Forecast, by Country 2020 & 2033
- Table 22: Brazil EMEA Secondary Macronutrients Market Revenue (Million) Forecast, by Application 2020 & 2033
- Table 23: Argentina EMEA Secondary Macronutrients Market Revenue (Million) Forecast, by Application 2020 & 2033
- Table 24: Rest of South America EMEA Secondary Macronutrients Market Revenue (Million) Forecast, by Application 2020 & 2033
- Table 25: Global EMEA Secondary Macronutrients Market Revenue Million Forecast, by Production Analysis 2020 & 2033
- Table 26: Global EMEA Secondary Macronutrients Market Revenue Million Forecast, by Consumption Analysis 2020 & 2033
- Table 27: Global EMEA Secondary Macronutrients Market Revenue Million Forecast, by Import Market Analysis (Value & Volume) 2020 & 2033
- Table 28: Global EMEA Secondary Macronutrients Market Revenue Million Forecast, by Export Market Analysis (Value & Volume) 2020 & 2033
- Table 29: Global EMEA Secondary Macronutrients Market Revenue Million Forecast, by Price Trend Analysis 2020 & 2033
- Table 30: Global EMEA Secondary Macronutrients Market Revenue Million Forecast, by Country 2020 & 2033
- Table 31: United Kingdom EMEA Secondary Macronutrients Market Revenue (Million) Forecast, by Application 2020 & 2033
- Table 32: Germany EMEA Secondary Macronutrients Market Revenue (Million) Forecast, by Application 2020 & 2033
- Table 33: France EMEA Secondary Macronutrients Market Revenue (Million) Forecast, by Application 2020 & 2033
- Table 34: Italy EMEA Secondary Macronutrients Market Revenue (Million) Forecast, by Application 2020 & 2033
- Table 35: Spain EMEA Secondary Macronutrients Market Revenue (Million) Forecast, by Application 2020 & 2033
- Table 36: Russia EMEA Secondary Macronutrients Market Revenue (Million) Forecast, by Application 2020 & 2033
- Table 37: Benelux EMEA Secondary Macronutrients Market Revenue (Million) Forecast, by Application 2020 & 2033
- Table 38: Nordics EMEA Secondary Macronutrients Market Revenue (Million) Forecast, by Application 2020 & 2033
- Table 39: Rest of Europe EMEA Secondary Macronutrients Market Revenue (Million) Forecast, by Application 2020 & 2033
- Table 40: Global EMEA Secondary Macronutrients Market Revenue Million Forecast, by Production Analysis 2020 & 2033
- Table 41: Global EMEA Secondary Macronutrients Market Revenue Million Forecast, by Consumption Analysis 2020 & 2033
- Table 42: Global EMEA Secondary Macronutrients Market Revenue Million Forecast, by Import Market Analysis (Value & Volume) 2020 & 2033
- Table 43: Global EMEA Secondary Macronutrients Market Revenue Million Forecast, by Export Market Analysis (Value & Volume) 2020 & 2033
- Table 44: Global EMEA Secondary Macronutrients Market Revenue Million Forecast, by Price Trend Analysis 2020 & 2033
- Table 45: Global EMEA Secondary Macronutrients Market Revenue Million Forecast, by Country 2020 & 2033
- Table 46: Turkey EMEA Secondary Macronutrients Market Revenue (Million) Forecast, by Application 2020 & 2033
- Table 47: Israel EMEA Secondary Macronutrients Market Revenue (Million) Forecast, by Application 2020 & 2033
- Table 48: GCC EMEA Secondary Macronutrients Market Revenue (Million) Forecast, by Application 2020 & 2033
- Table 49: North Africa EMEA Secondary Macronutrients Market Revenue (Million) Forecast, by Application 2020 & 2033
- Table 50: South Africa EMEA Secondary Macronutrients Market Revenue (Million) Forecast, by Application 2020 & 2033
- Table 51: Rest of Middle East & Africa EMEA Secondary Macronutrients Market Revenue (Million) Forecast, by Application 2020 & 2033
- Table 52: Global EMEA Secondary Macronutrients Market Revenue Million Forecast, by Production Analysis 2020 & 2033
- Table 53: Global EMEA Secondary Macronutrients Market Revenue Million Forecast, by Consumption Analysis 2020 & 2033
- Table 54: Global EMEA Secondary Macronutrients Market Revenue Million Forecast, by Import Market Analysis (Value & Volume) 2020 & 2033
- Table 55: Global EMEA Secondary Macronutrients Market Revenue Million Forecast, by Export Market Analysis (Value & Volume) 2020 & 2033
- Table 56: Global EMEA Secondary Macronutrients Market Revenue Million Forecast, by Price Trend Analysis 2020 & 2033
- Table 57: Global EMEA Secondary Macronutrients Market Revenue Million Forecast, by Country 2020 & 2033
- Table 58: China EMEA Secondary Macronutrients Market Revenue (Million) Forecast, by Application 2020 & 2033
- Table 59: India EMEA Secondary Macronutrients Market Revenue (Million) Forecast, by Application 2020 & 2033
- Table 60: Japan EMEA Secondary Macronutrients Market Revenue (Million) Forecast, by Application 2020 & 2033
- Table 61: South Korea EMEA Secondary Macronutrients Market Revenue (Million) Forecast, by Application 2020 & 2033
- Table 62: ASEAN EMEA Secondary Macronutrients Market Revenue (Million) Forecast, by Application 2020 & 2033
- Table 63: Oceania EMEA Secondary Macronutrients Market Revenue (Million) Forecast, by Application 2020 & 2033
- Table 64: Rest of Asia Pacific EMEA Secondary Macronutrients Market Revenue (Million) Forecast, by Application 2020 & 2033
Frequently Asked Questions
1. What is the projected Compound Annual Growth Rate (CAGR) of the EMEA Secondary Macronutrients Market?
The projected CAGR is approximately 4.20%.
2. Which companies are prominent players in the EMEA Secondary Macronutrients Market?
Key companies in the market include Haifa Group, Eurochem Group AG, K+S Company, Trade Corporation International SA, SAF Sulphur Company, Saudi United Fertilizer Company (al-asmida), Al-tayseer Chemical Industry, Israel Chemical Company, Takamul National Agriculture, Yara International ASA.
3. What are the main segments of the EMEA Secondary Macronutrients Market?
The market segments include Production Analysis, Consumption Analysis, Import Market Analysis (Value & Volume), Export Market Analysis (Value & Volume), Price Trend Analysis.
4. Can you provide details about the market size?
The market size is estimated to be USD 4.23 Million as of 2022.
5. What are some drivers contributing to market growth?
Seed Treatment As A Solution To Enhance Yield; Growing Awareness For Seed Treatment Among The Farmers; Rising Trend Of Organic Farming.
6. What are the notable trends driving market growth?
Secondary Macronutrients Ensure Healthy Plant Growth.
7. Are there any restraints impacting market growth?
Limitations Across Farm-Level Seed Treatment; Rising Environmental Concerns.
8. Can you provide examples of recent developments in the market?
N/A
9. What pricing options are available for accessing the report?
Pricing options include single-user, multi-user, and enterprise licenses priced at USD 4750, USD 5250, and USD 8750 respectively.
10. Is the market size provided in terms of value or volume?
The market size is provided in terms of value, measured in Million.
11. Are there any specific market keywords associated with the report?
Yes, the market keyword associated with the report is "EMEA Secondary Macronutrients Market," which aids in identifying and referencing the specific market segment covered.
12. How do I determine which pricing option suits my needs best?
The pricing options vary based on user requirements and access needs. Individual users may opt for single-user licenses, while businesses requiring broader access may choose multi-user or enterprise licenses for cost-effective access to the report.
13. Are there any additional resources or data provided in the EMEA Secondary Macronutrients Market report?
While the report offers comprehensive insights, it's advisable to review the specific contents or supplementary materials provided to ascertain if additional resources or data are available.
14. How can I stay updated on further developments or reports in the EMEA Secondary Macronutrients Market?
To stay informed about further developments, trends, and reports in the EMEA Secondary Macronutrients Market, consider subscribing to industry newsletters, following relevant companies and organizations, or regularly checking reputable industry news sources and publications.
Methodology
Step 1 - Identification of Relevant Samples Size from Population Database


Step 2 - Approaches for Defining Global Market Size (Value, Volume* & Price*)

Note*: In applicable scenarios
Step 3 - Data Sources
Primary Research
- Web Analytics
- Survey Reports
- Research Institute
- Latest Research Reports
- Opinion Leaders
Secondary Research
- Annual Reports
- White Paper
- Latest Press Release
- Industry Association
- Paid Database
- Investor Presentations

Step 4 - Data Triangulation
Involves using different sources of information in order to increase the validity of a study
These sources are likely to be stakeholders in a program - participants, other researchers, program staff, other community members, and so on.
Then we put all data in single framework & apply various statistical tools to find out the dynamic on the market.
During the analysis stage, feedback from the stakeholder groups would be compared to determine areas of agreement as well as areas of divergence