

Key Insights
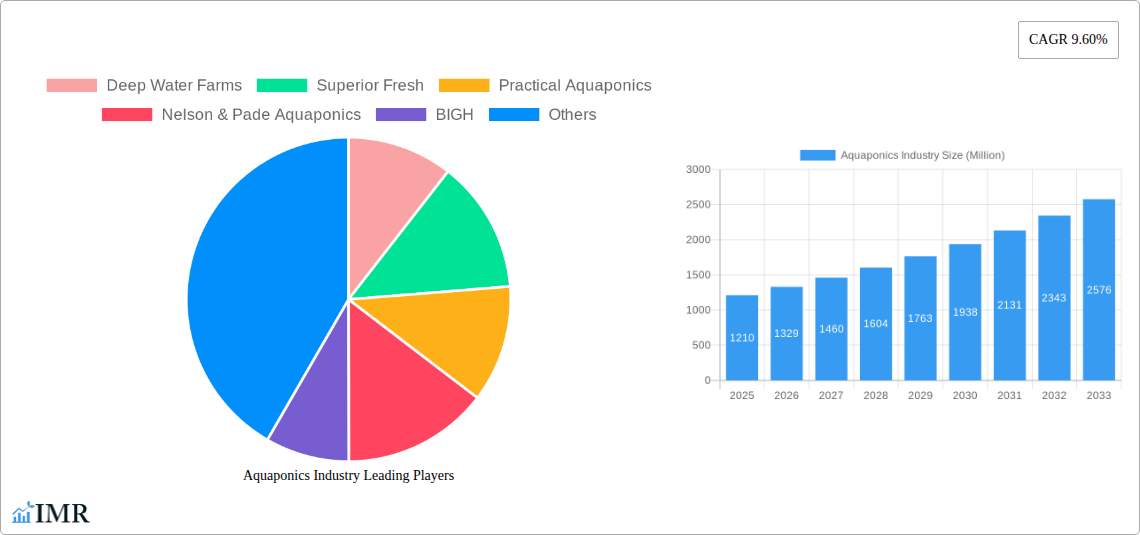
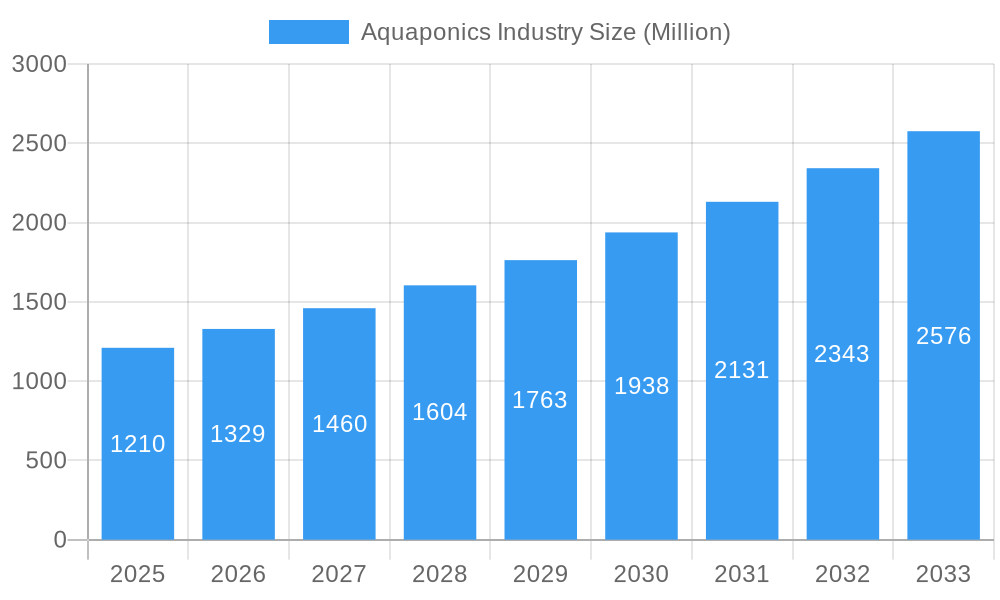
The global aquaponics market, valued at $1.21 billion in 2025, is experiencing robust growth, projected to expand at a compound annual growth rate (CAGR) of 9.60% from 2025 to 2033. This expansion is driven by several key factors. Increasing consumer demand for sustainably produced food is a major catalyst, with aquaponics offering an environmentally friendly alternative to traditional farming methods. Growing concerns about water scarcity and the need for efficient resource utilization further bolster the market's growth trajectory. Technological advancements, such as the development of sophisticated hydroponic systems and improved water filtration techniques, are streamlining aquaponics operations and enhancing productivity. The rising popularity of vertical farming, particularly in urban areas, also presents a significant opportunity for aquaponics to scale and meet the growing demand for fresh produce. Furthermore, government initiatives promoting sustainable agriculture and aquaculture are incentivizing investment in and adoption of aquaponics technologies. The diverse applications of aquaponics, ranging from commercial-scale operations to small-scale home systems, contribute to its market breadth.
Aquaponics Industry Market Size (In Billion)
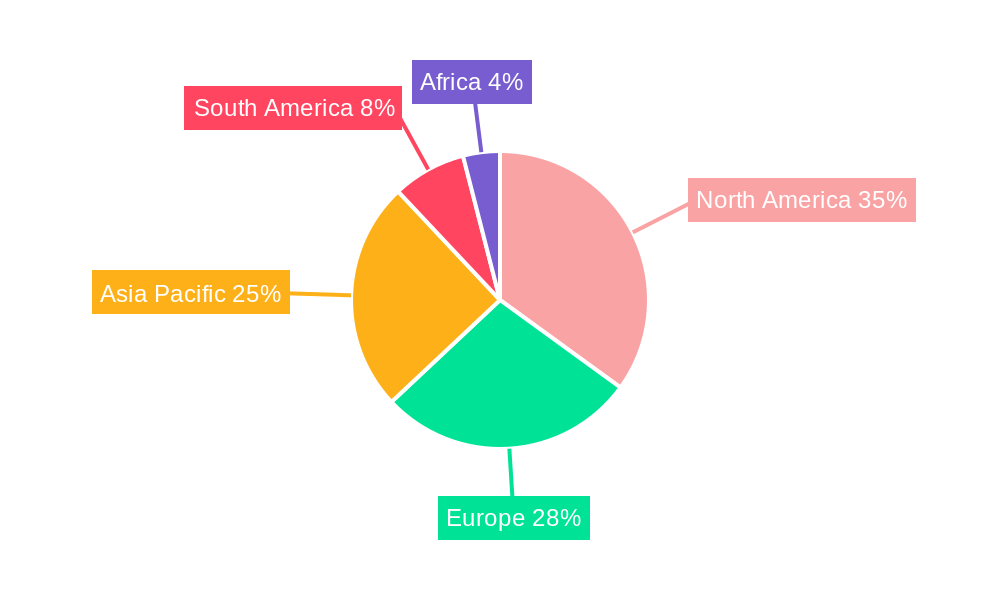
Market segmentation reveals significant opportunities within specific areas. Ebb and flow systems, along with Nutrient Film Technique (NFT) and Deep Water Culture (DWC), dominate the growing systems segment due to their efficiency and scalability. Poly and glass greenhouses account for a substantial portion of facility types, though the rapid growth of indoor vertical farms is reshaping the landscape. Tilapia, catfish, and carp are popular fish species within the aquaponics industry, driven by their adaptability and market demand. Regional variations exist, with North America and Europe representing mature markets, while Asia Pacific exhibits substantial growth potential due to its expanding population and increasing consumer awareness of sustainable food production. Competitive dynamics are shaped by a mix of established players and emerging companies innovating in technology and market reach. Challenges remain, including the high initial capital investment required for aquaponics setup and the need for specialized expertise in system management, but the overall market outlook is undeniably positive, suggesting sustained growth for the foreseeable future.
Aquaponics Industry Company Market Share
Aquaponics Industry Market Report: 2019-2033
This comprehensive report provides a detailed analysis of the Aquaponics industry, encompassing market dynamics, growth trends, leading players, and future projections. With a focus on key segments like Ebb and Flow, NFT, DWC systems, and various fish and plant types, this report is essential for industry professionals, investors, and anyone seeking a deep understanding of this rapidly evolving sector. The study period covers 2019-2033, with 2025 as the base and estimated year.
Aquaponics Industry Market Dynamics & Structure
The global aquaponics market, valued at $XX million in 2025, is characterized by a moderately fragmented structure. While larger players like Pentair Aquatic Eco-System Inc (PAES) hold significant market share, numerous smaller, specialized farms contribute to overall market volume. Technological innovation, particularly in automation and vertical farming techniques, is a key driver. Regulatory frameworks concerning water usage and food safety vary across regions, impacting market growth differentially. Competitive substitutes include traditional aquaculture and hydroponics, posing ongoing challenges. The industry is experiencing increased M&A activity, with approximately XX deals recorded in the past five years, driven by the desire for market consolidation and access to new technologies. End-user demographics are expanding, with increasing interest from both commercial operators and home enthusiasts.
- Market Concentration: Moderately fragmented, with a few major players and numerous smaller operators.
- Technological Innovation: Focus on automation, vertical farming, and improved water management systems.
- Regulatory Landscape: Varies significantly across regions, impacting operational costs and expansion strategies.
- Competitive Substitutes: Traditional aquaculture and hydroponics.
- M&A Activity: XX deals in the past 5 years, indicating a trend toward consolidation.
- End-User Demographics: Expanding to include both commercial and residential applications.
Aquaponics Industry Growth Trends & Insights
The aquaponics market exhibits robust growth, driven by increasing consumer demand for sustainably produced food, coupled with technological advancements improving efficiency and scalability. Between 2019 and 2024, the market experienced a CAGR of XX%, reaching $XX million. The forecast period (2025-2033) projects a CAGR of XX%, reaching $XX million by 2033. This growth is attributed to factors such as rising awareness of environmental sustainability, technological disruptions leading to higher yields and reduced water consumption, and shifting consumer preferences toward locally sourced, organic produce. Increased adoption of vertical farming techniques, particularly in urban areas with limited land availability, further fuels market expansion. Market penetration remains relatively low, presenting significant opportunities for future growth.
Dominant Regions, Countries, or Segments in Aquaponics Industry
North America and Europe currently dominate the aquaponics market, owing to higher consumer awareness, established infrastructure, and supportive government policies. Within these regions, the use of Poly or Glass Greenhouses is prevalent, particularly for commercial operations. The Ebb and Flow (Flood and Drain) system holds the largest market share among growing methods due to its relative simplicity and cost-effectiveness. Tilapia remains the most popular fish species due to its fast growth rate and adaptability.
- Leading Regions: North America and Europe.
- Dominant Growing System: Ebb and Flow (Flood and Drain).
- Preferred Fish Species: Tilapia.
- Facility Type: Poly or Glass Greenhouses.
- Key Growth Drivers: Strong consumer demand for sustainable food, supportive government policies (in certain regions), and technological advancements.
Aquaponics Industry Product Landscape
Product innovation is focused on improving system efficiency, automation, and scalability. Advanced water filtration systems, automated feeding mechanisms, and integrated monitoring technologies are becoming increasingly prevalent. The integration of IoT sensors for real-time data analysis and control enhances productivity and minimizes resource waste. Unique selling propositions emphasize sustainability, reduced water consumption, and the production of high-quality, locally sourced food.
Key Drivers, Barriers & Challenges in Aquaponics Industry
Key Drivers:
- Growing consumer demand for sustainably produced food.
- Technological advancements in automation and water management.
- Government initiatives promoting sustainable agriculture.
Key Challenges:
- High initial investment costs for system setup.
- Expertise required for successful operation and maintenance.
- Disease outbreaks among fish populations can significantly impact productivity. (XX% estimated loss in revenue in certain cases).
Emerging Opportunities in Aquaponics Industry
Emerging opportunities include expanding into untapped markets in developing countries, developing specialized systems for niche crops and fish species, and integrating aquaponics with renewable energy sources. The potential for vertical farming in urban environments, coupled with advancements in automation and AI-driven monitoring, presents significant growth potential. Further research into disease prevention and fish genetics will enhance productivity and resilience.
Growth Accelerators in the Aquaponics Industry
Technological breakthroughs, strategic partnerships between technology providers and aquaponics farms, and market expansion strategies targeting new geographic regions and consumer segments will propel market growth. Government support for research and development, coupled with incentives for sustainable agriculture practices, will further accelerate industry development.
Key Players Shaping the Aquaponics Industry Market
- Deep Water Farms
- Superior Fresh
- Practical Aquaponics
- Nelson & Pade Aquaponics
- BIGH
- ECF Farm Berli
- Garden City Aquaponics Inc
- Aquaponics USA
- Madhavi Farms
- Ouroboros Farms
- Pentair Aquatic Eco-System Inc (PAES)
Notable Milestones in Aquaponics Industry Sector
- 2020: Increased investment in R&D for automated aquaponics systems.
- 2022: Launch of several innovative water filtration technologies.
- 2023: Successful integration of AI-driven monitoring systems in several large-scale aquaponics farms.
In-Depth Aquaponics Industry Market Outlook
The aquaponics market is poised for significant growth over the next decade, driven by technological advancements, evolving consumer preferences, and supportive government policies. Strategic partnerships, focused on innovation and market expansion, will be key to capturing this potential. Opportunities exist in developing specialized systems, expanding into new geographical markets, and integrating aquaponics with other sustainable technologies. The market is expected to see continued consolidation, with larger players acquiring smaller farms to expand their reach and enhance their technological capabilities.
Aquaponics Industry Segmentation
- 1. Production Analysis
- 2. Consumption Analysis
- 3. Import Market Analysis (Value & Volume)
- 4. Export Market Analysis (Value & Volume)
- 5. Price Trend Analysis
Aquaponics Industry Segmentation By Geography
-
1. North America
- 1.1. United States
- 1.2. Canada
- 1.3. Mexico
-
2. South America
- 2.1. Brazil
- 2.2. Argentina
- 2.3. Rest of South America
-
3. Europe
- 3.1. United Kingdom
- 3.2. Germany
- 3.3. France
- 3.4. Italy
- 3.5. Spain
- 3.6. Russia
- 3.7. Benelux
- 3.8. Nordics
- 3.9. Rest of Europe
-
4. Middle East & Africa
- 4.1. Turkey
- 4.2. Israel
- 4.3. GCC
- 4.4. North Africa
- 4.5. South Africa
- 4.6. Rest of Middle East & Africa
-
5. Asia Pacific
- 5.1. China
- 5.2. India
- 5.3. Japan
- 5.4. South Korea
- 5.5. ASEAN
- 5.6. Oceania
- 5.7. Rest of Asia Pacific
Aquaponics Industry Regional Market Share
Geographic Coverage of Aquaponics Industry
Aquaponics Industry REPORT HIGHLIGHTS
| Aspects | Details |
|---|---|
| Study Period | 2020-2034 |
| Base Year | 2025 |
| Estimated Year | 2026 |
| Forecast Period | 2026-2034 |
| Historical Period | 2020-2025 |
| Growth Rate | CAGR of 9.60% from 2020-2034 |
| Segmentation |
|
Table of Contents
- 1. Introduction
- 1.1. Research Scope
- 1.2. Market Segmentation
- 1.3. Research Objective
- 1.4. Definitions and Assumptions
- 2. Executive Summary
- 2.1. Market Snapshot
- 3. Market Dynamics
- 3.1. Market Drivers
- 3.2. Market Restrains
- 3.3. Market Trends
- 3.4. Market Opportunities
- 4. Market Factor Analysis
- 4.1. Porters Five Forces
- 4.1.1. Bargaining Power of Suppliers
- 4.1.2. Bargaining Power of Buyers
- 4.1.3. Threat of New Entrants
- 4.1.4. Threat of Substitutes
- 4.1.5. Competitive Rivalry
- 4.2. PESTEL analysis
- 4.3. BCG Analysis
- 4.3.1. Stars (High Growth, High Market Share)
- 4.3.2. Cash Cows (Low Growth, High Market Share)
- 4.3.3. Question Mark (High Growth, Low Market Share)
- 4.3.4. Dogs (Low Growth, Low Market Share)
- 4.4. Ansoff Matrix Analysis
- 4.5. Supply Chain Analysis
- 4.6. Regulatory Landscape
- 4.7. Current Market Potential and Opportunity Assessment (TAM–SAM–SOM Framework)
- 4.8. IMR Analyst Note
- 4.1. Porters Five Forces
- 5. Market Analysis, Insights and Forecast 2021-2033
- 5.1. Market Analysis, Insights and Forecast - by Production Analysis
- 5.2. Market Analysis, Insights and Forecast - by Consumption Analysis
- 5.3. Market Analysis, Insights and Forecast - by Import Market Analysis (Value & Volume)
- 5.4. Market Analysis, Insights and Forecast - by Export Market Analysis (Value & Volume)
- 5.5. Market Analysis, Insights and Forecast - by Price Trend Analysis
- 5.6. Market Analysis, Insights and Forecast - by Region
- 5.6.1. North America
- 5.6.2. South America
- 5.6.3. Europe
- 5.6.4. Middle East & Africa
- 5.6.5. Asia Pacific
- 6. Global Aquaponics Industry Analysis, Insights and Forecast, 2021-2033
- 6.1. Market Analysis, Insights and Forecast - by Production Analysis
- 6.2. Market Analysis, Insights and Forecast - by Consumption Analysis
- 6.3. Market Analysis, Insights and Forecast - by Import Market Analysis (Value & Volume)
- 6.4. Market Analysis, Insights and Forecast - by Export Market Analysis (Value & Volume)
- 6.5. Market Analysis, Insights and Forecast - by Price Trend Analysis
- 7. North America Aquaponics Industry Analysis, Insights and Forecast, 2020-2032
- 7.1. Market Analysis, Insights and Forecast - by Production Analysis
- 7.2. Market Analysis, Insights and Forecast - by Consumption Analysis
- 7.3. Market Analysis, Insights and Forecast - by Import Market Analysis (Value & Volume)
- 7.4. Market Analysis, Insights and Forecast - by Export Market Analysis (Value & Volume)
- 7.5. Market Analysis, Insights and Forecast - by Price Trend Analysis
- 8. South America Aquaponics Industry Analysis, Insights and Forecast, 2020-2032
- 8.1. Market Analysis, Insights and Forecast - by Production Analysis
- 8.2. Market Analysis, Insights and Forecast - by Consumption Analysis
- 8.3. Market Analysis, Insights and Forecast - by Import Market Analysis (Value & Volume)
- 8.4. Market Analysis, Insights and Forecast - by Export Market Analysis (Value & Volume)
- 8.5. Market Analysis, Insights and Forecast - by Price Trend Analysis
- 9. Europe Aquaponics Industry Analysis, Insights and Forecast, 2020-2032
- 9.1. Market Analysis, Insights and Forecast - by Production Analysis
- 9.2. Market Analysis, Insights and Forecast - by Consumption Analysis
- 9.3. Market Analysis, Insights and Forecast - by Import Market Analysis (Value & Volume)
- 9.4. Market Analysis, Insights and Forecast - by Export Market Analysis (Value & Volume)
- 9.5. Market Analysis, Insights and Forecast - by Price Trend Analysis
- 10. Middle East & Africa Aquaponics Industry Analysis, Insights and Forecast, 2020-2032
- 10.1. Market Analysis, Insights and Forecast - by Production Analysis
- 10.2. Market Analysis, Insights and Forecast - by Consumption Analysis
- 10.3. Market Analysis, Insights and Forecast - by Import Market Analysis (Value & Volume)
- 10.4. Market Analysis, Insights and Forecast - by Export Market Analysis (Value & Volume)
- 10.5. Market Analysis, Insights and Forecast - by Price Trend Analysis
- 11. Asia Pacific Aquaponics Industry Analysis, Insights and Forecast, 2020-2032
- 11.1. Market Analysis, Insights and Forecast - by Production Analysis
- 11.2. Market Analysis, Insights and Forecast - by Consumption Analysis
- 11.3. Market Analysis, Insights and Forecast - by Import Market Analysis (Value & Volume)
- 11.4. Market Analysis, Insights and Forecast - by Export Market Analysis (Value & Volume)
- 11.5. Market Analysis, Insights and Forecast - by Price Trend Analysis
- 12. Competitive Analysis
- 12.1. Company Profiles
- 12.1.1 Deep Water Farms
- 12.1.1.1. Company Overview
- 12.1.1.2. Products
- 12.1.1.3. Company Financials
- 12.1.1.4. SWOT Analysis
- 12.1.2 Superior Fresh
- 12.1.2.1. Company Overview
- 12.1.2.2. Products
- 12.1.2.3. Company Financials
- 12.1.2.4. SWOT Analysis
- 12.1.3 Practical Aquaponics
- 12.1.3.1. Company Overview
- 12.1.3.2. Products
- 12.1.3.3. Company Financials
- 12.1.3.4. SWOT Analysis
- 12.1.4 Nelson & Pade Aquaponics
- 12.1.4.1. Company Overview
- 12.1.4.2. Products
- 12.1.4.3. Company Financials
- 12.1.4.4. SWOT Analysis
- 12.1.5 BIGH
- 12.1.5.1. Company Overview
- 12.1.5.2. Products
- 12.1.5.3. Company Financials
- 12.1.5.4. SWOT Analysis
- 12.1.6 ECF Farm Berli
- 12.1.6.1. Company Overview
- 12.1.6.2. Products
- 12.1.6.3. Company Financials
- 12.1.6.4. SWOT Analysis
- 12.1.7 Garden City Aquaponics Inc
- 12.1.7.1. Company Overview
- 12.1.7.2. Products
- 12.1.7.3. Company Financials
- 12.1.7.4. SWOT Analysis
- 12.1.8 Aquaponics USA
- 12.1.8.1. Company Overview
- 12.1.8.2. Products
- 12.1.8.3. Company Financials
- 12.1.8.4. SWOT Analysis
- 12.1.9 Madhavi Farms
- 12.1.9.1. Company Overview
- 12.1.9.2. Products
- 12.1.9.3. Company Financials
- 12.1.9.4. SWOT Analysis
- 12.1.10 Ouroboros Farms
- 12.1.10.1. Company Overview
- 12.1.10.2. Products
- 12.1.10.3. Company Financials
- 12.1.10.4. SWOT Analysis
- 12.1.11 Pentair Aquatic Eco-System Inc (PAES)
- 12.1.11.1. Company Overview
- 12.1.11.2. Products
- 12.1.11.3. Company Financials
- 12.1.11.4. SWOT Analysis
- 12.1.1 Deep Water Farms
- 12.2. Market Entropy
- 12.2.1 Company's Key Areas Served
- 12.2.2 Recent Developments
- 12.3. Company Market Share Analysis 2025
- 12.3.1 Top 5 Companies Market Share Analysis
- 12.3.2 Top 3 Companies Market Share Analysis
- 12.4. List of Potential Customers
- 13. Research Methodology
List of Figures
- Figure 1: Global Aquaponics Industry Revenue Breakdown (Million, %) by Region 2025 & 2033
- Figure 2: North America Aquaponics Industry Revenue (Million), by Production Analysis 2025 & 2033
- Figure 3: North America Aquaponics Industry Revenue Share (%), by Production Analysis 2025 & 2033
- Figure 4: North America Aquaponics Industry Revenue (Million), by Consumption Analysis 2025 & 2033
- Figure 5: North America Aquaponics Industry Revenue Share (%), by Consumption Analysis 2025 & 2033
- Figure 6: North America Aquaponics Industry Revenue (Million), by Import Market Analysis (Value & Volume) 2025 & 2033
- Figure 7: North America Aquaponics Industry Revenue Share (%), by Import Market Analysis (Value & Volume) 2025 & 2033
- Figure 8: North America Aquaponics Industry Revenue (Million), by Export Market Analysis (Value & Volume) 2025 & 2033
- Figure 9: North America Aquaponics Industry Revenue Share (%), by Export Market Analysis (Value & Volume) 2025 & 2033
- Figure 10: North America Aquaponics Industry Revenue (Million), by Price Trend Analysis 2025 & 2033
- Figure 11: North America Aquaponics Industry Revenue Share (%), by Price Trend Analysis 2025 & 2033
- Figure 12: North America Aquaponics Industry Revenue (Million), by Country 2025 & 2033
- Figure 13: North America Aquaponics Industry Revenue Share (%), by Country 2025 & 2033
- Figure 14: South America Aquaponics Industry Revenue (Million), by Production Analysis 2025 & 2033
- Figure 15: South America Aquaponics Industry Revenue Share (%), by Production Analysis 2025 & 2033
- Figure 16: South America Aquaponics Industry Revenue (Million), by Consumption Analysis 2025 & 2033
- Figure 17: South America Aquaponics Industry Revenue Share (%), by Consumption Analysis 2025 & 2033
- Figure 18: South America Aquaponics Industry Revenue (Million), by Import Market Analysis (Value & Volume) 2025 & 2033
- Figure 19: South America Aquaponics Industry Revenue Share (%), by Import Market Analysis (Value & Volume) 2025 & 2033
- Figure 20: South America Aquaponics Industry Revenue (Million), by Export Market Analysis (Value & Volume) 2025 & 2033
- Figure 21: South America Aquaponics Industry Revenue Share (%), by Export Market Analysis (Value & Volume) 2025 & 2033
- Figure 22: South America Aquaponics Industry Revenue (Million), by Price Trend Analysis 2025 & 2033
- Figure 23: South America Aquaponics Industry Revenue Share (%), by Price Trend Analysis 2025 & 2033
- Figure 24: South America Aquaponics Industry Revenue (Million), by Country 2025 & 2033
- Figure 25: South America Aquaponics Industry Revenue Share (%), by Country 2025 & 2033
- Figure 26: Europe Aquaponics Industry Revenue (Million), by Production Analysis 2025 & 2033
- Figure 27: Europe Aquaponics Industry Revenue Share (%), by Production Analysis 2025 & 2033
- Figure 28: Europe Aquaponics Industry Revenue (Million), by Consumption Analysis 2025 & 2033
- Figure 29: Europe Aquaponics Industry Revenue Share (%), by Consumption Analysis 2025 & 2033
- Figure 30: Europe Aquaponics Industry Revenue (Million), by Import Market Analysis (Value & Volume) 2025 & 2033
- Figure 31: Europe Aquaponics Industry Revenue Share (%), by Import Market Analysis (Value & Volume) 2025 & 2033
- Figure 32: Europe Aquaponics Industry Revenue (Million), by Export Market Analysis (Value & Volume) 2025 & 2033
- Figure 33: Europe Aquaponics Industry Revenue Share (%), by Export Market Analysis (Value & Volume) 2025 & 2033
- Figure 34: Europe Aquaponics Industry Revenue (Million), by Price Trend Analysis 2025 & 2033
- Figure 35: Europe Aquaponics Industry Revenue Share (%), by Price Trend Analysis 2025 & 2033
- Figure 36: Europe Aquaponics Industry Revenue (Million), by Country 2025 & 2033
- Figure 37: Europe Aquaponics Industry Revenue Share (%), by Country 2025 & 2033
- Figure 38: Middle East & Africa Aquaponics Industry Revenue (Million), by Production Analysis 2025 & 2033
- Figure 39: Middle East & Africa Aquaponics Industry Revenue Share (%), by Production Analysis 2025 & 2033
- Figure 40: Middle East & Africa Aquaponics Industry Revenue (Million), by Consumption Analysis 2025 & 2033
- Figure 41: Middle East & Africa Aquaponics Industry Revenue Share (%), by Consumption Analysis 2025 & 2033
- Figure 42: Middle East & Africa Aquaponics Industry Revenue (Million), by Import Market Analysis (Value & Volume) 2025 & 2033
- Figure 43: Middle East & Africa Aquaponics Industry Revenue Share (%), by Import Market Analysis (Value & Volume) 2025 & 2033
- Figure 44: Middle East & Africa Aquaponics Industry Revenue (Million), by Export Market Analysis (Value & Volume) 2025 & 2033
- Figure 45: Middle East & Africa Aquaponics Industry Revenue Share (%), by Export Market Analysis (Value & Volume) 2025 & 2033
- Figure 46: Middle East & Africa Aquaponics Industry Revenue (Million), by Price Trend Analysis 2025 & 2033
- Figure 47: Middle East & Africa Aquaponics Industry Revenue Share (%), by Price Trend Analysis 2025 & 2033
- Figure 48: Middle East & Africa Aquaponics Industry Revenue (Million), by Country 2025 & 2033
- Figure 49: Middle East & Africa Aquaponics Industry Revenue Share (%), by Country 2025 & 2033
- Figure 50: Asia Pacific Aquaponics Industry Revenue (Million), by Production Analysis 2025 & 2033
- Figure 51: Asia Pacific Aquaponics Industry Revenue Share (%), by Production Analysis 2025 & 2033
- Figure 52: Asia Pacific Aquaponics Industry Revenue (Million), by Consumption Analysis 2025 & 2033
- Figure 53: Asia Pacific Aquaponics Industry Revenue Share (%), by Consumption Analysis 2025 & 2033
- Figure 54: Asia Pacific Aquaponics Industry Revenue (Million), by Import Market Analysis (Value & Volume) 2025 & 2033
- Figure 55: Asia Pacific Aquaponics Industry Revenue Share (%), by Import Market Analysis (Value & Volume) 2025 & 2033
- Figure 56: Asia Pacific Aquaponics Industry Revenue (Million), by Export Market Analysis (Value & Volume) 2025 & 2033
- Figure 57: Asia Pacific Aquaponics Industry Revenue Share (%), by Export Market Analysis (Value & Volume) 2025 & 2033
- Figure 58: Asia Pacific Aquaponics Industry Revenue (Million), by Price Trend Analysis 2025 & 2033
- Figure 59: Asia Pacific Aquaponics Industry Revenue Share (%), by Price Trend Analysis 2025 & 2033
- Figure 60: Asia Pacific Aquaponics Industry Revenue (Million), by Country 2025 & 2033
- Figure 61: Asia Pacific Aquaponics Industry Revenue Share (%), by Country 2025 & 2033
List of Tables
- Table 1: Global Aquaponics Industry Revenue Million Forecast, by Production Analysis 2020 & 2033
- Table 2: Global Aquaponics Industry Revenue Million Forecast, by Consumption Analysis 2020 & 2033
- Table 3: Global Aquaponics Industry Revenue Million Forecast, by Import Market Analysis (Value & Volume) 2020 & 2033
- Table 4: Global Aquaponics Industry Revenue Million Forecast, by Export Market Analysis (Value & Volume) 2020 & 2033
- Table 5: Global Aquaponics Industry Revenue Million Forecast, by Price Trend Analysis 2020 & 2033
- Table 6: Global Aquaponics Industry Revenue Million Forecast, by Region 2020 & 2033
- Table 7: Global Aquaponics Industry Revenue Million Forecast, by Production Analysis 2020 & 2033
- Table 8: Global Aquaponics Industry Revenue Million Forecast, by Consumption Analysis 2020 & 2033
- Table 9: Global Aquaponics Industry Revenue Million Forecast, by Import Market Analysis (Value & Volume) 2020 & 2033
- Table 10: Global Aquaponics Industry Revenue Million Forecast, by Export Market Analysis (Value & Volume) 2020 & 2033
- Table 11: Global Aquaponics Industry Revenue Million Forecast, by Price Trend Analysis 2020 & 2033
- Table 12: Global Aquaponics Industry Revenue Million Forecast, by Country 2020 & 2033
- Table 13: United States Aquaponics Industry Revenue (Million) Forecast, by Application 2020 & 2033
- Table 14: Canada Aquaponics Industry Revenue (Million) Forecast, by Application 2020 & 2033
- Table 15: Mexico Aquaponics Industry Revenue (Million) Forecast, by Application 2020 & 2033
- Table 16: Global Aquaponics Industry Revenue Million Forecast, by Production Analysis 2020 & 2033
- Table 17: Global Aquaponics Industry Revenue Million Forecast, by Consumption Analysis 2020 & 2033
- Table 18: Global Aquaponics Industry Revenue Million Forecast, by Import Market Analysis (Value & Volume) 2020 & 2033
- Table 19: Global Aquaponics Industry Revenue Million Forecast, by Export Market Analysis (Value & Volume) 2020 & 2033
- Table 20: Global Aquaponics Industry Revenue Million Forecast, by Price Trend Analysis 2020 & 2033
- Table 21: Global Aquaponics Industry Revenue Million Forecast, by Country 2020 & 2033
- Table 22: Brazil Aquaponics Industry Revenue (Million) Forecast, by Application 2020 & 2033
- Table 23: Argentina Aquaponics Industry Revenue (Million) Forecast, by Application 2020 & 2033
- Table 24: Rest of South America Aquaponics Industry Revenue (Million) Forecast, by Application 2020 & 2033
- Table 25: Global Aquaponics Industry Revenue Million Forecast, by Production Analysis 2020 & 2033
- Table 26: Global Aquaponics Industry Revenue Million Forecast, by Consumption Analysis 2020 & 2033
- Table 27: Global Aquaponics Industry Revenue Million Forecast, by Import Market Analysis (Value & Volume) 2020 & 2033
- Table 28: Global Aquaponics Industry Revenue Million Forecast, by Export Market Analysis (Value & Volume) 2020 & 2033
- Table 29: Global Aquaponics Industry Revenue Million Forecast, by Price Trend Analysis 2020 & 2033
- Table 30: Global Aquaponics Industry Revenue Million Forecast, by Country 2020 & 2033
- Table 31: United Kingdom Aquaponics Industry Revenue (Million) Forecast, by Application 2020 & 2033
- Table 32: Germany Aquaponics Industry Revenue (Million) Forecast, by Application 2020 & 2033
- Table 33: France Aquaponics Industry Revenue (Million) Forecast, by Application 2020 & 2033
- Table 34: Italy Aquaponics Industry Revenue (Million) Forecast, by Application 2020 & 2033
- Table 35: Spain Aquaponics Industry Revenue (Million) Forecast, by Application 2020 & 2033
- Table 36: Russia Aquaponics Industry Revenue (Million) Forecast, by Application 2020 & 2033
- Table 37: Benelux Aquaponics Industry Revenue (Million) Forecast, by Application 2020 & 2033
- Table 38: Nordics Aquaponics Industry Revenue (Million) Forecast, by Application 2020 & 2033
- Table 39: Rest of Europe Aquaponics Industry Revenue (Million) Forecast, by Application 2020 & 2033
- Table 40: Global Aquaponics Industry Revenue Million Forecast, by Production Analysis 2020 & 2033
- Table 41: Global Aquaponics Industry Revenue Million Forecast, by Consumption Analysis 2020 & 2033
- Table 42: Global Aquaponics Industry Revenue Million Forecast, by Import Market Analysis (Value & Volume) 2020 & 2033
- Table 43: Global Aquaponics Industry Revenue Million Forecast, by Export Market Analysis (Value & Volume) 2020 & 2033
- Table 44: Global Aquaponics Industry Revenue Million Forecast, by Price Trend Analysis 2020 & 2033
- Table 45: Global Aquaponics Industry Revenue Million Forecast, by Country 2020 & 2033
- Table 46: Turkey Aquaponics Industry Revenue (Million) Forecast, by Application 2020 & 2033
- Table 47: Israel Aquaponics Industry Revenue (Million) Forecast, by Application 2020 & 2033
- Table 48: GCC Aquaponics Industry Revenue (Million) Forecast, by Application 2020 & 2033
- Table 49: North Africa Aquaponics Industry Revenue (Million) Forecast, by Application 2020 & 2033
- Table 50: South Africa Aquaponics Industry Revenue (Million) Forecast, by Application 2020 & 2033
- Table 51: Rest of Middle East & Africa Aquaponics Industry Revenue (Million) Forecast, by Application 2020 & 2033
- Table 52: Global Aquaponics Industry Revenue Million Forecast, by Production Analysis 2020 & 2033
- Table 53: Global Aquaponics Industry Revenue Million Forecast, by Consumption Analysis 2020 & 2033
- Table 54: Global Aquaponics Industry Revenue Million Forecast, by Import Market Analysis (Value & Volume) 2020 & 2033
- Table 55: Global Aquaponics Industry Revenue Million Forecast, by Export Market Analysis (Value & Volume) 2020 & 2033
- Table 56: Global Aquaponics Industry Revenue Million Forecast, by Price Trend Analysis 2020 & 2033
- Table 57: Global Aquaponics Industry Revenue Million Forecast, by Country 2020 & 2033
- Table 58: China Aquaponics Industry Revenue (Million) Forecast, by Application 2020 & 2033
- Table 59: India Aquaponics Industry Revenue (Million) Forecast, by Application 2020 & 2033
- Table 60: Japan Aquaponics Industry Revenue (Million) Forecast, by Application 2020 & 2033
- Table 61: South Korea Aquaponics Industry Revenue (Million) Forecast, by Application 2020 & 2033
- Table 62: ASEAN Aquaponics Industry Revenue (Million) Forecast, by Application 2020 & 2033
- Table 63: Oceania Aquaponics Industry Revenue (Million) Forecast, by Application 2020 & 2033
- Table 64: Rest of Asia Pacific Aquaponics Industry Revenue (Million) Forecast, by Application 2020 & 2033
Frequently Asked Questions
1. What is the projected Compound Annual Growth Rate (CAGR) of the Aquaponics Industry?
The projected CAGR is approximately 9.60%.
2. Which companies are prominent players in the Aquaponics Industry?
Key companies in the market include Deep Water Farms, Superior Fresh, Practical Aquaponics, Nelson & Pade Aquaponics, BIGH, ECF Farm Berli, Garden City Aquaponics Inc, Aquaponics USA, Madhavi Farms, Ouroboros Farms, Pentair Aquatic Eco-System Inc (PAES).
3. What are the main segments of the Aquaponics Industry?
The market segments include Production Analysis, Consumption Analysis, Import Market Analysis (Value & Volume), Export Market Analysis (Value & Volume), Price Trend Analysis.
4. Can you provide details about the market size?
The market size is estimated to be USD 1.21 Million as of 2022.
5. What are some drivers contributing to market growth?
High Cost of Farm Labors; Increasing Consumption of Grain Crops.
6. What are the notable trends driving market growth?
Substantial Demand for Organic Produce Driving the Market.
7. Are there any restraints impacting market growth?
High Cost of Combine Harvesters; Small and Fragmented Land Holdings.
8. Can you provide examples of recent developments in the market?
N/A
9. What pricing options are available for accessing the report?
Pricing options include single-user, multi-user, and enterprise licenses priced at USD 4750, USD 5250, and USD 8750 respectively.
10. Is the market size provided in terms of value or volume?
The market size is provided in terms of value, measured in Million.
11. Are there any specific market keywords associated with the report?
Yes, the market keyword associated with the report is "Aquaponics Industry," which aids in identifying and referencing the specific market segment covered.
12. How do I determine which pricing option suits my needs best?
The pricing options vary based on user requirements and access needs. Individual users may opt for single-user licenses, while businesses requiring broader access may choose multi-user or enterprise licenses for cost-effective access to the report.
13. Are there any additional resources or data provided in the Aquaponics Industry report?
While the report offers comprehensive insights, it's advisable to review the specific contents or supplementary materials provided to ascertain if additional resources or data are available.
14. How can I stay updated on further developments or reports in the Aquaponics Industry?
To stay informed about further developments, trends, and reports in the Aquaponics Industry, consider subscribing to industry newsletters, following relevant companies and organizations, or regularly checking reputable industry news sources and publications.
Methodology
Step 1 - Identification of Relevant Samples Size from Population Database


Step 2 - Approaches for Defining Global Market Size (Value, Volume* & Price*)

Note*: In applicable scenarios
Step 3 - Data Sources
Primary Research
- Web Analytics
- Survey Reports
- Research Institute
- Latest Research Reports
- Opinion Leaders
Secondary Research
- Annual Reports
- White Paper
- Latest Press Release
- Industry Association
- Paid Database
- Investor Presentations

Step 4 - Data Triangulation
Involves using different sources of information in order to increase the validity of a study
These sources are likely to be stakeholders in a program - participants, other researchers, program staff, other community members, and so on.
Then we put all data in single framework & apply various statistical tools to find out the dynamic on the market.
During the analysis stage, feedback from the stakeholder groups would be compared to determine areas of agreement as well as areas of divergence