

Key Insights
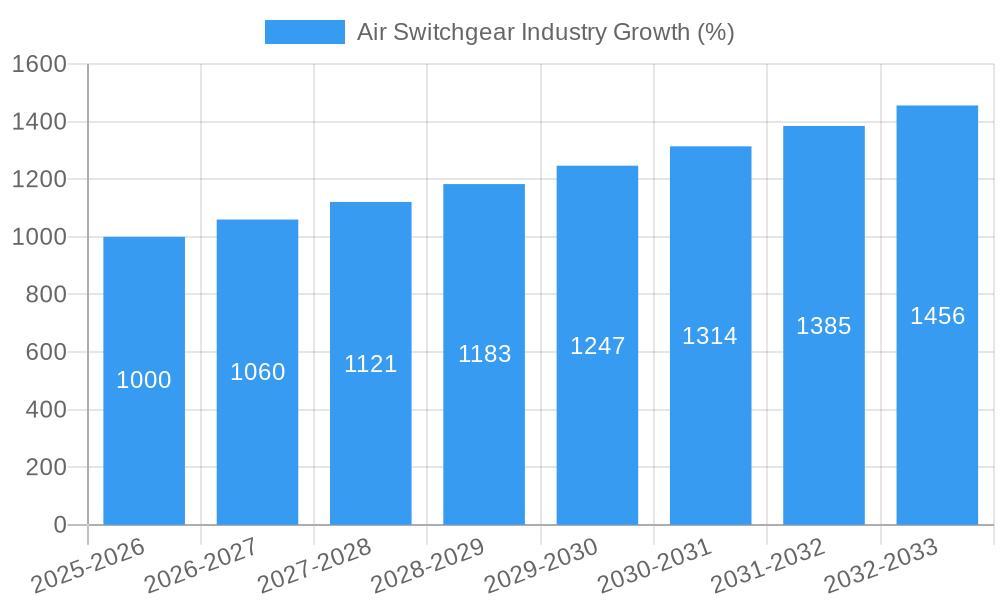
The global air switchgear market is experiencing robust growth, driven by the increasing demand for reliable and efficient power distribution across various sectors. A Compound Annual Growth Rate (CAGR) exceeding 4.00% indicates a significant expansion projected through 2033. This growth is fueled by several key factors. The burgeoning renewable energy sector necessitates advanced switchgear solutions for seamless integration and grid stability. Furthermore, the expanding industrial and commercial sectors, coupled with rapid urbanization and infrastructure development in emerging economies, are significantly boosting demand. The adoption of smart grid technologies, emphasizing automation and remote monitoring, is also driving innovation and market expansion. High-voltage applications, crucial for large-scale power transmission, represent a substantial segment, while low-voltage applications dominate residential and smaller commercial sectors. Leading companies like ABB, Siemens, and Eaton are at the forefront of technological advancements, continually improving efficiency, safety features, and integration capabilities. However, factors such as high initial investment costs and the need for specialized expertise can potentially restrain market growth in certain regions. Nevertheless, the long-term outlook for the air switchgear market remains positive, with continuous technological improvements and increasing infrastructure spending poised to fuel further expansion.
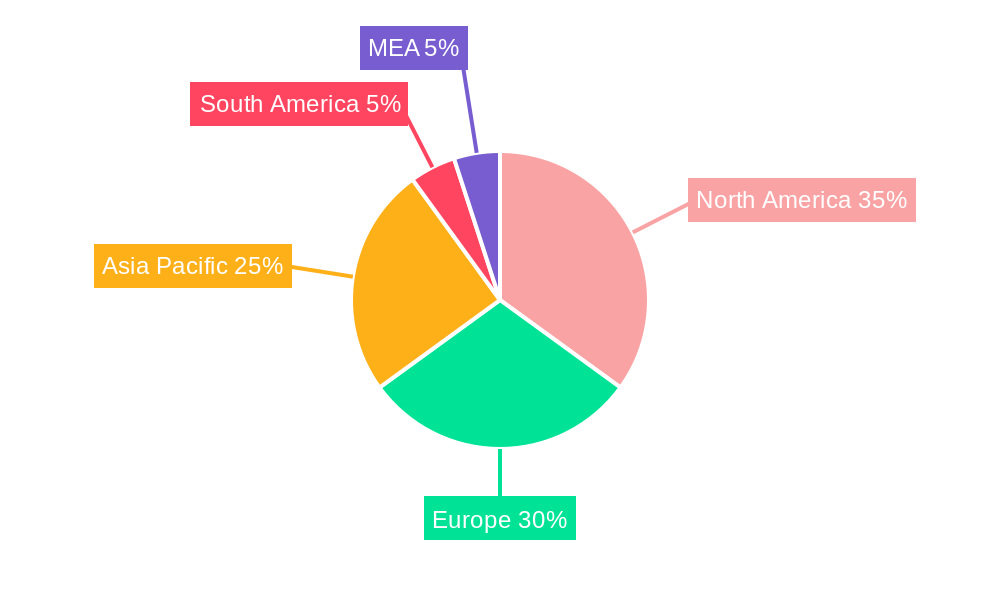
Regional variations in market penetration are expected. North America and Europe, with their established power grids and mature technological landscapes, currently hold significant market shares. However, rapidly developing economies in Asia-Pacific, particularly China and India, are witnessing significant growth, driven by extensive infrastructure projects and increasing energy consumption. The Middle East and Africa region is also expected to witness considerable growth due to large-scale infrastructure developments and investments in renewable energy projects. The competitive landscape is characterized by both established multinational corporations and regional players. The market is witnessing consolidation through mergers and acquisitions, with companies focusing on strategic partnerships to expand their market reach and product portfolios. The focus on environmentally friendly and sustainable solutions is also shaping the market, with manufacturers investing in energy-efficient designs and eco-friendly materials. Overall, the air switchgear market is poised for substantial growth, presenting opportunities for both established and emerging players.
Air Switchgear Industry Market Report: 2019-2033
This comprehensive report provides a detailed analysis of the air switchgear market, encompassing market dynamics, growth trends, regional dominance, product landscape, challenges, opportunities, key players, and future outlook. The study period spans from 2019 to 2033, with 2025 serving as the base and estimated year. This report is crucial for industry professionals, investors, and stakeholders seeking a thorough understanding of this dynamic sector. The parent market is the electrical power equipment market, while the child market is air switchgear.
Air Switchgear Industry Market Dynamics & Structure
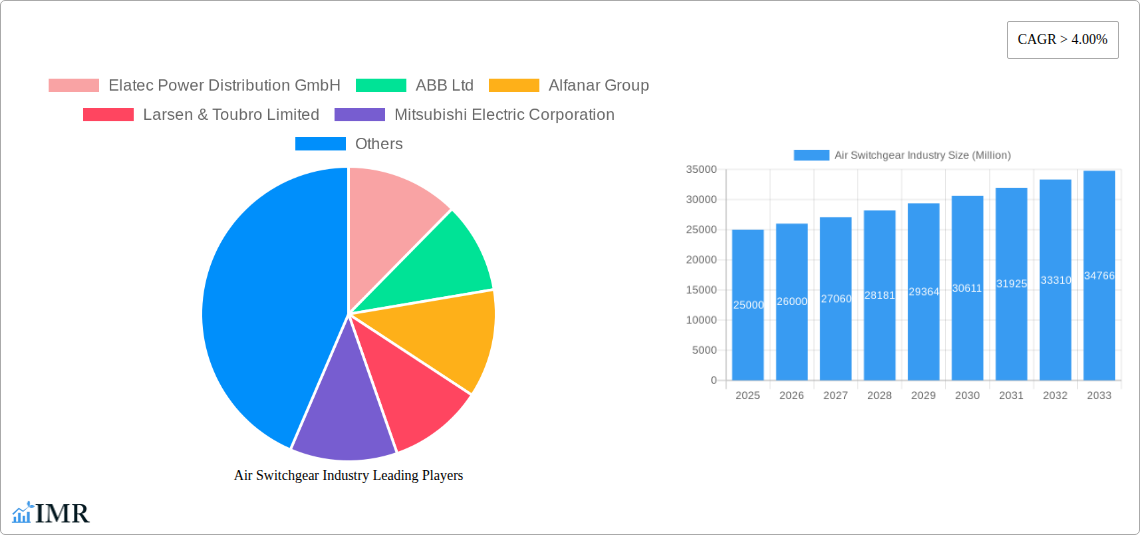
The air switchgear market is characterized by moderate concentration, with key players like ABB Ltd, Schneider Electric SE, and Siemens AG holding significant market share. Technological innovation, particularly in areas like digitalization and smart grids, is a major driver. Stringent safety regulations and environmental concerns shape the industry landscape, while competitive pressure from alternative switchgear technologies (e.g., gas-insulated switchgear) exists. Mergers and acquisitions (M&A) activity has been relatively steady, with an estimated xx million USD in deal value during the historical period (2019-2024). End-user demographics show a growing demand from power utilities and industrial sectors, reflecting increasing power consumption and infrastructure development.
- Market Concentration: Moderately concentrated, with top 5 players holding approximately xx% market share in 2024.
- Technological Innovation: Focus on digitalization, smart grid integration, and improved safety features.
- Regulatory Frameworks: Stringent safety and environmental standards impacting product design and manufacturing.
- Competitive Substitutes: Gas-insulated switchgear presents a key competitive threat.
- M&A Activity: xx million USD in deal value (2019-2024), with a projected increase in the forecast period.
- End-User Demographics: Power utilities and industrial sectors represent the largest market segments.
Air Switchgear Industry Growth Trends & Insights
The global air switchgear market exhibited a CAGR of xx% during the historical period (2019-2024), reaching a market size of xx million units in 2024. This growth is attributed to rising electricity demand, expanding power grids, and industrial automation. Technological advancements, such as the integration of IoT sensors and cloud-based monitoring systems, are driving adoption rates. However, economic fluctuations and project delays in certain regions can influence market growth. The market is expected to continue its growth trajectory, with a projected CAGR of xx% from 2025 to 2033, reaching xx million units by 2033. Consumer behavior shifts are driven by increased focus on operational efficiency, safety, and environmental sustainability.
Dominant Regions, Countries, or Segments in Air Switchgear Industry
North America and Europe currently dominate the air switchgear market, driven by robust infrastructure development, stringent safety regulations, and high adoption rates of advanced technologies. Within these regions, the high voltage segment shows significant growth potential due to large-scale power transmission projects. The power utilities sector represents the largest end-user segment, due to continuous upgrades and expansion of power grids. Asia-Pacific is anticipated to witness substantial growth in the coming years, fuelled by rapid industrialization and urbanization.
- Leading Region: North America (xx% market share in 2024)
- Key Drivers: Strong infrastructure development, high technological adoption, and stringent safety regulations.
- Growth Potential: Asia-Pacific region is expected to exhibit significant growth due to rapid industrialization.
- Dominant Segment: High Voltage segment exhibiting high growth potential.
Air Switchgear Industry Product Landscape
Air switchgear products are constantly evolving, incorporating features such as improved arc interruption technology, enhanced safety mechanisms, and integrated digital monitoring capabilities. These innovations aim to enhance operational reliability, reduce maintenance costs, and improve overall grid efficiency. Manufacturers are emphasizing the unique selling propositions of their products through advanced features, superior safety standards, and comprehensive service packages. Recent advancements include the integration of smart sensors for real-time monitoring and predictive maintenance.
Key Drivers, Barriers & Challenges in Air Switchgear Industry
Key Drivers:
- Increasing electricity demand globally.
- Expansion of power grids and infrastructure projects.
- Growing adoption of smart grids and digital technologies.
- Stringent safety and environmental regulations.
Key Challenges:
- Intense competition from alternative switchgear technologies.
- Fluctuations in raw material prices and supply chain disruptions.
- Economic downturns impacting infrastructure investments.
- Complex regulatory compliance requirements.
Emerging Opportunities in Air Switchgear Industry
The air switchgear market presents several emerging opportunities, including:
- Growth in renewable energy integration requiring specialized switchgear solutions.
- Expansion into untapped markets in developing economies.
- Development of compact and modular switchgear for space-constrained applications.
- Increased focus on lifecycle management and remote monitoring services.
Growth Accelerators in the Air Switchgear Industry
Long-term growth is expected to be fueled by technological advancements, strategic partnerships between manufacturers and grid operators, and expansion into emerging markets. The focus on sustainability and reduced carbon footprint will also drive innovation and demand for energy-efficient switchgear solutions.
Key Players Shaping the Air Switchgear Industry Market
- Elatec Power Distribution GmbH
- ABB Ltd
- Alfanar Group
- Larsen & Toubro Limited
- Mitsubishi Electric Corporation
- Siemens AG
- Schneider Electric SE
- Eaton Corporation PLC
- Wenzhou Unisun Electric Co Ltd
- Tavrida Electric
Notable Milestones in Air Switchgear Industry Sector
- August 2021: Schneider Electric launched GenieEvo Connected, a comprehensive, reliable switchgear range with unparalleled connectivity for asset health monitoring.
In-Depth Air Switchgear Industry Market Outlook
The air switchgear market is poised for sustained growth, driven by the ongoing expansion of power grids, increasing adoption of renewable energy sources, and the growing need for reliable and efficient power distribution. Strategic partnerships, technological innovations, and expansion into new markets will be crucial for companies seeking to capitalize on this growth potential. The integration of digital technologies and smart grid initiatives will continue to shape the industry, fostering demand for advanced and interconnected switchgear solutions.
Air Switchgear Industry Segmentation
-
1. Voltage Level
- 1.1. Low Voltage
- 1.2. Medium Voltage
- 1.3. High Voltage
-
2. End-User
- 2.1. Power Utilities
- 2.2. Industrial
- 2.3. Commercial and Residential
Air Switchgear Industry Segmentation By Geography
- 1. North America
- 2. Europe
- 3. Asia Pacific
- 4. South America
- 5. Middle East and Africa
Air Switchgear Industry REPORT HIGHLIGHTS
| Aspects | Details |
|---|---|
| Study Period | 2019-2033 |
| Base Year | 2024 |
| Estimated Year | 2025 |
| Forecast Period | 2025-2033 |
| Historical Period | 2019-2024 |
| Growth Rate | CAGR of > 4.00% from 2019-2033 |
| Segmentation |
|
Table of Contents
- 1. Introduction
- 1.1. Research Scope
- 1.2. Market Segmentation
- 1.3. Research Methodology
- 1.4. Definitions and Assumptions
- 2. Executive Summary
- 2.1. Introduction
- 3. Market Dynamics
- 3.1. Introduction
- 3.2. Market Drivers
- 3.2.1. 4.; Increasing Integration Of Renewable Energy Generation4.; Aging Power Grids And Investments In Transmission And Distribution Infrastructure
- 3.3. Market Restrains
- 3.3.1. 4.; Lack Of Investor Confidence Due To Sociopolitical Instability In Some Countries
- 3.4. Market Trends
- 3.4.1. Power Utilities Segment to Witness Significant Demand
- 4. Market Factor Analysis
- 4.1. Porters Five Forces
- 4.2. Supply/Value Chain
- 4.3. PESTEL analysis
- 4.4. Market Entropy
- 4.5. Patent/Trademark Analysis
- 5. Global Air Switchgear Industry Analysis, Insights and Forecast, 2019-2031
- 5.1. Market Analysis, Insights and Forecast - by Voltage Level
- 5.1.1. Low Voltage
- 5.1.2. Medium Voltage
- 5.1.3. High Voltage
- 5.2. Market Analysis, Insights and Forecast - by End-User
- 5.2.1. Power Utilities
- 5.2.2. Industrial
- 5.2.3. Commercial and Residential
- 5.3. Market Analysis, Insights and Forecast - by Region
- 5.3.1. North America
- 5.3.2. Europe
- 5.3.3. Asia Pacific
- 5.3.4. South America
- 5.3.5. Middle East and Africa
- 5.1. Market Analysis, Insights and Forecast - by Voltage Level
- 6. North America Air Switchgear Industry Analysis, Insights and Forecast, 2019-2031
- 6.1. Market Analysis, Insights and Forecast - by Voltage Level
- 6.1.1. Low Voltage
- 6.1.2. Medium Voltage
- 6.1.3. High Voltage
- 6.2. Market Analysis, Insights and Forecast - by End-User
- 6.2.1. Power Utilities
- 6.2.2. Industrial
- 6.2.3. Commercial and Residential
- 6.1. Market Analysis, Insights and Forecast - by Voltage Level
- 7. Europe Air Switchgear Industry Analysis, Insights and Forecast, 2019-2031
- 7.1. Market Analysis, Insights and Forecast - by Voltage Level
- 7.1.1. Low Voltage
- 7.1.2. Medium Voltage
- 7.1.3. High Voltage
- 7.2. Market Analysis, Insights and Forecast - by End-User
- 7.2.1. Power Utilities
- 7.2.2. Industrial
- 7.2.3. Commercial and Residential
- 7.1. Market Analysis, Insights and Forecast - by Voltage Level
- 8. Asia Pacific Air Switchgear Industry Analysis, Insights and Forecast, 2019-2031
- 8.1. Market Analysis, Insights and Forecast - by Voltage Level
- 8.1.1. Low Voltage
- 8.1.2. Medium Voltage
- 8.1.3. High Voltage
- 8.2. Market Analysis, Insights and Forecast - by End-User
- 8.2.1. Power Utilities
- 8.2.2. Industrial
- 8.2.3. Commercial and Residential
- 8.1. Market Analysis, Insights and Forecast - by Voltage Level
- 9. South America Air Switchgear Industry Analysis, Insights and Forecast, 2019-2031
- 9.1. Market Analysis, Insights and Forecast - by Voltage Level
- 9.1.1. Low Voltage
- 9.1.2. Medium Voltage
- 9.1.3. High Voltage
- 9.2. Market Analysis, Insights and Forecast - by End-User
- 9.2.1. Power Utilities
- 9.2.2. Industrial
- 9.2.3. Commercial and Residential
- 9.1. Market Analysis, Insights and Forecast - by Voltage Level
- 10. Middle East and Africa Air Switchgear Industry Analysis, Insights and Forecast, 2019-2031
- 10.1. Market Analysis, Insights and Forecast - by Voltage Level
- 10.1.1. Low Voltage
- 10.1.2. Medium Voltage
- 10.1.3. High Voltage
- 10.2. Market Analysis, Insights and Forecast - by End-User
- 10.2.1. Power Utilities
- 10.2.2. Industrial
- 10.2.3. Commercial and Residential
- 10.1. Market Analysis, Insights and Forecast - by Voltage Level
- 11. North America Air Switchgear Industry Analysis, Insights and Forecast, 2019-2031
- 11.1. Market Analysis, Insights and Forecast - By Country/Sub-region
- 11.1.1 United States
- 11.1.2 Canada
- 11.1.3 Mexico
- 12. Europe Air Switchgear Industry Analysis, Insights and Forecast, 2019-2031
- 12.1. Market Analysis, Insights and Forecast - By Country/Sub-region
- 12.1.1 Germany
- 12.1.2 United Kingdom
- 12.1.3 France
- 12.1.4 Spain
- 12.1.5 Italy
- 12.1.6 Spain
- 12.1.7 Belgium
- 12.1.8 Netherland
- 12.1.9 Nordics
- 12.1.10 Rest of Europe
- 13. Asia Pacific Air Switchgear Industry Analysis, Insights and Forecast, 2019-2031
- 13.1. Market Analysis, Insights and Forecast - By Country/Sub-region
- 13.1.1 China
- 13.1.2 Japan
- 13.1.3 India
- 13.1.4 South Korea
- 13.1.5 Southeast Asia
- 13.1.6 Australia
- 13.1.7 Indonesia
- 13.1.8 Phillipes
- 13.1.9 Singapore
- 13.1.10 Thailandc
- 13.1.11 Rest of Asia Pacific
- 14. South America Air Switchgear Industry Analysis, Insights and Forecast, 2019-2031
- 14.1. Market Analysis, Insights and Forecast - By Country/Sub-region
- 14.1.1 Brazil
- 14.1.2 Argentina
- 14.1.3 Peru
- 14.1.4 Chile
- 14.1.5 Colombia
- 14.1.6 Ecuador
- 14.1.7 Venezuela
- 14.1.8 Rest of South America
- 15. North America Air Switchgear Industry Analysis, Insights and Forecast, 2019-2031
- 15.1. Market Analysis, Insights and Forecast - By Country/Sub-region
- 15.1.1 United States
- 15.1.2 Canada
- 15.1.3 Mexico
- 16. MEA Air Switchgear Industry Analysis, Insights and Forecast, 2019-2031
- 16.1. Market Analysis, Insights and Forecast - By Country/Sub-region
- 16.1.1 United Arab Emirates
- 16.1.2 Saudi Arabia
- 16.1.3 South Africa
- 16.1.4 Rest of Middle East and Africa
- 17. Competitive Analysis
- 17.1. Global Market Share Analysis 2024
- 17.2. Company Profiles
- 17.2.1 Elatec Power Distribution GmbH
- 17.2.1.1. Overview
- 17.2.1.2. Products
- 17.2.1.3. SWOT Analysis
- 17.2.1.4. Recent Developments
- 17.2.1.5. Financials (Based on Availability)
- 17.2.2 ABB Ltd
- 17.2.2.1. Overview
- 17.2.2.2. Products
- 17.2.2.3. SWOT Analysis
- 17.2.2.4. Recent Developments
- 17.2.2.5. Financials (Based on Availability)
- 17.2.3 Alfanar Group
- 17.2.3.1. Overview
- 17.2.3.2. Products
- 17.2.3.3. SWOT Analysis
- 17.2.3.4. Recent Developments
- 17.2.3.5. Financials (Based on Availability)
- 17.2.4 Larsen & Toubro Limited
- 17.2.4.1. Overview
- 17.2.4.2. Products
- 17.2.4.3. SWOT Analysis
- 17.2.4.4. Recent Developments
- 17.2.4.5. Financials (Based on Availability)
- 17.2.5 Mitsubishi Electric Corporation
- 17.2.5.1. Overview
- 17.2.5.2. Products
- 17.2.5.3. SWOT Analysis
- 17.2.5.4. Recent Developments
- 17.2.5.5. Financials (Based on Availability)
- 17.2.6 Siemens AG
- 17.2.6.1. Overview
- 17.2.6.2. Products
- 17.2.6.3. SWOT Analysis
- 17.2.6.4. Recent Developments
- 17.2.6.5. Financials (Based on Availability)
- 17.2.7 Schneider Electric SE
- 17.2.7.1. Overview
- 17.2.7.2. Products
- 17.2.7.3. SWOT Analysis
- 17.2.7.4. Recent Developments
- 17.2.7.5. Financials (Based on Availability)
- 17.2.8 Eaton Corporation PLC
- 17.2.8.1. Overview
- 17.2.8.2. Products
- 17.2.8.3. SWOT Analysis
- 17.2.8.4. Recent Developments
- 17.2.8.5. Financials (Based on Availability)
- 17.2.9 Wenzhou Unisun Electric Co Ltd
- 17.2.9.1. Overview
- 17.2.9.2. Products
- 17.2.9.3. SWOT Analysis
- 17.2.9.4. Recent Developments
- 17.2.9.5. Financials (Based on Availability)
- 17.2.10 Tavrida Electric*List Not Exhaustive
- 17.2.10.1. Overview
- 17.2.10.2. Products
- 17.2.10.3. SWOT Analysis
- 17.2.10.4. Recent Developments
- 17.2.10.5. Financials (Based on Availability)
- 17.2.1 Elatec Power Distribution GmbH
List of Figures
- Figure 1: Global Air Switchgear Industry Revenue Breakdown (Million, %) by Region 2024 & 2032
- Figure 2: North America Air Switchgear Industry Revenue (Million), by Country 2024 & 2032
- Figure 3: North America Air Switchgear Industry Revenue Share (%), by Country 2024 & 2032
- Figure 4: Europe Air Switchgear Industry Revenue (Million), by Country 2024 & 2032
- Figure 5: Europe Air Switchgear Industry Revenue Share (%), by Country 2024 & 2032
- Figure 6: Asia Pacific Air Switchgear Industry Revenue (Million), by Country 2024 & 2032
- Figure 7: Asia Pacific Air Switchgear Industry Revenue Share (%), by Country 2024 & 2032
- Figure 8: South America Air Switchgear Industry Revenue (Million), by Country 2024 & 2032
- Figure 9: South America Air Switchgear Industry Revenue Share (%), by Country 2024 & 2032
- Figure 10: North America Air Switchgear Industry Revenue (Million), by Country 2024 & 2032
- Figure 11: North America Air Switchgear Industry Revenue Share (%), by Country 2024 & 2032
- Figure 12: MEA Air Switchgear Industry Revenue (Million), by Country 2024 & 2032
- Figure 13: MEA Air Switchgear Industry Revenue Share (%), by Country 2024 & 2032
- Figure 14: North America Air Switchgear Industry Revenue (Million), by Voltage Level 2024 & 2032
- Figure 15: North America Air Switchgear Industry Revenue Share (%), by Voltage Level 2024 & 2032
- Figure 16: North America Air Switchgear Industry Revenue (Million), by End-User 2024 & 2032
- Figure 17: North America Air Switchgear Industry Revenue Share (%), by End-User 2024 & 2032
- Figure 18: North America Air Switchgear Industry Revenue (Million), by Country 2024 & 2032
- Figure 19: North America Air Switchgear Industry Revenue Share (%), by Country 2024 & 2032
- Figure 20: Europe Air Switchgear Industry Revenue (Million), by Voltage Level 2024 & 2032
- Figure 21: Europe Air Switchgear Industry Revenue Share (%), by Voltage Level 2024 & 2032
- Figure 22: Europe Air Switchgear Industry Revenue (Million), by End-User 2024 & 2032
- Figure 23: Europe Air Switchgear Industry Revenue Share (%), by End-User 2024 & 2032
- Figure 24: Europe Air Switchgear Industry Revenue (Million), by Country 2024 & 2032
- Figure 25: Europe Air Switchgear Industry Revenue Share (%), by Country 2024 & 2032
- Figure 26: Asia Pacific Air Switchgear Industry Revenue (Million), by Voltage Level 2024 & 2032
- Figure 27: Asia Pacific Air Switchgear Industry Revenue Share (%), by Voltage Level 2024 & 2032
- Figure 28: Asia Pacific Air Switchgear Industry Revenue (Million), by End-User 2024 & 2032
- Figure 29: Asia Pacific Air Switchgear Industry Revenue Share (%), by End-User 2024 & 2032
- Figure 30: Asia Pacific Air Switchgear Industry Revenue (Million), by Country 2024 & 2032
- Figure 31: Asia Pacific Air Switchgear Industry Revenue Share (%), by Country 2024 & 2032
- Figure 32: South America Air Switchgear Industry Revenue (Million), by Voltage Level 2024 & 2032
- Figure 33: South America Air Switchgear Industry Revenue Share (%), by Voltage Level 2024 & 2032
- Figure 34: South America Air Switchgear Industry Revenue (Million), by End-User 2024 & 2032
- Figure 35: South America Air Switchgear Industry Revenue Share (%), by End-User 2024 & 2032
- Figure 36: South America Air Switchgear Industry Revenue (Million), by Country 2024 & 2032
- Figure 37: South America Air Switchgear Industry Revenue Share (%), by Country 2024 & 2032
- Figure 38: Middle East and Africa Air Switchgear Industry Revenue (Million), by Voltage Level 2024 & 2032
- Figure 39: Middle East and Africa Air Switchgear Industry Revenue Share (%), by Voltage Level 2024 & 2032
- Figure 40: Middle East and Africa Air Switchgear Industry Revenue (Million), by End-User 2024 & 2032
- Figure 41: Middle East and Africa Air Switchgear Industry Revenue Share (%), by End-User 2024 & 2032
- Figure 42: Middle East and Africa Air Switchgear Industry Revenue (Million), by Country 2024 & 2032
- Figure 43: Middle East and Africa Air Switchgear Industry Revenue Share (%), by Country 2024 & 2032
List of Tables
- Table 1: Global Air Switchgear Industry Revenue Million Forecast, by Region 2019 & 2032
- Table 2: Global Air Switchgear Industry Revenue Million Forecast, by Voltage Level 2019 & 2032
- Table 3: Global Air Switchgear Industry Revenue Million Forecast, by End-User 2019 & 2032
- Table 4: Global Air Switchgear Industry Revenue Million Forecast, by Region 2019 & 2032
- Table 5: Global Air Switchgear Industry Revenue Million Forecast, by Country 2019 & 2032
- Table 6: United States Air Switchgear Industry Revenue (Million) Forecast, by Application 2019 & 2032
- Table 7: Canada Air Switchgear Industry Revenue (Million) Forecast, by Application 2019 & 2032
- Table 8: Mexico Air Switchgear Industry Revenue (Million) Forecast, by Application 2019 & 2032
- Table 9: Global Air Switchgear Industry Revenue Million Forecast, by Country 2019 & 2032
- Table 10: Germany Air Switchgear Industry Revenue (Million) Forecast, by Application 2019 & 2032
- Table 11: United Kingdom Air Switchgear Industry Revenue (Million) Forecast, by Application 2019 & 2032
- Table 12: France Air Switchgear Industry Revenue (Million) Forecast, by Application 2019 & 2032
- Table 13: Spain Air Switchgear Industry Revenue (Million) Forecast, by Application 2019 & 2032
- Table 14: Italy Air Switchgear Industry Revenue (Million) Forecast, by Application 2019 & 2032
- Table 15: Spain Air Switchgear Industry Revenue (Million) Forecast, by Application 2019 & 2032
- Table 16: Belgium Air Switchgear Industry Revenue (Million) Forecast, by Application 2019 & 2032
- Table 17: Netherland Air Switchgear Industry Revenue (Million) Forecast, by Application 2019 & 2032
- Table 18: Nordics Air Switchgear Industry Revenue (Million) Forecast, by Application 2019 & 2032
- Table 19: Rest of Europe Air Switchgear Industry Revenue (Million) Forecast, by Application 2019 & 2032
- Table 20: Global Air Switchgear Industry Revenue Million Forecast, by Country 2019 & 2032
- Table 21: China Air Switchgear Industry Revenue (Million) Forecast, by Application 2019 & 2032
- Table 22: Japan Air Switchgear Industry Revenue (Million) Forecast, by Application 2019 & 2032
- Table 23: India Air Switchgear Industry Revenue (Million) Forecast, by Application 2019 & 2032
- Table 24: South Korea Air Switchgear Industry Revenue (Million) Forecast, by Application 2019 & 2032
- Table 25: Southeast Asia Air Switchgear Industry Revenue (Million) Forecast, by Application 2019 & 2032
- Table 26: Australia Air Switchgear Industry Revenue (Million) Forecast, by Application 2019 & 2032
- Table 27: Indonesia Air Switchgear Industry Revenue (Million) Forecast, by Application 2019 & 2032
- Table 28: Phillipes Air Switchgear Industry Revenue (Million) Forecast, by Application 2019 & 2032
- Table 29: Singapore Air Switchgear Industry Revenue (Million) Forecast, by Application 2019 & 2032
- Table 30: Thailandc Air Switchgear Industry Revenue (Million) Forecast, by Application 2019 & 2032
- Table 31: Rest of Asia Pacific Air Switchgear Industry Revenue (Million) Forecast, by Application 2019 & 2032
- Table 32: Global Air Switchgear Industry Revenue Million Forecast, by Country 2019 & 2032
- Table 33: Brazil Air Switchgear Industry Revenue (Million) Forecast, by Application 2019 & 2032
- Table 34: Argentina Air Switchgear Industry Revenue (Million) Forecast, by Application 2019 & 2032
- Table 35: Peru Air Switchgear Industry Revenue (Million) Forecast, by Application 2019 & 2032
- Table 36: Chile Air Switchgear Industry Revenue (Million) Forecast, by Application 2019 & 2032
- Table 37: Colombia Air Switchgear Industry Revenue (Million) Forecast, by Application 2019 & 2032
- Table 38: Ecuador Air Switchgear Industry Revenue (Million) Forecast, by Application 2019 & 2032
- Table 39: Venezuela Air Switchgear Industry Revenue (Million) Forecast, by Application 2019 & 2032
- Table 40: Rest of South America Air Switchgear Industry Revenue (Million) Forecast, by Application 2019 & 2032
- Table 41: Global Air Switchgear Industry Revenue Million Forecast, by Country 2019 & 2032
- Table 42: United States Air Switchgear Industry Revenue (Million) Forecast, by Application 2019 & 2032
- Table 43: Canada Air Switchgear Industry Revenue (Million) Forecast, by Application 2019 & 2032
- Table 44: Mexico Air Switchgear Industry Revenue (Million) Forecast, by Application 2019 & 2032
- Table 45: Global Air Switchgear Industry Revenue Million Forecast, by Country 2019 & 2032
- Table 46: United Arab Emirates Air Switchgear Industry Revenue (Million) Forecast, by Application 2019 & 2032
- Table 47: Saudi Arabia Air Switchgear Industry Revenue (Million) Forecast, by Application 2019 & 2032
- Table 48: South Africa Air Switchgear Industry Revenue (Million) Forecast, by Application 2019 & 2032
- Table 49: Rest of Middle East and Africa Air Switchgear Industry Revenue (Million) Forecast, by Application 2019 & 2032
- Table 50: Global Air Switchgear Industry Revenue Million Forecast, by Voltage Level 2019 & 2032
- Table 51: Global Air Switchgear Industry Revenue Million Forecast, by End-User 2019 & 2032
- Table 52: Global Air Switchgear Industry Revenue Million Forecast, by Country 2019 & 2032
- Table 53: Global Air Switchgear Industry Revenue Million Forecast, by Voltage Level 2019 & 2032
- Table 54: Global Air Switchgear Industry Revenue Million Forecast, by End-User 2019 & 2032
- Table 55: Global Air Switchgear Industry Revenue Million Forecast, by Country 2019 & 2032
- Table 56: Global Air Switchgear Industry Revenue Million Forecast, by Voltage Level 2019 & 2032
- Table 57: Global Air Switchgear Industry Revenue Million Forecast, by End-User 2019 & 2032
- Table 58: Global Air Switchgear Industry Revenue Million Forecast, by Country 2019 & 2032
- Table 59: Global Air Switchgear Industry Revenue Million Forecast, by Voltage Level 2019 & 2032
- Table 60: Global Air Switchgear Industry Revenue Million Forecast, by End-User 2019 & 2032
- Table 61: Global Air Switchgear Industry Revenue Million Forecast, by Country 2019 & 2032
- Table 62: Global Air Switchgear Industry Revenue Million Forecast, by Voltage Level 2019 & 2032
- Table 63: Global Air Switchgear Industry Revenue Million Forecast, by End-User 2019 & 2032
- Table 64: Global Air Switchgear Industry Revenue Million Forecast, by Country 2019 & 2032
Frequently Asked Questions
1. What is the projected Compound Annual Growth Rate (CAGR) of the Air Switchgear Industry?
The projected CAGR is approximately > 4.00%.
2. Which companies are prominent players in the Air Switchgear Industry?
Key companies in the market include Elatec Power Distribution GmbH, ABB Ltd, Alfanar Group, Larsen & Toubro Limited, Mitsubishi Electric Corporation, Siemens AG, Schneider Electric SE, Eaton Corporation PLC, Wenzhou Unisun Electric Co Ltd, Tavrida Electric*List Not Exhaustive.
3. What are the main segments of the Air Switchgear Industry?
The market segments include Voltage Level, End-User.
4. Can you provide details about the market size?
The market size is estimated to be USD XX Million as of 2022.
5. What are some drivers contributing to market growth?
4.; Increasing Integration Of Renewable Energy Generation4.; Aging Power Grids And Investments In Transmission And Distribution Infrastructure.
6. What are the notable trends driving market growth?
Power Utilities Segment to Witness Significant Demand.
7. Are there any restraints impacting market growth?
4.; Lack Of Investor Confidence Due To Sociopolitical Instability In Some Countries.
8. Can you provide examples of recent developments in the market?
In August 2021, Schneider Electric launched GenieEvo Connected, a comprehensive, reliable switchgear range with unparalleled connectivity for asset health monitoring. GenieEvo connected, setting a new standard for primary air-insulated switchgear completely with 24/7 cloud-based service for efficient maintenance.
9. What pricing options are available for accessing the report?
Pricing options include single-user, multi-user, and enterprise licenses priced at USD 4750, USD 5250, and USD 8750 respectively.
10. Is the market size provided in terms of value or volume?
The market size is provided in terms of value, measured in Million.
11. Are there any specific market keywords associated with the report?
Yes, the market keyword associated with the report is "Air Switchgear Industry," which aids in identifying and referencing the specific market segment covered.
12. How do I determine which pricing option suits my needs best?
The pricing options vary based on user requirements and access needs. Individual users may opt for single-user licenses, while businesses requiring broader access may choose multi-user or enterprise licenses for cost-effective access to the report.
13. Are there any additional resources or data provided in the Air Switchgear Industry report?
While the report offers comprehensive insights, it's advisable to review the specific contents or supplementary materials provided to ascertain if additional resources or data are available.
14. How can I stay updated on further developments or reports in the Air Switchgear Industry?
To stay informed about further developments, trends, and reports in the Air Switchgear Industry, consider subscribing to industry newsletters, following relevant companies and organizations, or regularly checking reputable industry news sources and publications.
Methodology
Step 1 - Identification of Relevant Samples Size from Population Database


Step 2 - Approaches for Defining Global Market Size (Value, Volume* & Price*)

Note*: In applicable scenarios
Step 3 - Data Sources
Primary Research
- Web Analytics
- Survey Reports
- Research Institute
- Latest Research Reports
- Opinion Leaders
Secondary Research
- Annual Reports
- White Paper
- Latest Press Release
- Industry Association
- Paid Database
- Investor Presentations

Step 4 - Data Triangulation
Involves using different sources of information in order to increase the validity of a study
These sources are likely to be stakeholders in a program - participants, other researchers, program staff, other community members, and so on.
Then we put all data in single framework & apply various statistical tools to find out the dynamic on the market.
During the analysis stage, feedback from the stakeholder groups would be compared to determine areas of agreement as well as areas of divergence
