

Key Insights
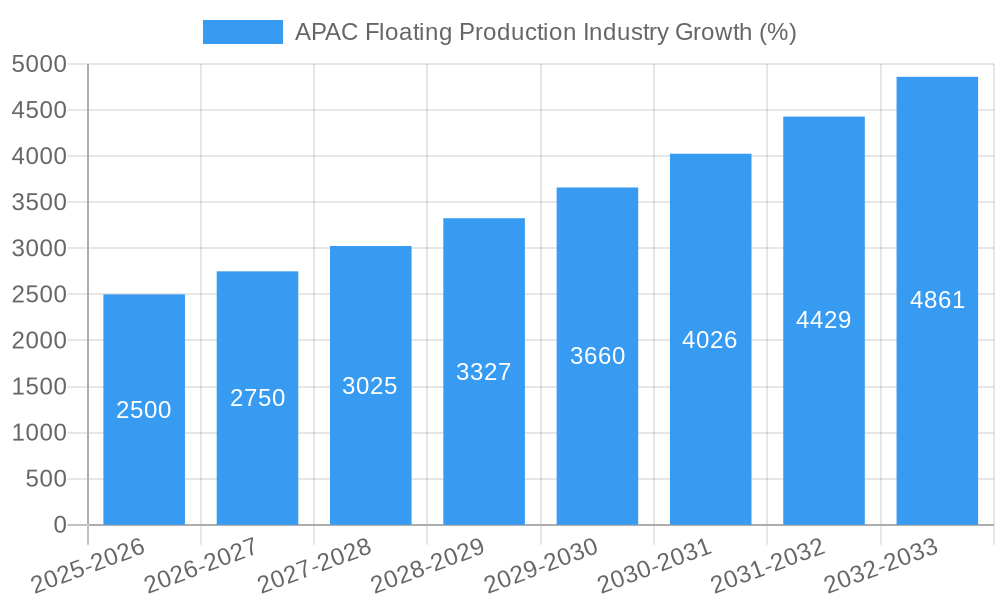
The Asia-Pacific (APAC) floating production industry is experiencing robust growth, driven by increasing offshore oil and gas exploration and production activities in deepwater regions. The region's vast reserves, coupled with technological advancements in floating production systems (FPSOs, TLPs, SPARs, etc.), are fueling this expansion. A Compound Annual Growth Rate (CAGR) exceeding 10% suggests a significant market expansion over the forecast period (2025-2033). Key drivers include rising energy demand, government initiatives promoting energy independence, and the exploration of challenging deepwater fields. China, India, and Southeast Asian nations are major contributors to this growth, with significant investments in infrastructure and technological capabilities. While high capital expenditures and regulatory hurdles pose challenges, the long-term prospects for the APAC floating production market remain exceptionally positive. The segmentation by water depth (shallow, deep, ultra-deep) reveals a strong focus on deepwater projects, reflecting the technological prowess and resource potential in the region. Major players like MODEC, Samsung Heavy Industries, and Keppel Offshore & Marine are strategically positioned to capitalize on this growth, through collaborations and technological innovations.
The consistent demand for energy, particularly in rapidly developing APAC economies, ensures a sustained market for floating production solutions. However, the industry must navigate environmental regulations and sustainability concerns, integrating eco-friendly technologies and practices into their operations. The competitive landscape is characterized by both established international players and regional companies, leading to price competitiveness and technological innovation. Specific growth within countries like Indonesia, Philippines, and Vietnam is expected to be particularly strong, reflecting both exploration successes and government support for domestic energy production. The forecast period's growth is projected to be fueled by both new project developments and the lifecycle extension of existing assets, highlighting the enduring nature of this industry in the APAC region.

APAC Floating Production Industry: Market Report 2019-2033
This comprehensive report provides an in-depth analysis of the Asia-Pacific (APAC) floating production industry, covering the period 2019-2033. It offers invaluable insights into market dynamics, growth trends, key players, and future opportunities for industry professionals, investors, and strategic decision-makers. The report segments the market by type (FPSO, Tension Leg Platform, SPAR, Barge) and water depth (Shallow Water, Deepwater, Ultra-Deepwater), providing a granular view of this dynamic sector. Market size is presented in Million USD.
APAC Floating Production Industry Market Dynamics & Structure
The APAC floating production industry is characterized by a moderately concentrated market with significant regional variations. Key drivers include rising energy demand, exploration in deeper waters, and technological advancements in floating production systems. Regulatory frameworks vary across nations, impacting investment decisions and operational procedures. The industry faces competition from alternative energy sources and faces challenges in navigating environmental regulations. M&A activity has been relatively robust, with a notable increase in strategic partnerships and acquisitions during the historical period (2019-2024), totaling approximately xx Million USD in deal value.
- Market Concentration: Moderately concentrated, with top 5 players holding approximately xx% market share in 2025.
- Technological Innovation: Driven by advancements in subsea technologies, automation, and digitalization, facing challenges in cost reduction and standardization.
- Regulatory Landscape: Varies significantly across APAC nations, impacting project timelines and operational costs.
- Competitive Substitutes: Renewables and onshore resources pose long-term competitive pressure, with a predicted xx% market share erosion by 2033.
- End-User Demographics: Primarily driven by national oil companies (NOCs) and international oil companies (IOCs) with a focus on offshore gas development.
- M&A Trends: Strategic acquisitions and joint ventures are common, driven by the need for technological expertise and access to resources.
APAC Floating Production Industry Growth Trends & Insights
The APAC floating production market experienced substantial growth during the historical period (2019-2024), driven primarily by increasing energy demand and exploration in deepwater fields. The market size reached xx Million USD in 2024 and is projected to reach xx Million USD by 2025, exhibiting a Compound Annual Growth Rate (CAGR) of xx% during the forecast period (2025-2033). This growth is fueled by technological advancements enabling exploration and production in previously inaccessible areas and significant investments in offshore infrastructure. The adoption rate of advanced technologies, such as remote operations and autonomous systems, is steadily increasing, driving operational efficiency and reducing costs. Shifting consumer preferences towards cleaner energy sources present both challenges and opportunities for market diversification.
Dominant Regions, Countries, or Segments in APAC Floating Production Industry
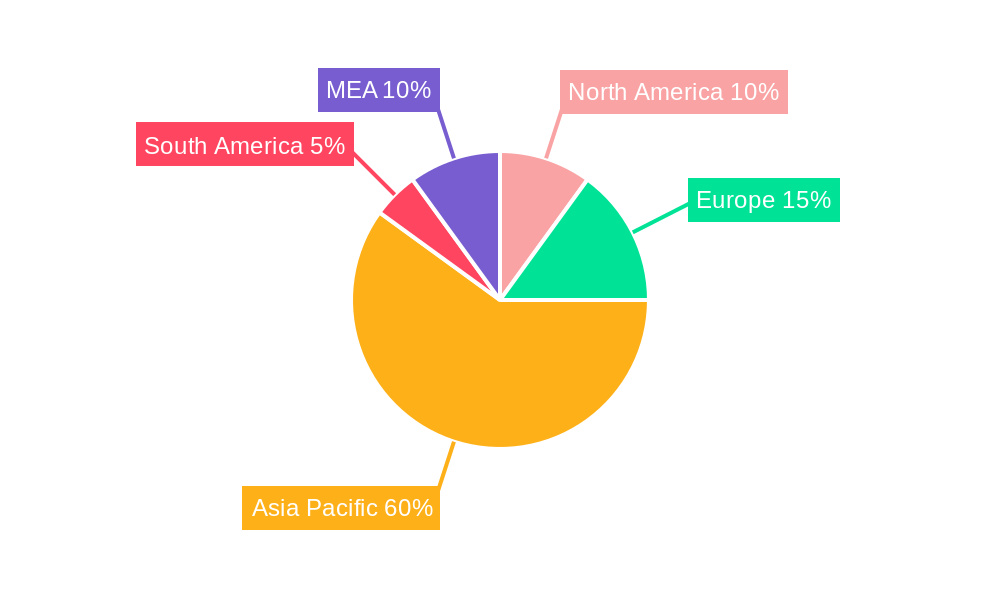
Southeast Asia, particularly Malaysia and Indonesia, dominates the APAC floating production market, accounting for approximately xx% of the total market share in 2025. This dominance is attributed to extensive offshore reserves, favorable government policies, and well-established infrastructure. The FPSO segment represents the largest share (xx%), driven by its versatility and suitability for various water depths and reservoir types. Deepwater projects are experiencing significant growth, due to discoveries in deeper waters, while Shallow water projects show a comparatively slower growth rate.
- Key Drivers (Southeast Asia): Abundant offshore oil and gas reserves, supportive government policies and incentives, existing infrastructure and skilled workforce.
- Dominance Factors (FPSO): Versatility, cost-effectiveness compared to other floating production systems, and suitability for various water depths.
- Growth Potential (Deepwater): Significant unexplored reserves and technological advancements enabling efficient deepwater operations.
APAC Floating Production Industry Product Landscape
The APAC floating production industry showcases continuous product innovation, with advancements in hull design, mooring systems, and subsea processing technologies. FPSOs are increasingly incorporating features like improved oil and gas processing capacity, enhanced environmental protection systems, and advanced automation technologies. These improvements lead to increased efficiency, reduced operational costs, and minimized environmental impact. The unique selling propositions focus on maximizing resource recovery, minimizing environmental footprint, and enhancing operational safety.
Key Drivers, Barriers & Challenges in APAC Floating Production Industry
Key Drivers:
- Rising energy demand in the region.
- Exploration and production in deepwater and ultra-deepwater fields.
- Technological advancements, leading to more efficient and cost-effective operations.
- Government support and investment in offshore energy infrastructure.
Challenges & Restraints:
- High capital expenditure and operational costs associated with floating production systems.
- Environmental regulations and concerns regarding emissions and potential ecological impacts.
- Geopolitical risks and uncertainties in some regions.
- Skilled labor shortages.
- Fluctuations in oil and gas prices. Predicted impact: xx% reduction in investments during periods of low prices.
Emerging Opportunities in APAP Floating Production Industry
- Growth in offshore gas production, driven by rising demand for natural gas.
- Development of innovative floating production solutions tailored to specific reservoir conditions and environmental requirements.
- Expansion into new markets and exploration of previously untapped resources in the region.
- Focus on renewable energy integration with floating platforms.
Growth Accelerators in the APAC Floating Production Industry
Technological breakthroughs in subsea technologies, automation, and data analytics are driving efficiency gains and cost reductions. Strategic partnerships between oil companies, technology providers, and EPC contractors are crucial for successful project execution. Market expansion into new regions and the development of specialized solutions for specific reservoir types offer significant growth potential.
Key Players Shaping the APAC Floating Production Industry Market
- MODEC Inc
- Malaysia Marine and Heavy Engineering SDN BHD
- Keppel Offshore and Marine Ltd
- SBM Offshore N V
- Samsung Heavy Industries Co Ltd
- Teekay Corporation
- Hyundai Heavy Industries Co Ltd
- TechnipFMC PLC
- Bumi Armada Berhad
- Mitsubishi Heavy Industries Ltd
Notable Milestones in APAC Floating Production Industry Sector
- 2020: Successful deployment of a new generation FPSO incorporating advanced automation technology in the Malay Basin.
- 2022: Announcement of a major joint venture to develop a deepwater gas field off the coast of Vietnam.
- 2023: Launch of a new SPAR platform designed for harsh environmental conditions in the South China Sea.
- 2024: Completion of a large-scale M&A deal involving two major players in the Indonesian floating production market.
In-Depth APAC Floating Production Industry Market Outlook
The APAC floating production industry is poised for sustained growth driven by increasing energy demand, exploration in deeper waters, and technological advancements. Opportunities abound in offshore gas development, innovation in floating production systems, and expansion into new markets. Strategic partnerships and investment in advanced technologies will be essential for companies to capitalize on this growth potential and navigate the challenges presented by environmental regulations and fluctuating energy prices. The focus on sustainability and reducing carbon footprint will also shape future investment decisions.
APAC Floating Production Industry Segmentation
-
1. Type
- 1.1. FPSO
- 1.2. Tension Leg Platform
- 1.3. SPAR
- 1.4. Barge
-
2. Water Depth
- 2.1. Shallow Water
- 2.2. Deepwater and Ultra-Deepwater
-
3. Geography
- 3.1. China
- 3.2. Australia
- 3.3. India
- 3.4. Malaysia
- 3.5. Rest of Asia-Pacific
APAC Floating Production Industry Segmentation By Geography
- 1. China
- 2. Australia
- 3. India
- 4. Malaysia
- 5. Rest of Asia Pacific
APAC Floating Production Industry REPORT HIGHLIGHTS
| Aspects | Details |
|---|---|
| Study Period | 2019-2033 |
| Base Year | 2024 |
| Estimated Year | 2025 |
| Forecast Period | 2025-2033 |
| Historical Period | 2019-2024 |
| Growth Rate | CAGR of > 10.00% from 2019-2033 |
| Segmentation |
|
Table of Contents
- 1. Introduction
- 1.1. Research Scope
- 1.2. Market Segmentation
- 1.3. Research Methodology
- 1.4. Definitions and Assumptions
- 2. Executive Summary
- 2.1. Introduction
- 3. Market Dynamics
- 3.1. Introduction
- 3.2. Market Drivers
- 3.2.1. 4.; An Increase in the Use of LNG as an Energy Source
- 3.3. Market Restrains
- 3.3.1. 4.; Increasing Adoption of Solar and Wind Energy
- 3.4. Market Trends
- 3.4.1 Floating Production
- 3.4.2 Storage and Offloading (FPSO) to Dominate the Market
- 4. Market Factor Analysis
- 4.1. Porters Five Forces
- 4.2. Supply/Value Chain
- 4.3. PESTEL analysis
- 4.4. Market Entropy
- 4.5. Patent/Trademark Analysis
- 5. Global APAC Floating Production Industry Analysis, Insights and Forecast, 2019-2031
- 5.1. Market Analysis, Insights and Forecast - by Type
- 5.1.1. FPSO
- 5.1.2. Tension Leg Platform
- 5.1.3. SPAR
- 5.1.4. Barge
- 5.2. Market Analysis, Insights and Forecast - by Water Depth
- 5.2.1. Shallow Water
- 5.2.2. Deepwater and Ultra-Deepwater
- 5.3. Market Analysis, Insights and Forecast - by Geography
- 5.3.1. China
- 5.3.2. Australia
- 5.3.3. India
- 5.3.4. Malaysia
- 5.3.5. Rest of Asia-Pacific
- 5.4. Market Analysis, Insights and Forecast - by Region
- 5.4.1. China
- 5.4.2. Australia
- 5.4.3. India
- 5.4.4. Malaysia
- 5.4.5. Rest of Asia Pacific
- 5.1. Market Analysis, Insights and Forecast - by Type
- 6. China APAC Floating Production Industry Analysis, Insights and Forecast, 2019-2031
- 6.1. Market Analysis, Insights and Forecast - by Type
- 6.1.1. FPSO
- 6.1.2. Tension Leg Platform
- 6.1.3. SPAR
- 6.1.4. Barge
- 6.2. Market Analysis, Insights and Forecast - by Water Depth
- 6.2.1. Shallow Water
- 6.2.2. Deepwater and Ultra-Deepwater
- 6.3. Market Analysis, Insights and Forecast - by Geography
- 6.3.1. China
- 6.3.2. Australia
- 6.3.3. India
- 6.3.4. Malaysia
- 6.3.5. Rest of Asia-Pacific
- 6.1. Market Analysis, Insights and Forecast - by Type
- 7. Australia APAC Floating Production Industry Analysis, Insights and Forecast, 2019-2031
- 7.1. Market Analysis, Insights and Forecast - by Type
- 7.1.1. FPSO
- 7.1.2. Tension Leg Platform
- 7.1.3. SPAR
- 7.1.4. Barge
- 7.2. Market Analysis, Insights and Forecast - by Water Depth
- 7.2.1. Shallow Water
- 7.2.2. Deepwater and Ultra-Deepwater
- 7.3. Market Analysis, Insights and Forecast - by Geography
- 7.3.1. China
- 7.3.2. Australia
- 7.3.3. India
- 7.3.4. Malaysia
- 7.3.5. Rest of Asia-Pacific
- 7.1. Market Analysis, Insights and Forecast - by Type
- 8. India APAC Floating Production Industry Analysis, Insights and Forecast, 2019-2031
- 8.1. Market Analysis, Insights and Forecast - by Type
- 8.1.1. FPSO
- 8.1.2. Tension Leg Platform
- 8.1.3. SPAR
- 8.1.4. Barge
- 8.2. Market Analysis, Insights and Forecast - by Water Depth
- 8.2.1. Shallow Water
- 8.2.2. Deepwater and Ultra-Deepwater
- 8.3. Market Analysis, Insights and Forecast - by Geography
- 8.3.1. China
- 8.3.2. Australia
- 8.3.3. India
- 8.3.4. Malaysia
- 8.3.5. Rest of Asia-Pacific
- 8.1. Market Analysis, Insights and Forecast - by Type
- 9. Malaysia APAC Floating Production Industry Analysis, Insights and Forecast, 2019-2031
- 9.1. Market Analysis, Insights and Forecast - by Type
- 9.1.1. FPSO
- 9.1.2. Tension Leg Platform
- 9.1.3. SPAR
- 9.1.4. Barge
- 9.2. Market Analysis, Insights and Forecast - by Water Depth
- 9.2.1. Shallow Water
- 9.2.2. Deepwater and Ultra-Deepwater
- 9.3. Market Analysis, Insights and Forecast - by Geography
- 9.3.1. China
- 9.3.2. Australia
- 9.3.3. India
- 9.3.4. Malaysia
- 9.3.5. Rest of Asia-Pacific
- 9.1. Market Analysis, Insights and Forecast - by Type
- 10. Rest of Asia Pacific APAC Floating Production Industry Analysis, Insights and Forecast, 2019-2031
- 10.1. Market Analysis, Insights and Forecast - by Type
- 10.1.1. FPSO
- 10.1.2. Tension Leg Platform
- 10.1.3. SPAR
- 10.1.4. Barge
- 10.2. Market Analysis, Insights and Forecast - by Water Depth
- 10.2.1. Shallow Water
- 10.2.2. Deepwater and Ultra-Deepwater
- 10.3. Market Analysis, Insights and Forecast - by Geography
- 10.3.1. China
- 10.3.2. Australia
- 10.3.3. India
- 10.3.4. Malaysia
- 10.3.5. Rest of Asia-Pacific
- 10.1. Market Analysis, Insights and Forecast - by Type
- 11. North America APAC Floating Production Industry Analysis, Insights and Forecast, 2019-2031
- 11.1. Market Analysis, Insights and Forecast - By Country/Sub-region
- 11.1.1 United States
- 11.1.2 Canada
- 11.1.3 Mexico
- 12. Europe APAC Floating Production Industry Analysis, Insights and Forecast, 2019-2031
- 12.1. Market Analysis, Insights and Forecast - By Country/Sub-region
- 12.1.1 Germany
- 12.1.2 United Kingdom
- 12.1.3 France
- 12.1.4 Spain
- 12.1.5 Italy
- 12.1.6 Spain
- 12.1.7 Belgium
- 12.1.8 Netherland
- 12.1.9 Nordics
- 12.1.10 Rest of Europe
- 13. Asia Pacific APAC Floating Production Industry Analysis, Insights and Forecast, 2019-2031
- 13.1. Market Analysis, Insights and Forecast - By Country/Sub-region
- 13.1.1 China
- 13.1.2 Japan
- 13.1.3 India
- 13.1.4 South Korea
- 13.1.5 Southeast Asia
- 13.1.6 Australia
- 13.1.7 Indonesia
- 13.1.8 Phillipes
- 13.1.9 Singapore
- 13.1.10 Thailandc
- 13.1.11 Rest of Asia Pacific
- 14. South America APAC Floating Production Industry Analysis, Insights and Forecast, 2019-2031
- 14.1. Market Analysis, Insights and Forecast - By Country/Sub-region
- 14.1.1 Brazil
- 14.1.2 Argentina
- 14.1.3 Peru
- 14.1.4 Chile
- 14.1.5 Colombia
- 14.1.6 Ecuador
- 14.1.7 Venezuela
- 14.1.8 Rest of South America
- 15. MEA APAC Floating Production Industry Analysis, Insights and Forecast, 2019-2031
- 15.1. Market Analysis, Insights and Forecast - By Country/Sub-region
- 15.1.1 United Arab Emirates
- 15.1.2 Saudi Arabia
- 15.1.3 South Africa
- 15.1.4 Rest of Middle East and Africa
- 16. Competitive Analysis
- 16.1. Global Market Share Analysis 2024
- 16.2. Company Profiles
- 16.2.1 MODEC Inc
- 16.2.1.1. Overview
- 16.2.1.2. Products
- 16.2.1.3. SWOT Analysis
- 16.2.1.4. Recent Developments
- 16.2.1.5. Financials (Based on Availability)
- 16.2.2 Malaysia Marine and Heavy Engineering SDN BHD
- 16.2.2.1. Overview
- 16.2.2.2. Products
- 16.2.2.3. SWOT Analysis
- 16.2.2.4. Recent Developments
- 16.2.2.5. Financials (Based on Availability)
- 16.2.3 Keppel Offshore and Marine Ltd
- 16.2.3.1. Overview
- 16.2.3.2. Products
- 16.2.3.3. SWOT Analysis
- 16.2.3.4. Recent Developments
- 16.2.3.5. Financials (Based on Availability)
- 16.2.4 SBM Offshore N V
- 16.2.4.1. Overview
- 16.2.4.2. Products
- 16.2.4.3. SWOT Analysis
- 16.2.4.4. Recent Developments
- 16.2.4.5. Financials (Based on Availability)
- 16.2.5 Samsung Heavy Industries Co Ltd
- 16.2.5.1. Overview
- 16.2.5.2. Products
- 16.2.5.3. SWOT Analysis
- 16.2.5.4. Recent Developments
- 16.2.5.5. Financials (Based on Availability)
- 16.2.6 Teekay Corporation
- 16.2.6.1. Overview
- 16.2.6.2. Products
- 16.2.6.3. SWOT Analysis
- 16.2.6.4. Recent Developments
- 16.2.6.5. Financials (Based on Availability)
- 16.2.7 Hyundai Heavy Industries Co Ltd
- 16.2.7.1. Overview
- 16.2.7.2. Products
- 16.2.7.3. SWOT Analysis
- 16.2.7.4. Recent Developments
- 16.2.7.5. Financials (Based on Availability)
- 16.2.8 TechnipFMC PLC
- 16.2.8.1. Overview
- 16.2.8.2. Products
- 16.2.8.3. SWOT Analysis
- 16.2.8.4. Recent Developments
- 16.2.8.5. Financials (Based on Availability)
- 16.2.9 Bumi Armada Berhad
- 16.2.9.1. Overview
- 16.2.9.2. Products
- 16.2.9.3. SWOT Analysis
- 16.2.9.4. Recent Developments
- 16.2.9.5. Financials (Based on Availability)
- 16.2.10 Mitsubishi Heavy Industries Ltd
- 16.2.10.1. Overview
- 16.2.10.2. Products
- 16.2.10.3. SWOT Analysis
- 16.2.10.4. Recent Developments
- 16.2.10.5. Financials (Based on Availability)
- 16.2.1 MODEC Inc
List of Figures
- Figure 1: Global APAC Floating Production Industry Revenue Breakdown (Million, %) by Region 2024 & 2032
- Figure 2: North America APAC Floating Production Industry Revenue (Million), by Country 2024 & 2032
- Figure 3: North America APAC Floating Production Industry Revenue Share (%), by Country 2024 & 2032
- Figure 4: Europe APAC Floating Production Industry Revenue (Million), by Country 2024 & 2032
- Figure 5: Europe APAC Floating Production Industry Revenue Share (%), by Country 2024 & 2032
- Figure 6: Asia Pacific APAC Floating Production Industry Revenue (Million), by Country 2024 & 2032
- Figure 7: Asia Pacific APAC Floating Production Industry Revenue Share (%), by Country 2024 & 2032
- Figure 8: South America APAC Floating Production Industry Revenue (Million), by Country 2024 & 2032
- Figure 9: South America APAC Floating Production Industry Revenue Share (%), by Country 2024 & 2032
- Figure 10: MEA APAC Floating Production Industry Revenue (Million), by Country 2024 & 2032
- Figure 11: MEA APAC Floating Production Industry Revenue Share (%), by Country 2024 & 2032
- Figure 12: China APAC Floating Production Industry Revenue (Million), by Type 2024 & 2032
- Figure 13: China APAC Floating Production Industry Revenue Share (%), by Type 2024 & 2032
- Figure 14: China APAC Floating Production Industry Revenue (Million), by Water Depth 2024 & 2032
- Figure 15: China APAC Floating Production Industry Revenue Share (%), by Water Depth 2024 & 2032
- Figure 16: China APAC Floating Production Industry Revenue (Million), by Geography 2024 & 2032
- Figure 17: China APAC Floating Production Industry Revenue Share (%), by Geography 2024 & 2032
- Figure 18: China APAC Floating Production Industry Revenue (Million), by Country 2024 & 2032
- Figure 19: China APAC Floating Production Industry Revenue Share (%), by Country 2024 & 2032
- Figure 20: Australia APAC Floating Production Industry Revenue (Million), by Type 2024 & 2032
- Figure 21: Australia APAC Floating Production Industry Revenue Share (%), by Type 2024 & 2032
- Figure 22: Australia APAC Floating Production Industry Revenue (Million), by Water Depth 2024 & 2032
- Figure 23: Australia APAC Floating Production Industry Revenue Share (%), by Water Depth 2024 & 2032
- Figure 24: Australia APAC Floating Production Industry Revenue (Million), by Geography 2024 & 2032
- Figure 25: Australia APAC Floating Production Industry Revenue Share (%), by Geography 2024 & 2032
- Figure 26: Australia APAC Floating Production Industry Revenue (Million), by Country 2024 & 2032
- Figure 27: Australia APAC Floating Production Industry Revenue Share (%), by Country 2024 & 2032
- Figure 28: India APAC Floating Production Industry Revenue (Million), by Type 2024 & 2032
- Figure 29: India APAC Floating Production Industry Revenue Share (%), by Type 2024 & 2032
- Figure 30: India APAC Floating Production Industry Revenue (Million), by Water Depth 2024 & 2032
- Figure 31: India APAC Floating Production Industry Revenue Share (%), by Water Depth 2024 & 2032
- Figure 32: India APAC Floating Production Industry Revenue (Million), by Geography 2024 & 2032
- Figure 33: India APAC Floating Production Industry Revenue Share (%), by Geography 2024 & 2032
- Figure 34: India APAC Floating Production Industry Revenue (Million), by Country 2024 & 2032
- Figure 35: India APAC Floating Production Industry Revenue Share (%), by Country 2024 & 2032
- Figure 36: Malaysia APAC Floating Production Industry Revenue (Million), by Type 2024 & 2032
- Figure 37: Malaysia APAC Floating Production Industry Revenue Share (%), by Type 2024 & 2032
- Figure 38: Malaysia APAC Floating Production Industry Revenue (Million), by Water Depth 2024 & 2032
- Figure 39: Malaysia APAC Floating Production Industry Revenue Share (%), by Water Depth 2024 & 2032
- Figure 40: Malaysia APAC Floating Production Industry Revenue (Million), by Geography 2024 & 2032
- Figure 41: Malaysia APAC Floating Production Industry Revenue Share (%), by Geography 2024 & 2032
- Figure 42: Malaysia APAC Floating Production Industry Revenue (Million), by Country 2024 & 2032
- Figure 43: Malaysia APAC Floating Production Industry Revenue Share (%), by Country 2024 & 2032
- Figure 44: Rest of Asia Pacific APAC Floating Production Industry Revenue (Million), by Type 2024 & 2032
- Figure 45: Rest of Asia Pacific APAC Floating Production Industry Revenue Share (%), by Type 2024 & 2032
- Figure 46: Rest of Asia Pacific APAC Floating Production Industry Revenue (Million), by Water Depth 2024 & 2032
- Figure 47: Rest of Asia Pacific APAC Floating Production Industry Revenue Share (%), by Water Depth 2024 & 2032
- Figure 48: Rest of Asia Pacific APAC Floating Production Industry Revenue (Million), by Geography 2024 & 2032
- Figure 49: Rest of Asia Pacific APAC Floating Production Industry Revenue Share (%), by Geography 2024 & 2032
- Figure 50: Rest of Asia Pacific APAC Floating Production Industry Revenue (Million), by Country 2024 & 2032
- Figure 51: Rest of Asia Pacific APAC Floating Production Industry Revenue Share (%), by Country 2024 & 2032
List of Tables
- Table 1: Global APAC Floating Production Industry Revenue Million Forecast, by Region 2019 & 2032
- Table 2: Global APAC Floating Production Industry Revenue Million Forecast, by Type 2019 & 2032
- Table 3: Global APAC Floating Production Industry Revenue Million Forecast, by Water Depth 2019 & 2032
- Table 4: Global APAC Floating Production Industry Revenue Million Forecast, by Geography 2019 & 2032
- Table 5: Global APAC Floating Production Industry Revenue Million Forecast, by Region 2019 & 2032
- Table 6: Global APAC Floating Production Industry Revenue Million Forecast, by Country 2019 & 2032
- Table 7: United States APAC Floating Production Industry Revenue (Million) Forecast, by Application 2019 & 2032
- Table 8: Canada APAC Floating Production Industry Revenue (Million) Forecast, by Application 2019 & 2032
- Table 9: Mexico APAC Floating Production Industry Revenue (Million) Forecast, by Application 2019 & 2032
- Table 10: Global APAC Floating Production Industry Revenue Million Forecast, by Country 2019 & 2032
- Table 11: Germany APAC Floating Production Industry Revenue (Million) Forecast, by Application 2019 & 2032
- Table 12: United Kingdom APAC Floating Production Industry Revenue (Million) Forecast, by Application 2019 & 2032
- Table 13: France APAC Floating Production Industry Revenue (Million) Forecast, by Application 2019 & 2032
- Table 14: Spain APAC Floating Production Industry Revenue (Million) Forecast, by Application 2019 & 2032
- Table 15: Italy APAC Floating Production Industry Revenue (Million) Forecast, by Application 2019 & 2032
- Table 16: Spain APAC Floating Production Industry Revenue (Million) Forecast, by Application 2019 & 2032
- Table 17: Belgium APAC Floating Production Industry Revenue (Million) Forecast, by Application 2019 & 2032
- Table 18: Netherland APAC Floating Production Industry Revenue (Million) Forecast, by Application 2019 & 2032
- Table 19: Nordics APAC Floating Production Industry Revenue (Million) Forecast, by Application 2019 & 2032
- Table 20: Rest of Europe APAC Floating Production Industry Revenue (Million) Forecast, by Application 2019 & 2032
- Table 21: Global APAC Floating Production Industry Revenue Million Forecast, by Country 2019 & 2032
- Table 22: China APAC Floating Production Industry Revenue (Million) Forecast, by Application 2019 & 2032
- Table 23: Japan APAC Floating Production Industry Revenue (Million) Forecast, by Application 2019 & 2032
- Table 24: India APAC Floating Production Industry Revenue (Million) Forecast, by Application 2019 & 2032
- Table 25: South Korea APAC Floating Production Industry Revenue (Million) Forecast, by Application 2019 & 2032
- Table 26: Southeast Asia APAC Floating Production Industry Revenue (Million) Forecast, by Application 2019 & 2032
- Table 27: Australia APAC Floating Production Industry Revenue (Million) Forecast, by Application 2019 & 2032
- Table 28: Indonesia APAC Floating Production Industry Revenue (Million) Forecast, by Application 2019 & 2032
- Table 29: Phillipes APAC Floating Production Industry Revenue (Million) Forecast, by Application 2019 & 2032
- Table 30: Singapore APAC Floating Production Industry Revenue (Million) Forecast, by Application 2019 & 2032
- Table 31: Thailandc APAC Floating Production Industry Revenue (Million) Forecast, by Application 2019 & 2032
- Table 32: Rest of Asia Pacific APAC Floating Production Industry Revenue (Million) Forecast, by Application 2019 & 2032
- Table 33: Global APAC Floating Production Industry Revenue Million Forecast, by Country 2019 & 2032
- Table 34: Brazil APAC Floating Production Industry Revenue (Million) Forecast, by Application 2019 & 2032
- Table 35: Argentina APAC Floating Production Industry Revenue (Million) Forecast, by Application 2019 & 2032
- Table 36: Peru APAC Floating Production Industry Revenue (Million) Forecast, by Application 2019 & 2032
- Table 37: Chile APAC Floating Production Industry Revenue (Million) Forecast, by Application 2019 & 2032
- Table 38: Colombia APAC Floating Production Industry Revenue (Million) Forecast, by Application 2019 & 2032
- Table 39: Ecuador APAC Floating Production Industry Revenue (Million) Forecast, by Application 2019 & 2032
- Table 40: Venezuela APAC Floating Production Industry Revenue (Million) Forecast, by Application 2019 & 2032
- Table 41: Rest of South America APAC Floating Production Industry Revenue (Million) Forecast, by Application 2019 & 2032
- Table 42: Global APAC Floating Production Industry Revenue Million Forecast, by Country 2019 & 2032
- Table 43: United Arab Emirates APAC Floating Production Industry Revenue (Million) Forecast, by Application 2019 & 2032
- Table 44: Saudi Arabia APAC Floating Production Industry Revenue (Million) Forecast, by Application 2019 & 2032
- Table 45: South Africa APAC Floating Production Industry Revenue (Million) Forecast, by Application 2019 & 2032
- Table 46: Rest of Middle East and Africa APAC Floating Production Industry Revenue (Million) Forecast, by Application 2019 & 2032
- Table 47: Global APAC Floating Production Industry Revenue Million Forecast, by Type 2019 & 2032
- Table 48: Global APAC Floating Production Industry Revenue Million Forecast, by Water Depth 2019 & 2032
- Table 49: Global APAC Floating Production Industry Revenue Million Forecast, by Geography 2019 & 2032
- Table 50: Global APAC Floating Production Industry Revenue Million Forecast, by Country 2019 & 2032
- Table 51: Global APAC Floating Production Industry Revenue Million Forecast, by Type 2019 & 2032
- Table 52: Global APAC Floating Production Industry Revenue Million Forecast, by Water Depth 2019 & 2032
- Table 53: Global APAC Floating Production Industry Revenue Million Forecast, by Geography 2019 & 2032
- Table 54: Global APAC Floating Production Industry Revenue Million Forecast, by Country 2019 & 2032
- Table 55: Global APAC Floating Production Industry Revenue Million Forecast, by Type 2019 & 2032
- Table 56: Global APAC Floating Production Industry Revenue Million Forecast, by Water Depth 2019 & 2032
- Table 57: Global APAC Floating Production Industry Revenue Million Forecast, by Geography 2019 & 2032
- Table 58: Global APAC Floating Production Industry Revenue Million Forecast, by Country 2019 & 2032
- Table 59: Global APAC Floating Production Industry Revenue Million Forecast, by Type 2019 & 2032
- Table 60: Global APAC Floating Production Industry Revenue Million Forecast, by Water Depth 2019 & 2032
- Table 61: Global APAC Floating Production Industry Revenue Million Forecast, by Geography 2019 & 2032
- Table 62: Global APAC Floating Production Industry Revenue Million Forecast, by Country 2019 & 2032
- Table 63: Global APAC Floating Production Industry Revenue Million Forecast, by Type 2019 & 2032
- Table 64: Global APAC Floating Production Industry Revenue Million Forecast, by Water Depth 2019 & 2032
- Table 65: Global APAC Floating Production Industry Revenue Million Forecast, by Geography 2019 & 2032
- Table 66: Global APAC Floating Production Industry Revenue Million Forecast, by Country 2019 & 2032
Frequently Asked Questions
1. What is the projected Compound Annual Growth Rate (CAGR) of the APAC Floating Production Industry?
The projected CAGR is approximately > 10.00%.
2. Which companies are prominent players in the APAC Floating Production Industry?
Key companies in the market include MODEC Inc, Malaysia Marine and Heavy Engineering SDN BHD, Keppel Offshore and Marine Ltd, SBM Offshore N V, Samsung Heavy Industries Co Ltd, Teekay Corporation, Hyundai Heavy Industries Co Ltd, TechnipFMC PLC, Bumi Armada Berhad, Mitsubishi Heavy Industries Ltd.
3. What are the main segments of the APAC Floating Production Industry?
The market segments include Type, Water Depth, Geography.
4. Can you provide details about the market size?
The market size is estimated to be USD XX Million as of 2022.
5. What are some drivers contributing to market growth?
4.; An Increase in the Use of LNG as an Energy Source.
6. What are the notable trends driving market growth?
Floating Production. Storage and Offloading (FPSO) to Dominate the Market.
7. Are there any restraints impacting market growth?
4.; Increasing Adoption of Solar and Wind Energy.
8. Can you provide examples of recent developments in the market?
N/A
9. What pricing options are available for accessing the report?
Pricing options include single-user, multi-user, and enterprise licenses priced at USD 4750, USD 5250, and USD 8750 respectively.
10. Is the market size provided in terms of value or volume?
The market size is provided in terms of value, measured in Million.
11. Are there any specific market keywords associated with the report?
Yes, the market keyword associated with the report is "APAC Floating Production Industry," which aids in identifying and referencing the specific market segment covered.
12. How do I determine which pricing option suits my needs best?
The pricing options vary based on user requirements and access needs. Individual users may opt for single-user licenses, while businesses requiring broader access may choose multi-user or enterprise licenses for cost-effective access to the report.
13. Are there any additional resources or data provided in the APAC Floating Production Industry report?
While the report offers comprehensive insights, it's advisable to review the specific contents or supplementary materials provided to ascertain if additional resources or data are available.
14. How can I stay updated on further developments or reports in the APAC Floating Production Industry?
To stay informed about further developments, trends, and reports in the APAC Floating Production Industry, consider subscribing to industry newsletters, following relevant companies and organizations, or regularly checking reputable industry news sources and publications.
Methodology
Step 1 - Identification of Relevant Samples Size from Population Database


Step 2 - Approaches for Defining Global Market Size (Value, Volume* & Price*)

Note*: In applicable scenarios
Step 3 - Data Sources
Primary Research
- Web Analytics
- Survey Reports
- Research Institute
- Latest Research Reports
- Opinion Leaders
Secondary Research
- Annual Reports
- White Paper
- Latest Press Release
- Industry Association
- Paid Database
- Investor Presentations

Step 4 - Data Triangulation
Involves using different sources of information in order to increase the validity of a study
These sources are likely to be stakeholders in a program - participants, other researchers, program staff, other community members, and so on.
Then we put all data in single framework & apply various statistical tools to find out the dynamic on the market.
During the analysis stage, feedback from the stakeholder groups would be compared to determine areas of agreement as well as areas of divergence
