

Key Insights
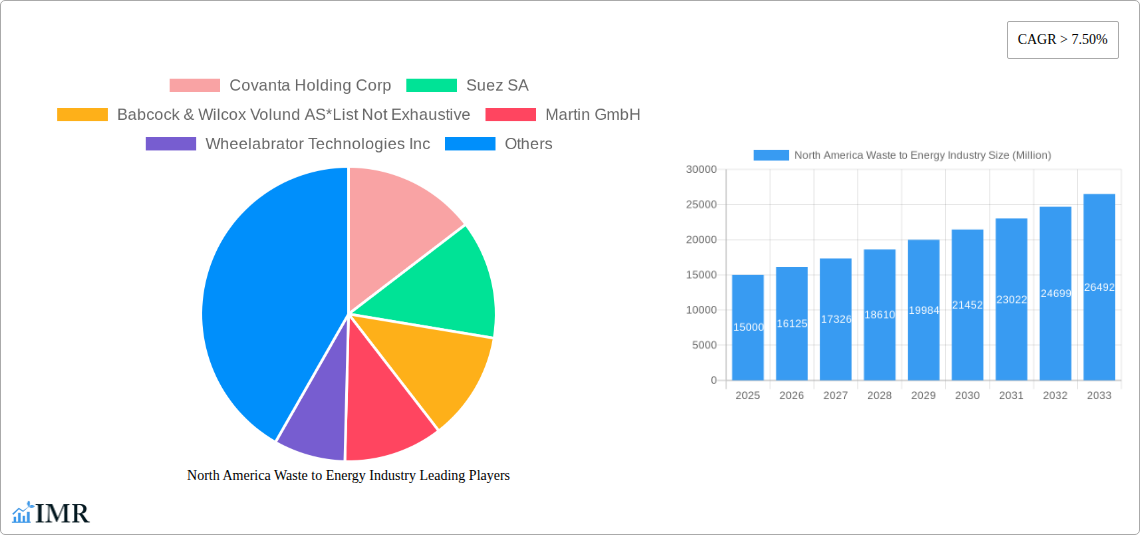
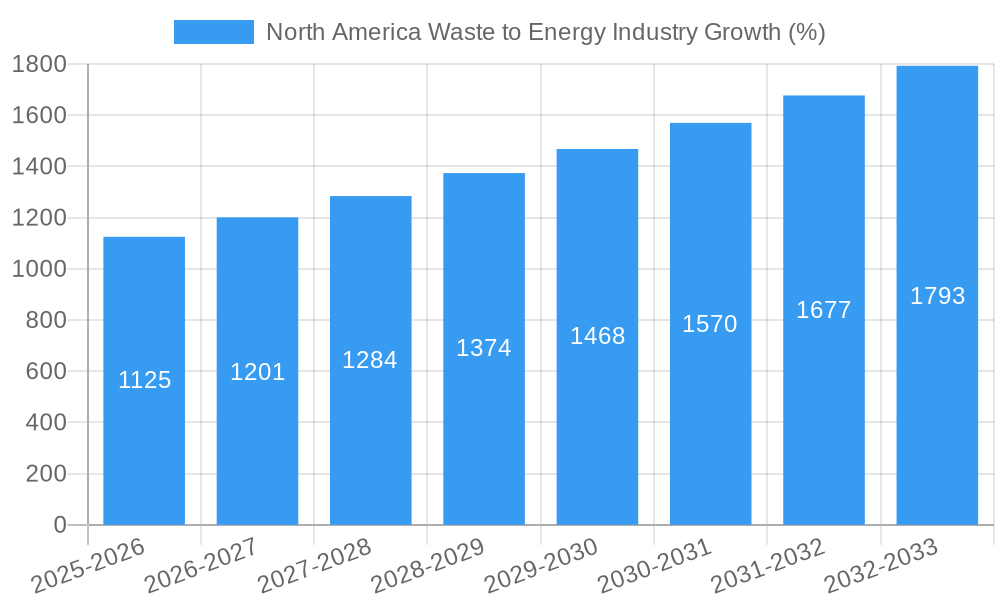
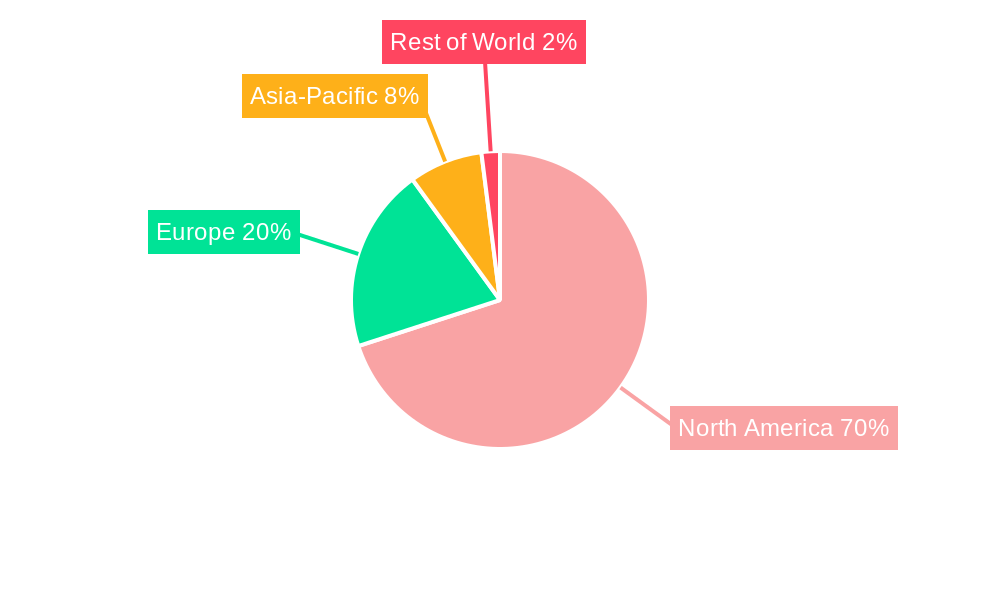
The North American waste-to-energy (WtE) industry is experiencing robust growth, projected to maintain a Compound Annual Growth Rate (CAGR) exceeding 7.5% from 2025 to 2033. This expansion is driven by several key factors. Firstly, increasing environmental regulations and stringent landfill disposal policies are pushing municipalities and businesses to seek sustainable waste management solutions. Secondly, the rising cost of landfill space and the growing awareness of greenhouse gas emissions are incentivizing the adoption of WtE technologies. Technological advancements, particularly in gasification and pyrolysis, are further enhancing the efficiency and cost-effectiveness of WtE processes, making them more attractive investments. The market is segmented by technology (physical, thermal, and biological), with thermal technologies currently dominating due to their established infrastructure and proven capabilities. Leading players such as Covanta Holding Corp, Suez SA, and Waste Management Inc are actively expanding their operations and investing in new WtE facilities to capitalize on this growth. The United States, being the largest market within North America, is expected to contribute significantly to the region's overall market expansion. However, challenges remain, including permitting complexities, public perception issues regarding potential environmental impacts, and the fluctuating prices of fossil fuels which can impact the economic viability of WtE projects.
The North American WtE market's growth trajectory is influenced by government initiatives promoting renewable energy sources and circular economy principles. Investment in research and development aimed at improving WtE technologies, coupled with strategic partnerships between private companies and public entities, are expected to drive further innovation and market penetration. While biological technologies currently hold a smaller market share, their potential for producing valuable biofuels and bio-based products is expected to fuel growth in this segment over the forecast period. Regional variations exist, with the US exhibiting higher adoption rates compared to Canada and Mexico. However, growth prospects in Canada and Mexico are anticipated to increase due to supportive government policies and increasing waste generation. Competition among established players and new entrants is expected to intensify, leading to technological advancements, improved cost efficiencies, and potentially greater market accessibility for diverse stakeholders.
North America Waste-to-Energy Industry Market Report: 2019-2033
This comprehensive report provides an in-depth analysis of the North American waste-to-energy market, covering market dynamics, growth trends, key players, and future opportunities. The study period spans 2019-2033, with 2025 as the base and estimated year. This report is crucial for investors, industry professionals, and policymakers seeking to understand and capitalize on this rapidly evolving sector. The parent market is the broader waste management industry, while the child market specifically focuses on waste-to-energy conversion technologies and applications.
North America Waste to Energy Industry Market Dynamics & Structure
This section analyzes the competitive landscape, technological advancements, regulatory influences, and market trends within the North American waste-to-energy industry. We examine market concentration, revealing the dominance of key players like Covanta Holding Corp, Suez SA, and Waste Management Inc., while acknowledging a diverse range of smaller, innovative companies. The report quantifies market share percentages for major players and assesses the impact of mergers and acquisitions (M&A) activity, estimating a total M&A deal volume of xx Million USD during the historical period.
- Market Concentration: High concentration among large players, with smaller companies focusing on niche technologies. Market share analysis included for top 10 players.
- Technological Innovation: Rapid advancements in thermal, biological, and physical technologies are driving market growth. Barriers to innovation include high capital costs and regulatory complexities.
- Regulatory Framework: Federal and state-level policies and regulations significantly impact market development. Analysis of key regulations and their influence.
- Competitive Substitutes: Landfilling and incineration without energy recovery represent key competitive substitutes. Analysis of comparative costs and environmental impacts.
- End-User Demographics: Municipal, industrial, and commercial sectors are primary end-users. Analysis of waste generation patterns and their impact on demand.
- M&A Trends: Consolidation among major players and increased acquisition of smaller technology companies observed.
North America Waste to Energy Industry Growth Trends & Insights
This section provides a detailed analysis of the North American waste-to-energy market's growth trajectory. Using various analytical methodologies including XXX (replace with the actual methodology used), the report projects a CAGR of xx% during the forecast period (2025-2033). We examine the evolution of market size (in Million USD), adoption rates of different technologies, and the impact of technological disruptions on market dynamics. Shifts in consumer behavior towards environmental sustainability are also analyzed in relation to market demand. The report will also identify any significant market penetration changes during the forecast period.
Dominant Regions, Countries, or Segments in North America Waste to Energy Industry
This section identifies leading regions, countries, and technology segments driving market growth. The report will highlight the dominance of specific geographic areas (e.g., California, Texas, etc.) and analyze contributing factors such as favorable policies, robust infrastructure, and high waste generation.
- Leading Regions: Analysis of regional growth drivers, including policy incentives and waste generation rates.
- Technology Segment Dominance: Detailed analysis of the market share of Physical, Thermal, and Biological technologies, highlighting the fastest-growing segment and the factors behind its success.
- Key Drivers: Economic policies promoting renewable energy, supportive infrastructure, and growing environmental awareness are analyzed in detail.
North America Waste to Energy Industry Product Landscape
The waste-to-energy industry utilizes various technologies, including advanced thermal processes (e.g., gasification, pyrolysis) and anaerobic digestion for biological conversion. Innovations focus on improving energy efficiency, reducing emissions, and recovering valuable byproducts. New technologies are continually emerging, with a focus on modular systems and smaller-scale solutions catering to various waste streams and locations. This market exhibits a unique selling proposition of converting waste into usable energy, minimizing landfill burdens, and driving environmental sustainability.
Key Drivers, Barriers & Challenges in North America Waste to Energy Industry
Key Drivers: The market is driven by stringent environmental regulations, increasing landfill costs, growing renewable energy mandates, and technological advancements leading to improved efficiency and reduced emissions.
Key Challenges: High capital costs for project development, complex permitting processes, public perception concerns (NIMBYism), and competition from other waste management technologies pose significant hurdles. Fluctuations in energy prices can also affect project viability.
Emerging Opportunities in North America Waste to Energy Industry
Emerging opportunities lie in integrating waste-to-energy solutions within circular economy models, exploiting new waste streams (e.g., plastics), and developing smaller, decentralized systems for better waste management in less developed areas. The development of carbon capture and storage technologies presents a significant growth opportunity.
Growth Accelerators in the North America Waste to Energy Industry Industry
Long-term growth will be fueled by technological innovations enhancing energy recovery and reducing emissions. Strategic partnerships between waste management companies and energy producers will play a vital role. Government incentives and supportive regulatory frameworks will further stimulate market expansion.
Key Players Shaping the North America Waste to Energy Industry Market
- Covanta Holding Corp
- Suez SA
- Babcock & Wilcox Volund AS
- Martin GmbH
- Wheelabrator Technologies Inc
- Veolia Environnement SA
- Waste Management Inc
- Mitsubishi Heavy Industries Ltd
- Enerkem Inc.
- Green Conversion Systems (GCS)
Notable Milestones in North America Waste to Energy Industry Sector
- October 2022: Kore Infrastructure successfully demonstrated its waste-to-energy modular system in Los Angeles, showcasing a closed-loop, carbon-negative process.
- October 2022: The Washington State Department of Commerce awarded USD 850,000 in grants to foster beneficial industrial waste uses, supporting innovative waste-to-energy projects.
In-Depth North America Waste to Energy Industry Market Outlook
The North American waste-to-energy market exhibits strong growth potential, driven by increasing environmental concerns and advancements in waste conversion technologies. Strategic partnerships and technological innovations will continue to shape the sector, offering significant opportunities for companies to capitalize on the growing demand for sustainable waste management solutions. The market is projected to witness significant expansion, particularly in regions with supportive policies and robust infrastructure.
North America Waste to Energy Industry Segmentation
-
1. Technology
- 1.1. Physical Technology
- 1.2. Thermal Technology
- 1.3. Biological Technology
-
2. Geography
- 2.1. United States
- 2.2. Canada
- 2.3. Rest of North America
North America Waste to Energy Industry Segmentation By Geography
- 1. United States
- 2. Canada
- 3. Rest of North America
North America Waste to Energy Industry REPORT HIGHLIGHTS
| Aspects | Details |
|---|---|
| Study Period | 2019-2033 |
| Base Year | 2024 |
| Estimated Year | 2025 |
| Forecast Period | 2025-2033 |
| Historical Period | 2019-2024 |
| Growth Rate | CAGR of > 7.50% from 2019-2033 |
| Segmentation |
|
Table of Contents
- 1. Introduction
- 1.1. Research Scope
- 1.2. Market Segmentation
- 1.3. Research Methodology
- 1.4. Definitions and Assumptions
- 2. Executive Summary
- 2.1. Introduction
- 3. Market Dynamics
- 3.1. Introduction
- 3.2. Market Drivers
- 3.2.1. 4.; Increasing Investments in Wind Power Projects4.; Supportive Government Policies
- 3.3. Market Restrains
- 3.3.1. 4.; Increasing Adoption of Alternate Energy Sources
- 3.4. Market Trends
- 3.4.1. Thermal Based Waste to Energy Conversion to Dominate the Market
- 4. Market Factor Analysis
- 4.1. Porters Five Forces
- 4.2. Supply/Value Chain
- 4.3. PESTEL analysis
- 4.4. Market Entropy
- 4.5. Patent/Trademark Analysis
- 5. North America Waste to Energy Industry Analysis, Insights and Forecast, 2019-2031
- 5.1. Market Analysis, Insights and Forecast - by Technology
- 5.1.1. Physical Technology
- 5.1.2. Thermal Technology
- 5.1.3. Biological Technology
- 5.2. Market Analysis, Insights and Forecast - by Geography
- 5.2.1. United States
- 5.2.2. Canada
- 5.2.3. Rest of North America
- 5.3. Market Analysis, Insights and Forecast - by Region
- 5.3.1. United States
- 5.3.2. Canada
- 5.3.3. Rest of North America
- 5.1. Market Analysis, Insights and Forecast - by Technology
- 6. United States North America Waste to Energy Industry Analysis, Insights and Forecast, 2019-2031
- 6.1. Market Analysis, Insights and Forecast - by Technology
- 6.1.1. Physical Technology
- 6.1.2. Thermal Technology
- 6.1.3. Biological Technology
- 6.2. Market Analysis, Insights and Forecast - by Geography
- 6.2.1. United States
- 6.2.2. Canada
- 6.2.3. Rest of North America
- 6.1. Market Analysis, Insights and Forecast - by Technology
- 7. Canada North America Waste to Energy Industry Analysis, Insights and Forecast, 2019-2031
- 7.1. Market Analysis, Insights and Forecast - by Technology
- 7.1.1. Physical Technology
- 7.1.2. Thermal Technology
- 7.1.3. Biological Technology
- 7.2. Market Analysis, Insights and Forecast - by Geography
- 7.2.1. United States
- 7.2.2. Canada
- 7.2.3. Rest of North America
- 7.1. Market Analysis, Insights and Forecast - by Technology
- 8. Rest of North America North America Waste to Energy Industry Analysis, Insights and Forecast, 2019-2031
- 8.1. Market Analysis, Insights and Forecast - by Technology
- 8.1.1. Physical Technology
- 8.1.2. Thermal Technology
- 8.1.3. Biological Technology
- 8.2. Market Analysis, Insights and Forecast - by Geography
- 8.2.1. United States
- 8.2.2. Canada
- 8.2.3. Rest of North America
- 8.1. Market Analysis, Insights and Forecast - by Technology
- 9. United States North America Waste to Energy Industry Analysis, Insights and Forecast, 2019-2031
- 10. Canada North America Waste to Energy Industry Analysis, Insights and Forecast, 2019-2031
- 11. Mexico North America Waste to Energy Industry Analysis, Insights and Forecast, 2019-2031
- 12. Rest of North America North America Waste to Energy Industry Analysis, Insights and Forecast, 2019-2031
- 13. Competitive Analysis
- 13.1. Market Share Analysis 2024
- 13.2. Company Profiles
- 13.2.1 Covanta Holding Corp
- 13.2.1.1. Overview
- 13.2.1.2. Products
- 13.2.1.3. SWOT Analysis
- 13.2.1.4. Recent Developments
- 13.2.1.5. Financials (Based on Availability)
- 13.2.2 Suez SA
- 13.2.2.1. Overview
- 13.2.2.2. Products
- 13.2.2.3. SWOT Analysis
- 13.2.2.4. Recent Developments
- 13.2.2.5. Financials (Based on Availability)
- 13.2.3 Babcock & Wilcox Volund AS*List Not Exhaustive
- 13.2.3.1. Overview
- 13.2.3.2. Products
- 13.2.3.3. SWOT Analysis
- 13.2.3.4. Recent Developments
- 13.2.3.5. Financials (Based on Availability)
- 13.2.4 Martin GmbH
- 13.2.4.1. Overview
- 13.2.4.2. Products
- 13.2.4.3. SWOT Analysis
- 13.2.4.4. Recent Developments
- 13.2.4.5. Financials (Based on Availability)
- 13.2.5 Wheelabrator Technologies Inc
- 13.2.5.1. Overview
- 13.2.5.2. Products
- 13.2.5.3. SWOT Analysis
- 13.2.5.4. Recent Developments
- 13.2.5.5. Financials (Based on Availability)
- 13.2.6 Veolia Environnement SA
- 13.2.6.1. Overview
- 13.2.6.2. Products
- 13.2.6.3. SWOT Analysis
- 13.2.6.4. Recent Developments
- 13.2.6.5. Financials (Based on Availability)
- 13.2.7 Waste Management Inc
- 13.2.7.1. Overview
- 13.2.7.2. Products
- 13.2.7.3. SWOT Analysis
- 13.2.7.4. Recent Developments
- 13.2.7.5. Financials (Based on Availability)
- 13.2.8 Mitsubishi Heavy Industries Ltd
- 13.2.8.1. Overview
- 13.2.8.2. Products
- 13.2.8.3. SWOT Analysis
- 13.2.8.4. Recent Developments
- 13.2.8.5. Financials (Based on Availability)
- 13.2.9 Enerkem Inc.
- 13.2.9.1. Overview
- 13.2.9.2. Products
- 13.2.9.3. SWOT Analysis
- 13.2.9.4. Recent Developments
- 13.2.9.5. Financials (Based on Availability)
- 13.2.10 Green Conversion Systems (GCS)
- 13.2.10.1. Overview
- 13.2.10.2. Products
- 13.2.10.3. SWOT Analysis
- 13.2.10.4. Recent Developments
- 13.2.10.5. Financials (Based on Availability)
- 13.2.1 Covanta Holding Corp
List of Figures
- Figure 1: North America Waste to Energy Industry Revenue Breakdown (Million, %) by Product 2024 & 2032
- Figure 2: North America Waste to Energy Industry Share (%) by Company 2024
List of Tables
- Table 1: North America Waste to Energy Industry Revenue Million Forecast, by Region 2019 & 2032
- Table 2: North America Waste to Energy Industry Volume Gigawatt Forecast, by Region 2019 & 2032
- Table 3: North America Waste to Energy Industry Revenue Million Forecast, by Technology 2019 & 2032
- Table 4: North America Waste to Energy Industry Volume Gigawatt Forecast, by Technology 2019 & 2032
- Table 5: North America Waste to Energy Industry Revenue Million Forecast, by Geography 2019 & 2032
- Table 6: North America Waste to Energy Industry Volume Gigawatt Forecast, by Geography 2019 & 2032
- Table 7: North America Waste to Energy Industry Revenue Million Forecast, by Region 2019 & 2032
- Table 8: North America Waste to Energy Industry Volume Gigawatt Forecast, by Region 2019 & 2032
- Table 9: North America Waste to Energy Industry Revenue Million Forecast, by Country 2019 & 2032
- Table 10: North America Waste to Energy Industry Volume Gigawatt Forecast, by Country 2019 & 2032
- Table 11: United States North America Waste to Energy Industry Revenue (Million) Forecast, by Application 2019 & 2032
- Table 12: United States North America Waste to Energy Industry Volume (Gigawatt) Forecast, by Application 2019 & 2032
- Table 13: Canada North America Waste to Energy Industry Revenue (Million) Forecast, by Application 2019 & 2032
- Table 14: Canada North America Waste to Energy Industry Volume (Gigawatt) Forecast, by Application 2019 & 2032
- Table 15: Mexico North America Waste to Energy Industry Revenue (Million) Forecast, by Application 2019 & 2032
- Table 16: Mexico North America Waste to Energy Industry Volume (Gigawatt) Forecast, by Application 2019 & 2032
- Table 17: Rest of North America North America Waste to Energy Industry Revenue (Million) Forecast, by Application 2019 & 2032
- Table 18: Rest of North America North America Waste to Energy Industry Volume (Gigawatt) Forecast, by Application 2019 & 2032
- Table 19: North America Waste to Energy Industry Revenue Million Forecast, by Technology 2019 & 2032
- Table 20: North America Waste to Energy Industry Volume Gigawatt Forecast, by Technology 2019 & 2032
- Table 21: North America Waste to Energy Industry Revenue Million Forecast, by Geography 2019 & 2032
- Table 22: North America Waste to Energy Industry Volume Gigawatt Forecast, by Geography 2019 & 2032
- Table 23: North America Waste to Energy Industry Revenue Million Forecast, by Country 2019 & 2032
- Table 24: North America Waste to Energy Industry Volume Gigawatt Forecast, by Country 2019 & 2032
- Table 25: North America Waste to Energy Industry Revenue Million Forecast, by Technology 2019 & 2032
- Table 26: North America Waste to Energy Industry Volume Gigawatt Forecast, by Technology 2019 & 2032
- Table 27: North America Waste to Energy Industry Revenue Million Forecast, by Geography 2019 & 2032
- Table 28: North America Waste to Energy Industry Volume Gigawatt Forecast, by Geography 2019 & 2032
- Table 29: North America Waste to Energy Industry Revenue Million Forecast, by Country 2019 & 2032
- Table 30: North America Waste to Energy Industry Volume Gigawatt Forecast, by Country 2019 & 2032
- Table 31: North America Waste to Energy Industry Revenue Million Forecast, by Technology 2019 & 2032
- Table 32: North America Waste to Energy Industry Volume Gigawatt Forecast, by Technology 2019 & 2032
- Table 33: North America Waste to Energy Industry Revenue Million Forecast, by Geography 2019 & 2032
- Table 34: North America Waste to Energy Industry Volume Gigawatt Forecast, by Geography 2019 & 2032
- Table 35: North America Waste to Energy Industry Revenue Million Forecast, by Country 2019 & 2032
- Table 36: North America Waste to Energy Industry Volume Gigawatt Forecast, by Country 2019 & 2032
Frequently Asked Questions
1. What is the projected Compound Annual Growth Rate (CAGR) of the North America Waste to Energy Industry?
The projected CAGR is approximately > 7.50%.
2. Which companies are prominent players in the North America Waste to Energy Industry?
Key companies in the market include Covanta Holding Corp, Suez SA, Babcock & Wilcox Volund AS*List Not Exhaustive, Martin GmbH, Wheelabrator Technologies Inc, Veolia Environnement SA, Waste Management Inc, Mitsubishi Heavy Industries Ltd, Enerkem Inc. , Green Conversion Systems (GCS).
3. What are the main segments of the North America Waste to Energy Industry?
The market segments include Technology, Geography.
4. Can you provide details about the market size?
The market size is estimated to be USD XX Million as of 2022.
5. What are some drivers contributing to market growth?
4.; Increasing Investments in Wind Power Projects4.; Supportive Government Policies.
6. What are the notable trends driving market growth?
Thermal Based Waste to Energy Conversion to Dominate the Market.
7. Are there any restraints impacting market growth?
4.; Increasing Adoption of Alternate Energy Sources.
8. Can you provide examples of recent developments in the market?
October 2022: Kore Infrastructure announced the successful one-year demonstration of its waste-to-energy modular system in Los Angeles, California. The company's technology can produce 100% renewable energy from organic waste using a closed-loop, carbon-negative process.
9. What pricing options are available for accessing the report?
Pricing options include single-user, multi-user, and enterprise licenses priced at USD 4750, USD 5250, and USD 8750 respectively.
10. Is the market size provided in terms of value or volume?
The market size is provided in terms of value, measured in Million and volume, measured in Gigawatt.
11. Are there any specific market keywords associated with the report?
Yes, the market keyword associated with the report is "North America Waste to Energy Industry," which aids in identifying and referencing the specific market segment covered.
12. How do I determine which pricing option suits my needs best?
The pricing options vary based on user requirements and access needs. Individual users may opt for single-user licenses, while businesses requiring broader access may choose multi-user or enterprise licenses for cost-effective access to the report.
13. Are there any additional resources or data provided in the North America Waste to Energy Industry report?
While the report offers comprehensive insights, it's advisable to review the specific contents or supplementary materials provided to ascertain if additional resources or data are available.
14. How can I stay updated on further developments or reports in the North America Waste to Energy Industry?
To stay informed about further developments, trends, and reports in the North America Waste to Energy Industry, consider subscribing to industry newsletters, following relevant companies and organizations, or regularly checking reputable industry news sources and publications.
Methodology
Step 1 - Identification of Relevant Samples Size from Population Database


Step 2 - Approaches for Defining Global Market Size (Value, Volume* & Price*)

Note*: In applicable scenarios
Step 3 - Data Sources
Primary Research
- Web Analytics
- Survey Reports
- Research Institute
- Latest Research Reports
- Opinion Leaders
Secondary Research
- Annual Reports
- White Paper
- Latest Press Release
- Industry Association
- Paid Database
- Investor Presentations

Step 4 - Data Triangulation
Involves using different sources of information in order to increase the validity of a study
These sources are likely to be stakeholders in a program - participants, other researchers, program staff, other community members, and so on.
Then we put all data in single framework & apply various statistical tools to find out the dynamic on the market.
During the analysis stage, feedback from the stakeholder groups would be compared to determine areas of agreement as well as areas of divergence
