

Key Insights
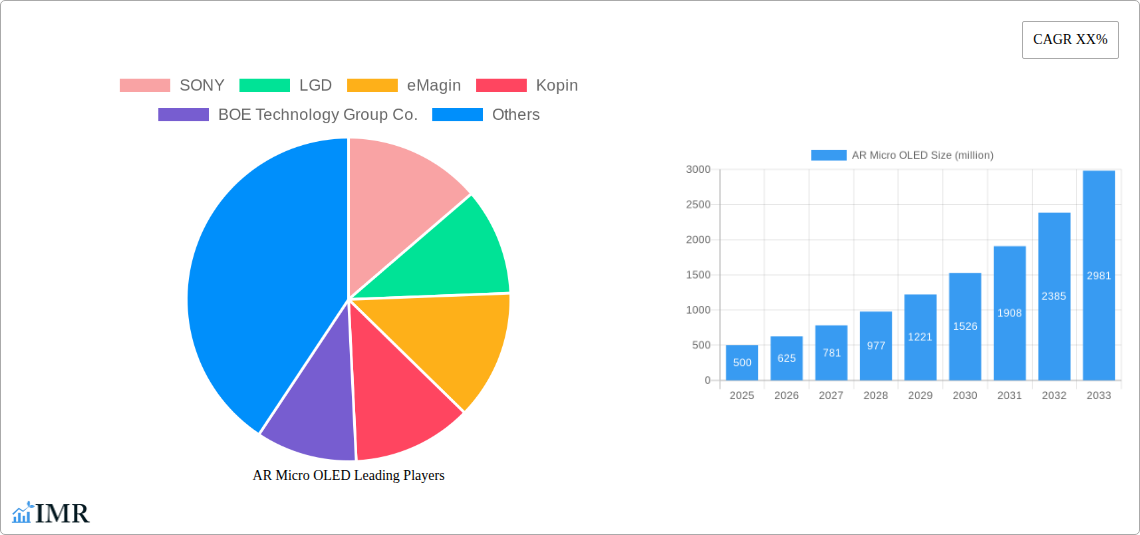
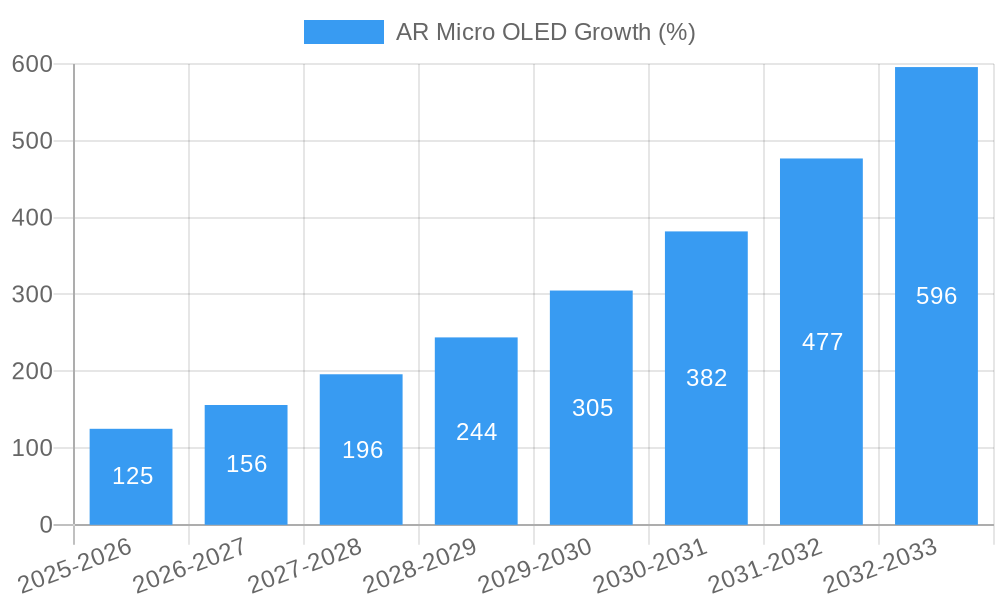
The Augmented Reality (AR) Micro OLED display market is poised for significant growth, driven by increasing demand for lightweight, high-resolution displays in AR headsets and smart glasses. The market, while currently relatively nascent, is experiencing substantial technological advancements, leading to improved image quality, reduced power consumption, and smaller form factors. Key factors fueling this expansion include the proliferation of AR applications in various sectors like gaming, healthcare, education, and industrial maintenance. Furthermore, the ongoing miniaturization of OLED technology and the integration of advanced features such as high refresh rates and wider color gamuts are contributing to the market's expansion. We estimate the current market size (2025) to be around $500 million, based on emerging market trends and the successful adoption of Micro OLEDs in niche AR applications. A conservative Compound Annual Growth Rate (CAGR) of 25% is projected for the forecast period (2025-2033), suggesting a substantial market expansion.
However, the AR Micro OLED market faces certain challenges. High manufacturing costs and the complexity of integrating Micro OLED displays into AR devices remain significant barriers. Competition among established display manufacturers and emerging players is intense, leading to price pressure. Furthermore, the market's growth is partly dependent on the broader adoption of AR technology, which is influenced by factors such as user acceptance, content availability, and the overall affordability of AR devices. Despite these constraints, the ongoing technological innovations and increasing investments in AR development suggest a positive long-term outlook for the AR Micro OLED market. The market segmentation will see continued growth in segments such as consumer AR devices and professional applications like industrial maintenance. Companies like Sony, LGD, and Kopin will need to focus on innovation, cost reduction and strong partnerships to achieve market leadership in this dynamic environment.
AR Micro OLED Market Report: 2019-2033
This comprehensive report provides an in-depth analysis of the AR Micro OLED market, encompassing market dynamics, growth trends, regional dominance, product landscape, key players, and future outlook. The study period covers 2019-2033, with a base year of 2025 and a forecast period of 2025-2033. This report is essential for industry professionals, investors, and strategists seeking to understand and capitalize on the burgeoning opportunities within this dynamic sector. The parent market is Augmented Reality (AR) and the child market is Micro-OLED displays specifically for AR applications. The report projects a market size of xx million units by 2033.
AR Micro OLED Market Dynamics & Structure
This section analyzes the competitive landscape of the AR Micro OLED market, focusing on market concentration, technological innovation, regulatory aspects, and market forces. The report delves into M&A activities and their impact, examining both quantitative and qualitative factors influencing market growth.
- Market Concentration: The market is currently characterized by a moderately concentrated structure, with key players like Sony and LGD holding significant market share. The exact percentages are detailed within the report.
- Technological Innovation: Continuous advancements in micro-display technology, such as improved resolution, brightness, and power efficiency, are primary drivers of market growth. The report identifies specific technological breakthroughs and their impact on market dynamics.
- Regulatory Framework: Government regulations and standards concerning AR device safety and data privacy are analyzed for their influence on market expansion.
- Competitive Substitutes: The report explores alternative display technologies (e.g., microLED, LCOS) and assesses their competitive threat to AR Micro OLED.
- End-User Demographics: The report identifies key end-user segments (e.g., consumers, enterprises) and their adoption rates, analyzing their preferences and purchase patterns.
- M&A Trends: An analysis of recent mergers and acquisitions in the industry is presented, highlighting their implications for market consolidation and technological advancement. The report estimates xx M&A deals occurred in the historical period.
AR Micro OLED Growth Trends & Insights
This section provides a detailed analysis of the AR Micro OLED market's historical and projected growth trajectory. Using extensive data analysis, the report explores market size evolution, adoption rates, technological disruptions, and shifts in consumer behavior, presenting key metrics like CAGR and market penetration rates. The report projects a CAGR of xx% during the forecast period (2025-2033). This growth is driven by the increasing demand for immersive AR experiences and advancements in display technology. Specific factors influencing adoption rates across different end-user segments are analyzed.
Dominant Regions, Countries, or Segments in AR Micro OLED
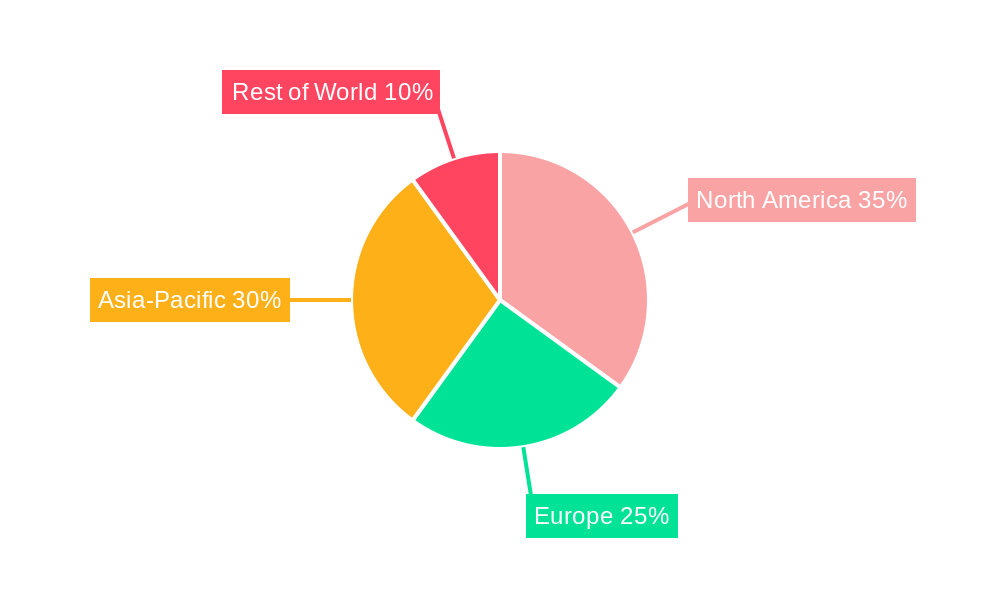
This section pinpoints the leading regions, countries, or segments driving market expansion. The analysis considers various factors contributing to regional dominance, including market share, growth potential, economic policies, and infrastructure development. The report identifies [Region/Country] as the leading market due to [specific reasons such as strong consumer demand, government support for AR technology, or a robust manufacturing base].
- Key Drivers:
- Strong consumer demand for AR devices.
- Favorable government regulations.
- Well-developed infrastructure.
- High levels of investment in R&D.
- Dominance Factors:
- High market penetration rate.
- Significant manufacturing capacity.
- Presence of major industry players.
AR Micro OLED Product Landscape
The report details the latest product innovations in AR Micro OLED technology, highlighting their unique selling propositions and technological advancements. It explores diverse applications and analyzes performance metrics, such as resolution, brightness, and power consumption, to showcase the evolution and capabilities of this technology.
Key Drivers, Barriers & Challenges in AR Micro OLED
This section identifies the key factors driving the AR Micro OLED market's growth, such as technological advancements, economic factors, and supportive government policies. Examples of specific technological breakthroughs are detailed. Conversely, it also analyzes key challenges and limitations, including supply chain issues, regulatory hurdles, and competitive pressures. The report quantifies the impact of these challenges on market growth.
Emerging Opportunities in AR Micro OLED
This section highlights emerging opportunities within the AR Micro OLED market. It explores untapped markets, innovative applications, and changing consumer preferences. This may include opportunities in new industry verticals or the development of niche products catering to specific user needs.
Growth Accelerators in the AR Micro OLED Industry
This section examines the catalysts driving long-term growth in the AR Micro OLED industry. It emphasizes technological breakthroughs, strategic partnerships, and successful market expansion strategies that are expected to propel future growth.
Key Players Shaping the AR Micro OLED Market
- SONY
- LGD
- eMagin
- Kopin
- BOE Technology Group Co.,Ltd.
- TCL
- SeeYA Technology
- Nanjing Guozhao Optoelectronics Technology Co.,Ltd.
- Lakeside Optoelectronic Technology (Jiangsu) Co.,Ltd.
- Kunshan Fantaview Electronic Technology Co.,Ltd.(Visionox Technology Inc.)
Notable Milestones in AR Micro OLED Sector
- [Year/Month]: [Milestone description and impact on market dynamics]
- [Year/Month]: [Milestone description and impact on market dynamics]
- [Year/Month]: [Milestone description and impact on market dynamics]
- …and so on.
In-Depth AR Micro OLED Market Outlook
This section summarizes the key growth accelerators and provides a concise overview of the future market potential and strategic opportunities within the AR Micro OLED sector. The report projects a positive outlook, emphasizing the continued technological innovation and expanding applications that will drive sustained market growth over the forecast period.
AR Micro OLED Segmentation
-
1. Application
- 1.1. Binocular AR
- 1.2. Monocular AR
-
2. Types
- 2.1. Mass Transfer Technology
- 2.2. Monolithic Integration Technology
AR Micro OLED Segmentation By Geography
-
1. North America
- 1.1. United States
- 1.2. Canada
- 1.3. Mexico
-
2. South America
- 2.1. Brazil
- 2.2. Argentina
- 2.3. Rest of South America
-
3. Europe
- 3.1. United Kingdom
- 3.2. Germany
- 3.3. France
- 3.4. Italy
- 3.5. Spain
- 3.6. Russia
- 3.7. Benelux
- 3.8. Nordics
- 3.9. Rest of Europe
-
4. Middle East & Africa
- 4.1. Turkey
- 4.2. Israel
- 4.3. GCC
- 4.4. North Africa
- 4.5. South Africa
- 4.6. Rest of Middle East & Africa
-
5. Asia Pacific
- 5.1. China
- 5.2. India
- 5.3. Japan
- 5.4. South Korea
- 5.5. ASEAN
- 5.6. Oceania
- 5.7. Rest of Asia Pacific
AR Micro OLED REPORT HIGHLIGHTS
| Aspects | Details |
|---|---|
| Study Period | 2019-2033 |
| Base Year | 2024 |
| Estimated Year | 2025 |
| Forecast Period | 2025-2033 |
| Historical Period | 2019-2024 |
| Growth Rate | CAGR of XX% from 2019-2033 |
| Segmentation |
|
Table of Contents
- 1. Introduction
- 1.1. Research Scope
- 1.2. Market Segmentation
- 1.3. Research Methodology
- 1.4. Definitions and Assumptions
- 2. Executive Summary
- 2.1. Introduction
- 3. Market Dynamics
- 3.1. Introduction
- 3.2. Market Drivers
- 3.3. Market Restrains
- 3.4. Market Trends
- 4. Market Factor Analysis
- 4.1. Porters Five Forces
- 4.2. Supply/Value Chain
- 4.3. PESTEL analysis
- 4.4. Market Entropy
- 4.5. Patent/Trademark Analysis
- 5. Global AR Micro OLED Analysis, Insights and Forecast, 2019-2031
- 5.1. Market Analysis, Insights and Forecast - by Application
- 5.1.1. Binocular AR
- 5.1.2. Monocular AR
- 5.2. Market Analysis, Insights and Forecast - by Types
- 5.2.1. Mass Transfer Technology
- 5.2.2. Monolithic Integration Technology
- 5.3. Market Analysis, Insights and Forecast - by Region
- 5.3.1. North America
- 5.3.2. South America
- 5.3.3. Europe
- 5.3.4. Middle East & Africa
- 5.3.5. Asia Pacific
- 5.1. Market Analysis, Insights and Forecast - by Application
- 6. North America AR Micro OLED Analysis, Insights and Forecast, 2019-2031
- 6.1. Market Analysis, Insights and Forecast - by Application
- 6.1.1. Binocular AR
- 6.1.2. Monocular AR
- 6.2. Market Analysis, Insights and Forecast - by Types
- 6.2.1. Mass Transfer Technology
- 6.2.2. Monolithic Integration Technology
- 6.1. Market Analysis, Insights and Forecast - by Application
- 7. South America AR Micro OLED Analysis, Insights and Forecast, 2019-2031
- 7.1. Market Analysis, Insights and Forecast - by Application
- 7.1.1. Binocular AR
- 7.1.2. Monocular AR
- 7.2. Market Analysis, Insights and Forecast - by Types
- 7.2.1. Mass Transfer Technology
- 7.2.2. Monolithic Integration Technology
- 7.1. Market Analysis, Insights and Forecast - by Application
- 8. Europe AR Micro OLED Analysis, Insights and Forecast, 2019-2031
- 8.1. Market Analysis, Insights and Forecast - by Application
- 8.1.1. Binocular AR
- 8.1.2. Monocular AR
- 8.2. Market Analysis, Insights and Forecast - by Types
- 8.2.1. Mass Transfer Technology
- 8.2.2. Monolithic Integration Technology
- 8.1. Market Analysis, Insights and Forecast - by Application
- 9. Middle East & Africa AR Micro OLED Analysis, Insights and Forecast, 2019-2031
- 9.1. Market Analysis, Insights and Forecast - by Application
- 9.1.1. Binocular AR
- 9.1.2. Monocular AR
- 9.2. Market Analysis, Insights and Forecast - by Types
- 9.2.1. Mass Transfer Technology
- 9.2.2. Monolithic Integration Technology
- 9.1. Market Analysis, Insights and Forecast - by Application
- 10. Asia Pacific AR Micro OLED Analysis, Insights and Forecast, 2019-2031
- 10.1. Market Analysis, Insights and Forecast - by Application
- 10.1.1. Binocular AR
- 10.1.2. Monocular AR
- 10.2. Market Analysis, Insights and Forecast - by Types
- 10.2.1. Mass Transfer Technology
- 10.2.2. Monolithic Integration Technology
- 10.1. Market Analysis, Insights and Forecast - by Application
- 11. Competitive Analysis
- 11.1. Global Market Share Analysis 2024
- 11.2. Company Profiles
- 11.2.1 SONY
- 11.2.1.1. Overview
- 11.2.1.2. Products
- 11.2.1.3. SWOT Analysis
- 11.2.1.4. Recent Developments
- 11.2.1.5. Financials (Based on Availability)
- 11.2.2 LGD
- 11.2.2.1. Overview
- 11.2.2.2. Products
- 11.2.2.3. SWOT Analysis
- 11.2.2.4. Recent Developments
- 11.2.2.5. Financials (Based on Availability)
- 11.2.3 eMagin
- 11.2.3.1. Overview
- 11.2.3.2. Products
- 11.2.3.3. SWOT Analysis
- 11.2.3.4. Recent Developments
- 11.2.3.5. Financials (Based on Availability)
- 11.2.4 Kopin
- 11.2.4.1. Overview
- 11.2.4.2. Products
- 11.2.4.3. SWOT Analysis
- 11.2.4.4. Recent Developments
- 11.2.4.5. Financials (Based on Availability)
- 11.2.5 BOE Technology Group Co.
- 11.2.5.1. Overview
- 11.2.5.2. Products
- 11.2.5.3. SWOT Analysis
- 11.2.5.4. Recent Developments
- 11.2.5.5. Financials (Based on Availability)
- 11.2.6 Ltd.
- 11.2.6.1. Overview
- 11.2.6.2. Products
- 11.2.6.3. SWOT Analysis
- 11.2.6.4. Recent Developments
- 11.2.6.5. Financials (Based on Availability)
- 11.2.7 TCL
- 11.2.7.1. Overview
- 11.2.7.2. Products
- 11.2.7.3. SWOT Analysis
- 11.2.7.4. Recent Developments
- 11.2.7.5. Financials (Based on Availability)
- 11.2.8 SeeYA Technology
- 11.2.8.1. Overview
- 11.2.8.2. Products
- 11.2.8.3. SWOT Analysis
- 11.2.8.4. Recent Developments
- 11.2.8.5. Financials (Based on Availability)
- 11.2.9 Nanjing Guozhao Optoelectronics Technology Co.
- 11.2.9.1. Overview
- 11.2.9.2. Products
- 11.2.9.3. SWOT Analysis
- 11.2.9.4. Recent Developments
- 11.2.9.5. Financials (Based on Availability)
- 11.2.10 Ltd.
- 11.2.10.1. Overview
- 11.2.10.2. Products
- 11.2.10.3. SWOT Analysis
- 11.2.10.4. Recent Developments
- 11.2.10.5. Financials (Based on Availability)
- 11.2.11 Lakeside Optoelectronic Technology (Jiangsu) Co.
- 11.2.11.1. Overview
- 11.2.11.2. Products
- 11.2.11.3. SWOT Analysis
- 11.2.11.4. Recent Developments
- 11.2.11.5. Financials (Based on Availability)
- 11.2.12 Ltd.
- 11.2.12.1. Overview
- 11.2.12.2. Products
- 11.2.12.3. SWOT Analysis
- 11.2.12.4. Recent Developments
- 11.2.12.5. Financials (Based on Availability)
- 11.2.13 Kunshan Fantaview Electronic Technology Co.
- 11.2.13.1. Overview
- 11.2.13.2. Products
- 11.2.13.3. SWOT Analysis
- 11.2.13.4. Recent Developments
- 11.2.13.5. Financials (Based on Availability)
- 11.2.14 Ltd.(Visionox Technology Inc.)
- 11.2.14.1. Overview
- 11.2.14.2. Products
- 11.2.14.3. SWOT Analysis
- 11.2.14.4. Recent Developments
- 11.2.14.5. Financials (Based on Availability)
- 11.2.1 SONY
List of Figures
- Figure 1: Global AR Micro OLED Revenue Breakdown (million, %) by Region 2024 & 2032
- Figure 2: Global AR Micro OLED Volume Breakdown (K, %) by Region 2024 & 2032
- Figure 3: North America AR Micro OLED Revenue (million), by Application 2024 & 2032
- Figure 4: North America AR Micro OLED Volume (K), by Application 2024 & 2032
- Figure 5: North America AR Micro OLED Revenue Share (%), by Application 2024 & 2032
- Figure 6: North America AR Micro OLED Volume Share (%), by Application 2024 & 2032
- Figure 7: North America AR Micro OLED Revenue (million), by Types 2024 & 2032
- Figure 8: North America AR Micro OLED Volume (K), by Types 2024 & 2032
- Figure 9: North America AR Micro OLED Revenue Share (%), by Types 2024 & 2032
- Figure 10: North America AR Micro OLED Volume Share (%), by Types 2024 & 2032
- Figure 11: North America AR Micro OLED Revenue (million), by Country 2024 & 2032
- Figure 12: North America AR Micro OLED Volume (K), by Country 2024 & 2032
- Figure 13: North America AR Micro OLED Revenue Share (%), by Country 2024 & 2032
- Figure 14: North America AR Micro OLED Volume Share (%), by Country 2024 & 2032
- Figure 15: South America AR Micro OLED Revenue (million), by Application 2024 & 2032
- Figure 16: South America AR Micro OLED Volume (K), by Application 2024 & 2032
- Figure 17: South America AR Micro OLED Revenue Share (%), by Application 2024 & 2032
- Figure 18: South America AR Micro OLED Volume Share (%), by Application 2024 & 2032
- Figure 19: South America AR Micro OLED Revenue (million), by Types 2024 & 2032
- Figure 20: South America AR Micro OLED Volume (K), by Types 2024 & 2032
- Figure 21: South America AR Micro OLED Revenue Share (%), by Types 2024 & 2032
- Figure 22: South America AR Micro OLED Volume Share (%), by Types 2024 & 2032
- Figure 23: South America AR Micro OLED Revenue (million), by Country 2024 & 2032
- Figure 24: South America AR Micro OLED Volume (K), by Country 2024 & 2032
- Figure 25: South America AR Micro OLED Revenue Share (%), by Country 2024 & 2032
- Figure 26: South America AR Micro OLED Volume Share (%), by Country 2024 & 2032
- Figure 27: Europe AR Micro OLED Revenue (million), by Application 2024 & 2032
- Figure 28: Europe AR Micro OLED Volume (K), by Application 2024 & 2032
- Figure 29: Europe AR Micro OLED Revenue Share (%), by Application 2024 & 2032
- Figure 30: Europe AR Micro OLED Volume Share (%), by Application 2024 & 2032
- Figure 31: Europe AR Micro OLED Revenue (million), by Types 2024 & 2032
- Figure 32: Europe AR Micro OLED Volume (K), by Types 2024 & 2032
- Figure 33: Europe AR Micro OLED Revenue Share (%), by Types 2024 & 2032
- Figure 34: Europe AR Micro OLED Volume Share (%), by Types 2024 & 2032
- Figure 35: Europe AR Micro OLED Revenue (million), by Country 2024 & 2032
- Figure 36: Europe AR Micro OLED Volume (K), by Country 2024 & 2032
- Figure 37: Europe AR Micro OLED Revenue Share (%), by Country 2024 & 2032
- Figure 38: Europe AR Micro OLED Volume Share (%), by Country 2024 & 2032
- Figure 39: Middle East & Africa AR Micro OLED Revenue (million), by Application 2024 & 2032
- Figure 40: Middle East & Africa AR Micro OLED Volume (K), by Application 2024 & 2032
- Figure 41: Middle East & Africa AR Micro OLED Revenue Share (%), by Application 2024 & 2032
- Figure 42: Middle East & Africa AR Micro OLED Volume Share (%), by Application 2024 & 2032
- Figure 43: Middle East & Africa AR Micro OLED Revenue (million), by Types 2024 & 2032
- Figure 44: Middle East & Africa AR Micro OLED Volume (K), by Types 2024 & 2032
- Figure 45: Middle East & Africa AR Micro OLED Revenue Share (%), by Types 2024 & 2032
- Figure 46: Middle East & Africa AR Micro OLED Volume Share (%), by Types 2024 & 2032
- Figure 47: Middle East & Africa AR Micro OLED Revenue (million), by Country 2024 & 2032
- Figure 48: Middle East & Africa AR Micro OLED Volume (K), by Country 2024 & 2032
- Figure 49: Middle East & Africa AR Micro OLED Revenue Share (%), by Country 2024 & 2032
- Figure 50: Middle East & Africa AR Micro OLED Volume Share (%), by Country 2024 & 2032
- Figure 51: Asia Pacific AR Micro OLED Revenue (million), by Application 2024 & 2032
- Figure 52: Asia Pacific AR Micro OLED Volume (K), by Application 2024 & 2032
- Figure 53: Asia Pacific AR Micro OLED Revenue Share (%), by Application 2024 & 2032
- Figure 54: Asia Pacific AR Micro OLED Volume Share (%), by Application 2024 & 2032
- Figure 55: Asia Pacific AR Micro OLED Revenue (million), by Types 2024 & 2032
- Figure 56: Asia Pacific AR Micro OLED Volume (K), by Types 2024 & 2032
- Figure 57: Asia Pacific AR Micro OLED Revenue Share (%), by Types 2024 & 2032
- Figure 58: Asia Pacific AR Micro OLED Volume Share (%), by Types 2024 & 2032
- Figure 59: Asia Pacific AR Micro OLED Revenue (million), by Country 2024 & 2032
- Figure 60: Asia Pacific AR Micro OLED Volume (K), by Country 2024 & 2032
- Figure 61: Asia Pacific AR Micro OLED Revenue Share (%), by Country 2024 & 2032
- Figure 62: Asia Pacific AR Micro OLED Volume Share (%), by Country 2024 & 2032
List of Tables
- Table 1: Global AR Micro OLED Revenue million Forecast, by Region 2019 & 2032
- Table 2: Global AR Micro OLED Volume K Forecast, by Region 2019 & 2032
- Table 3: Global AR Micro OLED Revenue million Forecast, by Application 2019 & 2032
- Table 4: Global AR Micro OLED Volume K Forecast, by Application 2019 & 2032
- Table 5: Global AR Micro OLED Revenue million Forecast, by Types 2019 & 2032
- Table 6: Global AR Micro OLED Volume K Forecast, by Types 2019 & 2032
- Table 7: Global AR Micro OLED Revenue million Forecast, by Region 2019 & 2032
- Table 8: Global AR Micro OLED Volume K Forecast, by Region 2019 & 2032
- Table 9: Global AR Micro OLED Revenue million Forecast, by Application 2019 & 2032
- Table 10: Global AR Micro OLED Volume K Forecast, by Application 2019 & 2032
- Table 11: Global AR Micro OLED Revenue million Forecast, by Types 2019 & 2032
- Table 12: Global AR Micro OLED Volume K Forecast, by Types 2019 & 2032
- Table 13: Global AR Micro OLED Revenue million Forecast, by Country 2019 & 2032
- Table 14: Global AR Micro OLED Volume K Forecast, by Country 2019 & 2032
- Table 15: United States AR Micro OLED Revenue (million) Forecast, by Application 2019 & 2032
- Table 16: United States AR Micro OLED Volume (K) Forecast, by Application 2019 & 2032
- Table 17: Canada AR Micro OLED Revenue (million) Forecast, by Application 2019 & 2032
- Table 18: Canada AR Micro OLED Volume (K) Forecast, by Application 2019 & 2032
- Table 19: Mexico AR Micro OLED Revenue (million) Forecast, by Application 2019 & 2032
- Table 20: Mexico AR Micro OLED Volume (K) Forecast, by Application 2019 & 2032
- Table 21: Global AR Micro OLED Revenue million Forecast, by Application 2019 & 2032
- Table 22: Global AR Micro OLED Volume K Forecast, by Application 2019 & 2032
- Table 23: Global AR Micro OLED Revenue million Forecast, by Types 2019 & 2032
- Table 24: Global AR Micro OLED Volume K Forecast, by Types 2019 & 2032
- Table 25: Global AR Micro OLED Revenue million Forecast, by Country 2019 & 2032
- Table 26: Global AR Micro OLED Volume K Forecast, by Country 2019 & 2032
- Table 27: Brazil AR Micro OLED Revenue (million) Forecast, by Application 2019 & 2032
- Table 28: Brazil AR Micro OLED Volume (K) Forecast, by Application 2019 & 2032
- Table 29: Argentina AR Micro OLED Revenue (million) Forecast, by Application 2019 & 2032
- Table 30: Argentina AR Micro OLED Volume (K) Forecast, by Application 2019 & 2032
- Table 31: Rest of South America AR Micro OLED Revenue (million) Forecast, by Application 2019 & 2032
- Table 32: Rest of South America AR Micro OLED Volume (K) Forecast, by Application 2019 & 2032
- Table 33: Global AR Micro OLED Revenue million Forecast, by Application 2019 & 2032
- Table 34: Global AR Micro OLED Volume K Forecast, by Application 2019 & 2032
- Table 35: Global AR Micro OLED Revenue million Forecast, by Types 2019 & 2032
- Table 36: Global AR Micro OLED Volume K Forecast, by Types 2019 & 2032
- Table 37: Global AR Micro OLED Revenue million Forecast, by Country 2019 & 2032
- Table 38: Global AR Micro OLED Volume K Forecast, by Country 2019 & 2032
- Table 39: United Kingdom AR Micro OLED Revenue (million) Forecast, by Application 2019 & 2032
- Table 40: United Kingdom AR Micro OLED Volume (K) Forecast, by Application 2019 & 2032
- Table 41: Germany AR Micro OLED Revenue (million) Forecast, by Application 2019 & 2032
- Table 42: Germany AR Micro OLED Volume (K) Forecast, by Application 2019 & 2032
- Table 43: France AR Micro OLED Revenue (million) Forecast, by Application 2019 & 2032
- Table 44: France AR Micro OLED Volume (K) Forecast, by Application 2019 & 2032
- Table 45: Italy AR Micro OLED Revenue (million) Forecast, by Application 2019 & 2032
- Table 46: Italy AR Micro OLED Volume (K) Forecast, by Application 2019 & 2032
- Table 47: Spain AR Micro OLED Revenue (million) Forecast, by Application 2019 & 2032
- Table 48: Spain AR Micro OLED Volume (K) Forecast, by Application 2019 & 2032
- Table 49: Russia AR Micro OLED Revenue (million) Forecast, by Application 2019 & 2032
- Table 50: Russia AR Micro OLED Volume (K) Forecast, by Application 2019 & 2032
- Table 51: Benelux AR Micro OLED Revenue (million) Forecast, by Application 2019 & 2032
- Table 52: Benelux AR Micro OLED Volume (K) Forecast, by Application 2019 & 2032
- Table 53: Nordics AR Micro OLED Revenue (million) Forecast, by Application 2019 & 2032
- Table 54: Nordics AR Micro OLED Volume (K) Forecast, by Application 2019 & 2032
- Table 55: Rest of Europe AR Micro OLED Revenue (million) Forecast, by Application 2019 & 2032
- Table 56: Rest of Europe AR Micro OLED Volume (K) Forecast, by Application 2019 & 2032
- Table 57: Global AR Micro OLED Revenue million Forecast, by Application 2019 & 2032
- Table 58: Global AR Micro OLED Volume K Forecast, by Application 2019 & 2032
- Table 59: Global AR Micro OLED Revenue million Forecast, by Types 2019 & 2032
- Table 60: Global AR Micro OLED Volume K Forecast, by Types 2019 & 2032
- Table 61: Global AR Micro OLED Revenue million Forecast, by Country 2019 & 2032
- Table 62: Global AR Micro OLED Volume K Forecast, by Country 2019 & 2032
- Table 63: Turkey AR Micro OLED Revenue (million) Forecast, by Application 2019 & 2032
- Table 64: Turkey AR Micro OLED Volume (K) Forecast, by Application 2019 & 2032
- Table 65: Israel AR Micro OLED Revenue (million) Forecast, by Application 2019 & 2032
- Table 66: Israel AR Micro OLED Volume (K) Forecast, by Application 2019 & 2032
- Table 67: GCC AR Micro OLED Revenue (million) Forecast, by Application 2019 & 2032
- Table 68: GCC AR Micro OLED Volume (K) Forecast, by Application 2019 & 2032
- Table 69: North Africa AR Micro OLED Revenue (million) Forecast, by Application 2019 & 2032
- Table 70: North Africa AR Micro OLED Volume (K) Forecast, by Application 2019 & 2032
- Table 71: South Africa AR Micro OLED Revenue (million) Forecast, by Application 2019 & 2032
- Table 72: South Africa AR Micro OLED Volume (K) Forecast, by Application 2019 & 2032
- Table 73: Rest of Middle East & Africa AR Micro OLED Revenue (million) Forecast, by Application 2019 & 2032
- Table 74: Rest of Middle East & Africa AR Micro OLED Volume (K) Forecast, by Application 2019 & 2032
- Table 75: Global AR Micro OLED Revenue million Forecast, by Application 2019 & 2032
- Table 76: Global AR Micro OLED Volume K Forecast, by Application 2019 & 2032
- Table 77: Global AR Micro OLED Revenue million Forecast, by Types 2019 & 2032
- Table 78: Global AR Micro OLED Volume K Forecast, by Types 2019 & 2032
- Table 79: Global AR Micro OLED Revenue million Forecast, by Country 2019 & 2032
- Table 80: Global AR Micro OLED Volume K Forecast, by Country 2019 & 2032
- Table 81: China AR Micro OLED Revenue (million) Forecast, by Application 2019 & 2032
- Table 82: China AR Micro OLED Volume (K) Forecast, by Application 2019 & 2032
- Table 83: India AR Micro OLED Revenue (million) Forecast, by Application 2019 & 2032
- Table 84: India AR Micro OLED Volume (K) Forecast, by Application 2019 & 2032
- Table 85: Japan AR Micro OLED Revenue (million) Forecast, by Application 2019 & 2032
- Table 86: Japan AR Micro OLED Volume (K) Forecast, by Application 2019 & 2032
- Table 87: South Korea AR Micro OLED Revenue (million) Forecast, by Application 2019 & 2032
- Table 88: South Korea AR Micro OLED Volume (K) Forecast, by Application 2019 & 2032
- Table 89: ASEAN AR Micro OLED Revenue (million) Forecast, by Application 2019 & 2032
- Table 90: ASEAN AR Micro OLED Volume (K) Forecast, by Application 2019 & 2032
- Table 91: Oceania AR Micro OLED Revenue (million) Forecast, by Application 2019 & 2032
- Table 92: Oceania AR Micro OLED Volume (K) Forecast, by Application 2019 & 2032
- Table 93: Rest of Asia Pacific AR Micro OLED Revenue (million) Forecast, by Application 2019 & 2032
- Table 94: Rest of Asia Pacific AR Micro OLED Volume (K) Forecast, by Application 2019 & 2032
Frequently Asked Questions
1. What is the projected Compound Annual Growth Rate (CAGR) of the AR Micro OLED?
The projected CAGR is approximately XX%.
2. Which companies are prominent players in the AR Micro OLED?
Key companies in the market include SONY, LGD, eMagin, Kopin, BOE Technology Group Co., Ltd., TCL, SeeYA Technology, Nanjing Guozhao Optoelectronics Technology Co., Ltd., Lakeside Optoelectronic Technology (Jiangsu) Co., Ltd., Kunshan Fantaview Electronic Technology Co., Ltd.(Visionox Technology Inc.).
3. What are the main segments of the AR Micro OLED?
The market segments include Application, Types.
4. Can you provide details about the market size?
The market size is estimated to be USD XXX million as of 2022.
5. What are some drivers contributing to market growth?
N/A
6. What are the notable trends driving market growth?
N/A
7. Are there any restraints impacting market growth?
N/A
8. Can you provide examples of recent developments in the market?
N/A
9. What pricing options are available for accessing the report?
Pricing options include single-user, multi-user, and enterprise licenses priced at USD 3350.00, USD 5025.00, and USD 6700.00 respectively.
10. Is the market size provided in terms of value or volume?
The market size is provided in terms of value, measured in million and volume, measured in K.
11. Are there any specific market keywords associated with the report?
Yes, the market keyword associated with the report is "AR Micro OLED," which aids in identifying and referencing the specific market segment covered.
12. How do I determine which pricing option suits my needs best?
The pricing options vary based on user requirements and access needs. Individual users may opt for single-user licenses, while businesses requiring broader access may choose multi-user or enterprise licenses for cost-effective access to the report.
13. Are there any additional resources or data provided in the AR Micro OLED report?
While the report offers comprehensive insights, it's advisable to review the specific contents or supplementary materials provided to ascertain if additional resources or data are available.
14. How can I stay updated on further developments or reports in the AR Micro OLED?
To stay informed about further developments, trends, and reports in the AR Micro OLED, consider subscribing to industry newsletters, following relevant companies and organizations, or regularly checking reputable industry news sources and publications.
Methodology
Step 1 - Identification of Relevant Samples Size from Population Database


Step 2 - Approaches for Defining Global Market Size (Value, Volume* & Price*)

Note*: In applicable scenarios
Step 3 - Data Sources
Primary Research
- Web Analytics
- Survey Reports
- Research Institute
- Latest Research Reports
- Opinion Leaders
Secondary Research
- Annual Reports
- White Paper
- Latest Press Release
- Industry Association
- Paid Database
- Investor Presentations

Step 4 - Data Triangulation
Involves using different sources of information in order to increase the validity of a study
These sources are likely to be stakeholders in a program - participants, other researchers, program staff, other community members, and so on.
Then we put all data in single framework & apply various statistical tools to find out the dynamic on the market.
During the analysis stage, feedback from the stakeholder groups would be compared to determine areas of agreement as well as areas of divergence
