

Key Insights
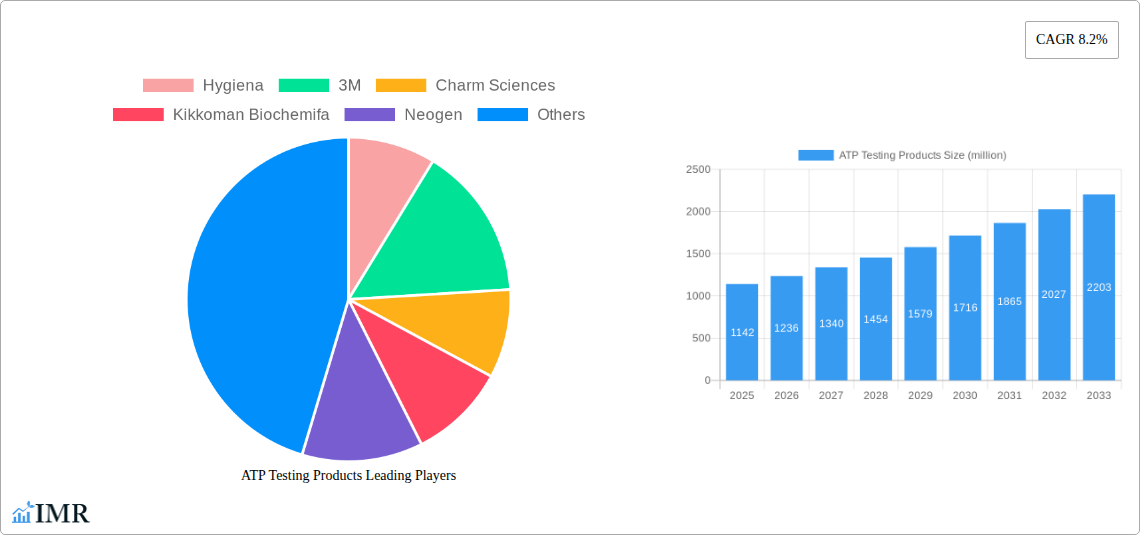
The ATP testing products market, valued at $1142 million in 2025, is projected to experience robust growth, driven by increasing concerns regarding food safety and hygiene across various sectors. The rising prevalence of foodborne illnesses and stringent regulatory frameworks mandating hygiene protocols are key catalysts. Furthermore, advancements in ATP testing technology, leading to faster, more accurate, and portable devices, are fueling market expansion. The adoption of ATP testing is broadening beyond food and beverage, extending into healthcare, pharmaceuticals, and environmental monitoring, contributing to significant market growth. Major players like Hygiena, 3M, and Neogen are actively investing in R&D and strategic partnerships to enhance their product portfolios and expand their market reach. The market is segmented by product type (swabs, luminometers, reagents), application (food safety, healthcare, environmental monitoring), and end-user (food processing, restaurants, hospitals). The competitive landscape is characterized by both established players and emerging companies offering innovative solutions.
The forecasted CAGR of 8.2% suggests a substantial market expansion over the period 2025-2033. While precise regional breakdowns are unavailable, a logical assumption based on global trends indicates a significant market share for North America and Europe, followed by Asia-Pacific, driven by rapid economic growth and rising awareness of hygiene standards in these regions. However, factors like high initial investment costs for advanced ATP testing systems and the availability of alternative testing methods could pose some challenges to market growth. Nevertheless, the overall market outlook remains positive, with significant opportunities for innovation and expansion in emerging markets. The continued focus on food safety and hygiene regulations worldwide will likely be the primary driver of continued growth.
ATP Testing Products Market Report: 2019-2033
This comprehensive report provides a detailed analysis of the global ATP testing products market, encompassing market dynamics, growth trends, regional dominance, product landscape, key players, and future outlook. The study period covers 2019-2033, with a base year of 2025 and a forecast period of 2025-2033. The report utilizes data from 2019-2024 as the historical period. The market size is expressed in million units.
ATP Testing Products Market Dynamics & Structure
The ATP testing products market, valued at xx million units in 2025, exhibits a moderately consolidated structure. Major players, such as Hygiena, 3M, Charm Sciences, Neogen, Ecolab, Merck Millipore, and others, hold significant market share, though smaller players continue to innovate. Technological advancements, particularly in rapid testing methodologies and instrument miniaturization, are key drivers. Stringent regulatory frameworks, especially in the food and beverage and healthcare sectors, mandate ATP testing, boosting demand. While some traditional methods exist, the convenience and speed of ATP testing limit the impact of substitute technologies. The end-user base spans diverse industries, including food processing, healthcare, pharmaceuticals, and environmental monitoring. M&A activity has been moderate, with xx deals recorded in the historical period, primarily focused on expanding product portfolios and geographic reach.
- Market Concentration: Moderately consolidated, with top 5 players holding approximately xx% market share in 2025.
- Technological Innovation: Focus on rapid, portable, and user-friendly devices drives market growth.
- Regulatory Landscape: Stringent regulations in food safety and healthcare sectors fuel demand.
- Competitive Substitutes: Limited, due to the speed and convenience of ATP testing.
- End-User Demographics: Diverse, including food & beverage, healthcare, pharmaceuticals, and environmental monitoring.
- M&A Activity: xx deals in the historical period (2019-2024), primarily focused on expansion.
ATP Testing Products Growth Trends & Insights
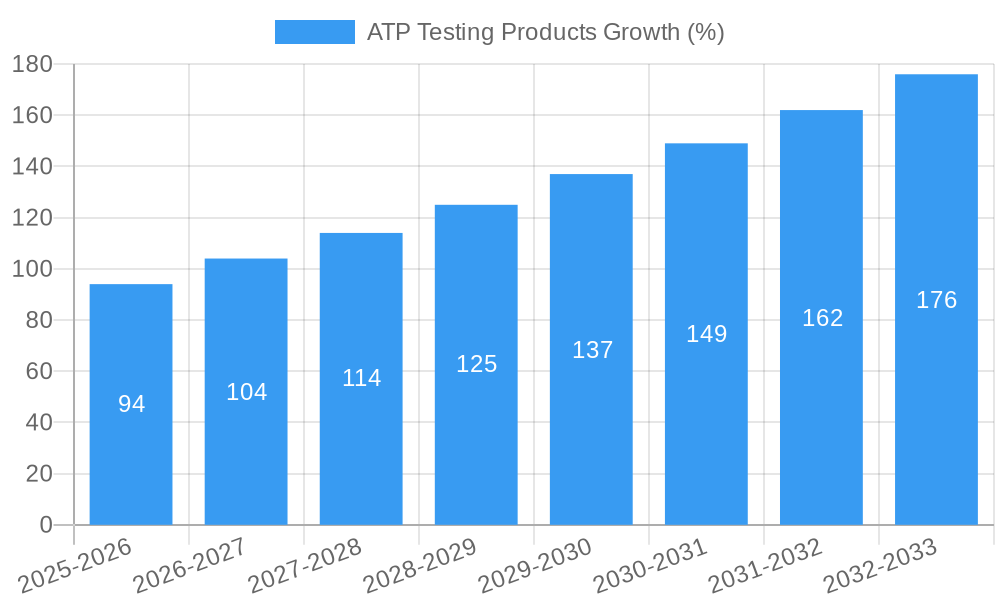
The global ATP testing products market demonstrates robust growth, exhibiting a CAGR of xx% during the forecast period (2025-2033). Market size is projected to reach xx million units by 2033. Increased awareness of hygiene and sanitation standards across various industries, along with technological advancements leading to improved accuracy and efficiency of ATP testing, are key drivers. Market penetration in developing economies remains relatively low, presenting significant growth potential. Consumer behavior shifts toward greater demand for safe and high-quality products in the food and beverage and healthcare sectors further bolster market expansion. Technological disruptions, such as the introduction of IoT-enabled devices and AI-driven data analysis tools, are transforming the industry, enabling predictive maintenance and improved process control.
(Note: This section requires specific data (XXX) to fill in the details on CAGR, market penetration, and specific technological disruptions for a comprehensive analysis. Placeholder values are used until these data are supplied.)
Dominant Regions, Countries, or Segments in ATP Testing Products
North America and Europe currently dominate the ATP testing products market, driven by stringent regulatory frameworks, high adoption rates, and significant investments in research and development. However, Asia-Pacific is expected to witness the fastest growth rate during the forecast period, fueled by rapid industrialization, increasing disposable incomes, and rising awareness of hygiene and sanitation.
- North America: High adoption rates, stringent regulations, and well-established healthcare and food industries.
- Europe: Similar to North America, with a strong regulatory environment and technological advancements.
- Asia-Pacific: Fastest-growing region, driven by industrialization, rising disposable incomes, and increasing awareness.
- Rest of the World: Moderate growth potential, with varying levels of regulatory stringency and market maturity.
(Note: This section would benefit from adding specific data on market share and projected growth rates for each region.)
ATP Testing Products Product Landscape
ATP testing products encompass a range of devices, from handheld luminometers to sophisticated laboratory analyzers. Innovations include rapid testing kits, portable devices with improved sensitivity, and software integrating data analysis and reporting features. These advancements reduce testing time, enhance accuracy, and simplify data management. Unique selling propositions often center around ease of use, rapid results, and data connectivity for improved workflow efficiency. Technological advancements are focused on improved sensitivity, miniaturization, and integration with existing laboratory information management systems (LIMS).
Key Drivers, Barriers & Challenges in ATP Testing Products
Key Drivers: Stringent hygiene regulations, increasing consumer awareness of food safety, and technological advancements driving device improvements.
Challenges & Restraints: High initial investment costs for advanced equipment can limit adoption in smaller businesses. Supply chain disruptions and potential raw material shortages may impact product availability and prices. Competitive pressures from new entrants and established players contribute to price erosion.
Emerging Opportunities in ATP Testing Products
Untapped markets in developing economies present significant growth opportunities. The increasing demand for rapid and on-site testing in various sectors like environmental monitoring and industrial hygiene provides potential new applications for ATP testing. Development of user-friendly, cost-effective devices targeting smaller businesses and individual consumers can expand market reach.
Growth Accelerators in the ATP Testing Products Industry
Technological breakthroughs, particularly in miniaturization, sensitivity enhancement, and data integration, are key growth accelerators. Strategic partnerships between technology providers and end-user industries, as well as targeted marketing campaigns focused on educating potential consumers on the benefits of ATP testing, will significantly contribute to market expansion. Government initiatives promoting food safety and hygiene further stimulate market growth.
Key Players Shaping the ATP Testing Products Market
- Hygiena
- 3M
- Charm Sciences
- Kikkoman Biochemifa
- Neogen
- Ecolab
- Merck Millipore
- Lumin Ultra
- Hach
- Charles River
- PCE Instruments
- Creative Diagnostics
- Thermo Fisher Scientific
- Pharmacal Research Laboratories
- Ruhof
- Cellar-Tek
- Parish Maintenance Supply
- Fc-bios Snd Bhd
- Shanghai Precision Instrument
- Shenbei Scientific Instrument
- Merck Millipore
Notable Milestones in ATP Testing Products Sector
- 2020: Launch of a new generation of handheld ATP meters with enhanced sensitivity and data connectivity by Hygiena.
- 2022: Acquisition of a smaller ATP testing company by 3M, expanding its product portfolio.
- 2023: Introduction of a rapid ATP testing kit for food safety applications by Charm Sciences. (Add more milestones with specific years and months as they become available)
In-Depth ATP Testing Products Market Outlook
The ATP testing products market is poised for continued growth, driven by technological advancements, increasing regulatory pressures, and rising consumer demand for hygiene and safety. Strategic opportunities include expanding into emerging markets, developing innovative applications, and forging strategic partnerships to leverage technological advancements and market expertise. The market's long-term potential is significant, particularly in sectors experiencing rapid growth and increased awareness of hygiene standards.
ATP Testing Products Segmentation
-
1. Application
- 1.1. Food and Beverage
- 1.2. Healthcare
- 1.3. Water Treatment
- 1.4. Others
-
2. Types
- 2.1. ATP Testing Equipment
- 2.2. ATP Swabs
- 2.3. ATP Test Kits
ATP Testing Products Segmentation By Geography
-
1. North America
- 1.1. United States
- 1.2. Canada
- 1.3. Mexico
-
2. South America
- 2.1. Brazil
- 2.2. Argentina
- 2.3. Rest of South America
-
3. Europe
- 3.1. United Kingdom
- 3.2. Germany
- 3.3. France
- 3.4. Italy
- 3.5. Spain
- 3.6. Russia
- 3.7. Benelux
- 3.8. Nordics
- 3.9. Rest of Europe
-
4. Middle East & Africa
- 4.1. Turkey
- 4.2. Israel
- 4.3. GCC
- 4.4. North Africa
- 4.5. South Africa
- 4.6. Rest of Middle East & Africa
-
5. Asia Pacific
- 5.1. China
- 5.2. India
- 5.3. Japan
- 5.4. South Korea
- 5.5. ASEAN
- 5.6. Oceania
- 5.7. Rest of Asia Pacific

ATP Testing Products REPORT HIGHLIGHTS
| Aspects | Details |
|---|---|
| Study Period | 2019-2033 |
| Base Year | 2024 |
| Estimated Year | 2025 |
| Forecast Period | 2025-2033 |
| Historical Period | 2019-2024 |
| Growth Rate | CAGR of 8.2% from 2019-2033 |
| Segmentation |
|
Table of Contents
- 1. Introduction
- 1.1. Research Scope
- 1.2. Market Segmentation
- 1.3. Research Methodology
- 1.4. Definitions and Assumptions
- 2. Executive Summary
- 2.1. Introduction
- 3. Market Dynamics
- 3.1. Introduction
- 3.2. Market Drivers
- 3.3. Market Restrains
- 3.4. Market Trends
- 4. Market Factor Analysis
- 4.1. Porters Five Forces
- 4.2. Supply/Value Chain
- 4.3. PESTEL analysis
- 4.4. Market Entropy
- 4.5. Patent/Trademark Analysis
- 5. Global ATP Testing Products Analysis, Insights and Forecast, 2019-2031
- 5.1. Market Analysis, Insights and Forecast - by Application
- 5.1.1. Food and Beverage
- 5.1.2. Healthcare
- 5.1.3. Water Treatment
- 5.1.4. Others
- 5.2. Market Analysis, Insights and Forecast - by Types
- 5.2.1. ATP Testing Equipment
- 5.2.2. ATP Swabs
- 5.2.3. ATP Test Kits
- 5.3. Market Analysis, Insights and Forecast - by Region
- 5.3.1. North America
- 5.3.2. South America
- 5.3.3. Europe
- 5.3.4. Middle East & Africa
- 5.3.5. Asia Pacific
- 5.1. Market Analysis, Insights and Forecast - by Application
- 6. North America ATP Testing Products Analysis, Insights and Forecast, 2019-2031
- 6.1. Market Analysis, Insights and Forecast - by Application
- 6.1.1. Food and Beverage
- 6.1.2. Healthcare
- 6.1.3. Water Treatment
- 6.1.4. Others
- 6.2. Market Analysis, Insights and Forecast - by Types
- 6.2.1. ATP Testing Equipment
- 6.2.2. ATP Swabs
- 6.2.3. ATP Test Kits
- 6.1. Market Analysis, Insights and Forecast - by Application
- 7. South America ATP Testing Products Analysis, Insights and Forecast, 2019-2031
- 7.1. Market Analysis, Insights and Forecast - by Application
- 7.1.1. Food and Beverage
- 7.1.2. Healthcare
- 7.1.3. Water Treatment
- 7.1.4. Others
- 7.2. Market Analysis, Insights and Forecast - by Types
- 7.2.1. ATP Testing Equipment
- 7.2.2. ATP Swabs
- 7.2.3. ATP Test Kits
- 7.1. Market Analysis, Insights and Forecast - by Application
- 8. Europe ATP Testing Products Analysis, Insights and Forecast, 2019-2031
- 8.1. Market Analysis, Insights and Forecast - by Application
- 8.1.1. Food and Beverage
- 8.1.2. Healthcare
- 8.1.3. Water Treatment
- 8.1.4. Others
- 8.2. Market Analysis, Insights and Forecast - by Types
- 8.2.1. ATP Testing Equipment
- 8.2.2. ATP Swabs
- 8.2.3. ATP Test Kits
- 8.1. Market Analysis, Insights and Forecast - by Application
- 9. Middle East & Africa ATP Testing Products Analysis, Insights and Forecast, 2019-2031
- 9.1. Market Analysis, Insights and Forecast - by Application
- 9.1.1. Food and Beverage
- 9.1.2. Healthcare
- 9.1.3. Water Treatment
- 9.1.4. Others
- 9.2. Market Analysis, Insights and Forecast - by Types
- 9.2.1. ATP Testing Equipment
- 9.2.2. ATP Swabs
- 9.2.3. ATP Test Kits
- 9.1. Market Analysis, Insights and Forecast - by Application
- 10. Asia Pacific ATP Testing Products Analysis, Insights and Forecast, 2019-2031
- 10.1. Market Analysis, Insights and Forecast - by Application
- 10.1.1. Food and Beverage
- 10.1.2. Healthcare
- 10.1.3. Water Treatment
- 10.1.4. Others
- 10.2. Market Analysis, Insights and Forecast - by Types
- 10.2.1. ATP Testing Equipment
- 10.2.2. ATP Swabs
- 10.2.3. ATP Test Kits
- 10.1. Market Analysis, Insights and Forecast - by Application
- 11. Competitive Analysis
- 11.1. Global Market Share Analysis 2024
- 11.2. Company Profiles
- 11.2.1 Hygiena
- 11.2.1.1. Overview
- 11.2.1.2. Products
- 11.2.1.3. SWOT Analysis
- 11.2.1.4. Recent Developments
- 11.2.1.5. Financials (Based on Availability)
- 11.2.2 3M
- 11.2.2.1. Overview
- 11.2.2.2. Products
- 11.2.2.3. SWOT Analysis
- 11.2.2.4. Recent Developments
- 11.2.2.5. Financials (Based on Availability)
- 11.2.3 Charm Sciences
- 11.2.3.1. Overview
- 11.2.3.2. Products
- 11.2.3.3. SWOT Analysis
- 11.2.3.4. Recent Developments
- 11.2.3.5. Financials (Based on Availability)
- 11.2.4 Kikkoman Biochemifa
- 11.2.4.1. Overview
- 11.2.4.2. Products
- 11.2.4.3. SWOT Analysis
- 11.2.4.4. Recent Developments
- 11.2.4.5. Financials (Based on Availability)
- 11.2.5 Neogen
- 11.2.5.1. Overview
- 11.2.5.2. Products
- 11.2.5.3. SWOT Analysis
- 11.2.5.4. Recent Developments
- 11.2.5.5. Financials (Based on Availability)
- 11.2.6 Ecolab
- 11.2.6.1. Overview
- 11.2.6.2. Products
- 11.2.6.3. SWOT Analysis
- 11.2.6.4. Recent Developments
- 11.2.6.5. Financials (Based on Availability)
- 11.2.7 Merck Millipore
- 11.2.7.1. Overview
- 11.2.7.2. Products
- 11.2.7.3. SWOT Analysis
- 11.2.7.4. Recent Developments
- 11.2.7.5. Financials (Based on Availability)
- 11.2.8 Lumin Ultra
- 11.2.8.1. Overview
- 11.2.8.2. Products
- 11.2.8.3. SWOT Analysis
- 11.2.8.4. Recent Developments
- 11.2.8.5. Financials (Based on Availability)
- 11.2.9 Hach
- 11.2.9.1. Overview
- 11.2.9.2. Products
- 11.2.9.3. SWOT Analysis
- 11.2.9.4. Recent Developments
- 11.2.9.5. Financials (Based on Availability)
- 11.2.10 Charles River
- 11.2.10.1. Overview
- 11.2.10.2. Products
- 11.2.10.3. SWOT Analysis
- 11.2.10.4. Recent Developments
- 11.2.10.5. Financials (Based on Availability)
- 11.2.11 PCE Instruments
- 11.2.11.1. Overview
- 11.2.11.2. Products
- 11.2.11.3. SWOT Analysis
- 11.2.11.4. Recent Developments
- 11.2.11.5. Financials (Based on Availability)
- 11.2.12 Creative Diagnostics
- 11.2.12.1. Overview
- 11.2.12.2. Products
- 11.2.12.3. SWOT Analysis
- 11.2.12.4. Recent Developments
- 11.2.12.5. Financials (Based on Availability)
- 11.2.13 Thermo Fisher Scientific
- 11.2.13.1. Overview
- 11.2.13.2. Products
- 11.2.13.3. SWOT Analysis
- 11.2.13.4. Recent Developments
- 11.2.13.5. Financials (Based on Availability)
- 11.2.14 Pharmacal Research Laboratories
- 11.2.14.1. Overview
- 11.2.14.2. Products
- 11.2.14.3. SWOT Analysis
- 11.2.14.4. Recent Developments
- 11.2.14.5. Financials (Based on Availability)
- 11.2.15 Ruhof
- 11.2.15.1. Overview
- 11.2.15.2. Products
- 11.2.15.3. SWOT Analysis
- 11.2.15.4. Recent Developments
- 11.2.15.5. Financials (Based on Availability)
- 11.2.16 Cellar-Tek
- 11.2.16.1. Overview
- 11.2.16.2. Products
- 11.2.16.3. SWOT Analysis
- 11.2.16.4. Recent Developments
- 11.2.16.5. Financials (Based on Availability)
- 11.2.17 Parish Maintenance Supply
- 11.2.17.1. Overview
- 11.2.17.2. Products
- 11.2.17.3. SWOT Analysis
- 11.2.17.4. Recent Developments
- 11.2.17.5. Financials (Based on Availability)
- 11.2.18 Fc-bios Snd Bhd
- 11.2.18.1. Overview
- 11.2.18.2. Products
- 11.2.18.3. SWOT Analysis
- 11.2.18.4. Recent Developments
- 11.2.18.5. Financials (Based on Availability)
- 11.2.19 Shanghai Precision Instrument
- 11.2.19.1. Overview
- 11.2.19.2. Products
- 11.2.19.3. SWOT Analysis
- 11.2.19.4. Recent Developments
- 11.2.19.5. Financials (Based on Availability)
- 11.2.20 Shenbei Scientific Instrument
- 11.2.20.1. Overview
- 11.2.20.2. Products
- 11.2.20.3. SWOT Analysis
- 11.2.20.4. Recent Developments
- 11.2.20.5. Financials (Based on Availability)
- 11.2.21 Merck Millipore
- 11.2.21.1. Overview
- 11.2.21.2. Products
- 11.2.21.3. SWOT Analysis
- 11.2.21.4. Recent Developments
- 11.2.21.5. Financials (Based on Availability)
- 11.2.1 Hygiena
List of Figures
- Figure 1: Global ATP Testing Products Revenue Breakdown (million, %) by Region 2024 & 2032
- Figure 2: North America ATP Testing Products Revenue (million), by Application 2024 & 2032
- Figure 3: North America ATP Testing Products Revenue Share (%), by Application 2024 & 2032
- Figure 4: North America ATP Testing Products Revenue (million), by Types 2024 & 2032
- Figure 5: North America ATP Testing Products Revenue Share (%), by Types 2024 & 2032
- Figure 6: North America ATP Testing Products Revenue (million), by Country 2024 & 2032
- Figure 7: North America ATP Testing Products Revenue Share (%), by Country 2024 & 2032
- Figure 8: South America ATP Testing Products Revenue (million), by Application 2024 & 2032
- Figure 9: South America ATP Testing Products Revenue Share (%), by Application 2024 & 2032
- Figure 10: South America ATP Testing Products Revenue (million), by Types 2024 & 2032
- Figure 11: South America ATP Testing Products Revenue Share (%), by Types 2024 & 2032
- Figure 12: South America ATP Testing Products Revenue (million), by Country 2024 & 2032
- Figure 13: South America ATP Testing Products Revenue Share (%), by Country 2024 & 2032
- Figure 14: Europe ATP Testing Products Revenue (million), by Application 2024 & 2032
- Figure 15: Europe ATP Testing Products Revenue Share (%), by Application 2024 & 2032
- Figure 16: Europe ATP Testing Products Revenue (million), by Types 2024 & 2032
- Figure 17: Europe ATP Testing Products Revenue Share (%), by Types 2024 & 2032
- Figure 18: Europe ATP Testing Products Revenue (million), by Country 2024 & 2032
- Figure 19: Europe ATP Testing Products Revenue Share (%), by Country 2024 & 2032
- Figure 20: Middle East & Africa ATP Testing Products Revenue (million), by Application 2024 & 2032
- Figure 21: Middle East & Africa ATP Testing Products Revenue Share (%), by Application 2024 & 2032
- Figure 22: Middle East & Africa ATP Testing Products Revenue (million), by Types 2024 & 2032
- Figure 23: Middle East & Africa ATP Testing Products Revenue Share (%), by Types 2024 & 2032
- Figure 24: Middle East & Africa ATP Testing Products Revenue (million), by Country 2024 & 2032
- Figure 25: Middle East & Africa ATP Testing Products Revenue Share (%), by Country 2024 & 2032
- Figure 26: Asia Pacific ATP Testing Products Revenue (million), by Application 2024 & 2032
- Figure 27: Asia Pacific ATP Testing Products Revenue Share (%), by Application 2024 & 2032
- Figure 28: Asia Pacific ATP Testing Products Revenue (million), by Types 2024 & 2032
- Figure 29: Asia Pacific ATP Testing Products Revenue Share (%), by Types 2024 & 2032
- Figure 30: Asia Pacific ATP Testing Products Revenue (million), by Country 2024 & 2032
- Figure 31: Asia Pacific ATP Testing Products Revenue Share (%), by Country 2024 & 2032
List of Tables
- Table 1: Global ATP Testing Products Revenue million Forecast, by Region 2019 & 2032
- Table 2: Global ATP Testing Products Revenue million Forecast, by Application 2019 & 2032
- Table 3: Global ATP Testing Products Revenue million Forecast, by Types 2019 & 2032
- Table 4: Global ATP Testing Products Revenue million Forecast, by Region 2019 & 2032
- Table 5: Global ATP Testing Products Revenue million Forecast, by Application 2019 & 2032
- Table 6: Global ATP Testing Products Revenue million Forecast, by Types 2019 & 2032
- Table 7: Global ATP Testing Products Revenue million Forecast, by Country 2019 & 2032
- Table 8: United States ATP Testing Products Revenue (million) Forecast, by Application 2019 & 2032
- Table 9: Canada ATP Testing Products Revenue (million) Forecast, by Application 2019 & 2032
- Table 10: Mexico ATP Testing Products Revenue (million) Forecast, by Application 2019 & 2032
- Table 11: Global ATP Testing Products Revenue million Forecast, by Application 2019 & 2032
- Table 12: Global ATP Testing Products Revenue million Forecast, by Types 2019 & 2032
- Table 13: Global ATP Testing Products Revenue million Forecast, by Country 2019 & 2032
- Table 14: Brazil ATP Testing Products Revenue (million) Forecast, by Application 2019 & 2032
- Table 15: Argentina ATP Testing Products Revenue (million) Forecast, by Application 2019 & 2032
- Table 16: Rest of South America ATP Testing Products Revenue (million) Forecast, by Application 2019 & 2032
- Table 17: Global ATP Testing Products Revenue million Forecast, by Application 2019 & 2032
- Table 18: Global ATP Testing Products Revenue million Forecast, by Types 2019 & 2032
- Table 19: Global ATP Testing Products Revenue million Forecast, by Country 2019 & 2032
- Table 20: United Kingdom ATP Testing Products Revenue (million) Forecast, by Application 2019 & 2032
- Table 21: Germany ATP Testing Products Revenue (million) Forecast, by Application 2019 & 2032
- Table 22: France ATP Testing Products Revenue (million) Forecast, by Application 2019 & 2032
- Table 23: Italy ATP Testing Products Revenue (million) Forecast, by Application 2019 & 2032
- Table 24: Spain ATP Testing Products Revenue (million) Forecast, by Application 2019 & 2032
- Table 25: Russia ATP Testing Products Revenue (million) Forecast, by Application 2019 & 2032
- Table 26: Benelux ATP Testing Products Revenue (million) Forecast, by Application 2019 & 2032
- Table 27: Nordics ATP Testing Products Revenue (million) Forecast, by Application 2019 & 2032
- Table 28: Rest of Europe ATP Testing Products Revenue (million) Forecast, by Application 2019 & 2032
- Table 29: Global ATP Testing Products Revenue million Forecast, by Application 2019 & 2032
- Table 30: Global ATP Testing Products Revenue million Forecast, by Types 2019 & 2032
- Table 31: Global ATP Testing Products Revenue million Forecast, by Country 2019 & 2032
- Table 32: Turkey ATP Testing Products Revenue (million) Forecast, by Application 2019 & 2032
- Table 33: Israel ATP Testing Products Revenue (million) Forecast, by Application 2019 & 2032
- Table 34: GCC ATP Testing Products Revenue (million) Forecast, by Application 2019 & 2032
- Table 35: North Africa ATP Testing Products Revenue (million) Forecast, by Application 2019 & 2032
- Table 36: South Africa ATP Testing Products Revenue (million) Forecast, by Application 2019 & 2032
- Table 37: Rest of Middle East & Africa ATP Testing Products Revenue (million) Forecast, by Application 2019 & 2032
- Table 38: Global ATP Testing Products Revenue million Forecast, by Application 2019 & 2032
- Table 39: Global ATP Testing Products Revenue million Forecast, by Types 2019 & 2032
- Table 40: Global ATP Testing Products Revenue million Forecast, by Country 2019 & 2032
- Table 41: China ATP Testing Products Revenue (million) Forecast, by Application 2019 & 2032
- Table 42: India ATP Testing Products Revenue (million) Forecast, by Application 2019 & 2032
- Table 43: Japan ATP Testing Products Revenue (million) Forecast, by Application 2019 & 2032
- Table 44: South Korea ATP Testing Products Revenue (million) Forecast, by Application 2019 & 2032
- Table 45: ASEAN ATP Testing Products Revenue (million) Forecast, by Application 2019 & 2032
- Table 46: Oceania ATP Testing Products Revenue (million) Forecast, by Application 2019 & 2032
- Table 47: Rest of Asia Pacific ATP Testing Products Revenue (million) Forecast, by Application 2019 & 2032
Frequently Asked Questions
1. What is the projected Compound Annual Growth Rate (CAGR) of the ATP Testing Products?
The projected CAGR is approximately 8.2%.
2. Which companies are prominent players in the ATP Testing Products?
Key companies in the market include Hygiena, 3M, Charm Sciences, Kikkoman Biochemifa, Neogen, Ecolab, Merck Millipore, Lumin Ultra, Hach, Charles River, PCE Instruments, Creative Diagnostics, Thermo Fisher Scientific, Pharmacal Research Laboratories, Ruhof, Cellar-Tek, Parish Maintenance Supply, Fc-bios Snd Bhd, Shanghai Precision Instrument, Shenbei Scientific Instrument, Merck Millipore.
3. What are the main segments of the ATP Testing Products?
The market segments include Application, Types.
4. Can you provide details about the market size?
The market size is estimated to be USD 1142 million as of 2022.
5. What are some drivers contributing to market growth?
N/A
6. What are the notable trends driving market growth?
N/A
7. Are there any restraints impacting market growth?
N/A
8. Can you provide examples of recent developments in the market?
N/A
9. What pricing options are available for accessing the report?
Pricing options include single-user, multi-user, and enterprise licenses priced at USD 4900.00, USD 7350.00, and USD 9800.00 respectively.
10. Is the market size provided in terms of value or volume?
The market size is provided in terms of value, measured in million.
11. Are there any specific market keywords associated with the report?
Yes, the market keyword associated with the report is "ATP Testing Products," which aids in identifying and referencing the specific market segment covered.
12. How do I determine which pricing option suits my needs best?
The pricing options vary based on user requirements and access needs. Individual users may opt for single-user licenses, while businesses requiring broader access may choose multi-user or enterprise licenses for cost-effective access to the report.
13. Are there any additional resources or data provided in the ATP Testing Products report?
While the report offers comprehensive insights, it's advisable to review the specific contents or supplementary materials provided to ascertain if additional resources or data are available.
14. How can I stay updated on further developments or reports in the ATP Testing Products?
To stay informed about further developments, trends, and reports in the ATP Testing Products, consider subscribing to industry newsletters, following relevant companies and organizations, or regularly checking reputable industry news sources and publications.
Methodology
Step 1 - Identification of Relevant Samples Size from Population Database


Step 2 - Approaches for Defining Global Market Size (Value, Volume* & Price*)

Note*: In applicable scenarios
Step 3 - Data Sources
Primary Research
- Web Analytics
- Survey Reports
- Research Institute
- Latest Research Reports
- Opinion Leaders
Secondary Research
- Annual Reports
- White Paper
- Latest Press Release
- Industry Association
- Paid Database
- Investor Presentations

Step 4 - Data Triangulation
Involves using different sources of information in order to increase the validity of a study
These sources are likely to be stakeholders in a program - participants, other researchers, program staff, other community members, and so on.
Then we put all data in single framework & apply various statistical tools to find out the dynamic on the market.
During the analysis stage, feedback from the stakeholder groups would be compared to determine areas of agreement as well as areas of divergence
