

Key Insights
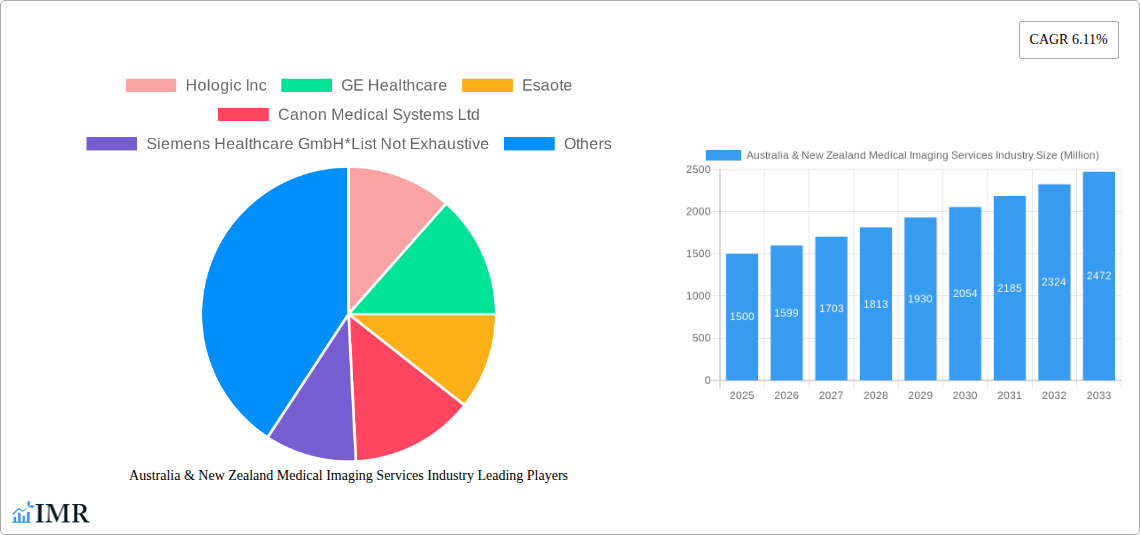
The Australia & New Zealand medical imaging services market is experiencing robust growth, projected to maintain a Compound Annual Growth Rate (CAGR) of 6.11% from 2025 to 2033. This expansion is fueled by several key factors. The aging population in both countries is driving increased demand for diagnostic imaging services, particularly for conditions prevalent in older adults such as cardiovascular disease, cancer, and neurological disorders. Technological advancements in medical imaging modalities, including higher-resolution MRI and CT scanners, improved ultrasound technology, and the increasing adoption of AI-powered image analysis tools, are enhancing diagnostic accuracy and efficiency, further boosting market growth. Government initiatives promoting preventative healthcare and early disease detection are also contributing positively. The market is segmented by application (cardiology, oncology, neurology, orthopedics, gastroenterology, gynecology, and others), end-user (hospitals, diagnostic centers, and others), and modality (MRI, CT, ultrasound, X-ray, nuclear imaging, fluoroscopy, mammography). Hospitals currently hold the largest market share among end-users, owing to their comprehensive diagnostic capabilities and established infrastructure. However, the rise of specialized diagnostic centers is anticipated to increase their market share in the coming years.
The competitive landscape comprises both global giants like GE Healthcare, Siemens Healthineers, and Philips, along with smaller, specialized players. These companies are actively investing in research and development, strategic partnerships, and mergers and acquisitions to expand their market presence and product portfolios. While the market faces certain challenges, including high costs associated with advanced imaging technologies and the need for skilled professionals to operate and interpret the resulting images, the overall growth trajectory remains positive. The increasing prevalence of chronic diseases and the focus on improving healthcare infrastructure within Australia and New Zealand will continue to drive demand for high-quality medical imaging services throughout the forecast period. Specific growth within individual segments will likely be influenced by factors such as the prevalence of specific diseases and government funding priorities.
Australia & New Zealand Medical Imaging Services Industry Market Report: 2019-2033
This comprehensive report provides an in-depth analysis of the Australia & New Zealand medical imaging services market, offering invaluable insights for industry professionals, investors, and strategic planners. We cover market dynamics, growth trends, dominant segments, key players, and future opportunities, leveraging data from the study period 2019-2024, with a base year of 2025 and forecasts extending to 2033. The total market size in 2025 is estimated at XX Million.
Australia & New Zealand Medical Imaging Services Industry Market Dynamics & Structure
The Australian and New Zealand medical imaging services market is characterized by a moderately concentrated landscape, with key players like Hologic Inc, GE Healthcare, Esaote, Canon Medical Systems Ltd, Siemens Healthcare GmbH, Carestream Health, Koninklijke Philips NV, and Fujifilm Holdings Corporation holding significant market share. However, the market also accommodates several smaller, specialized providers. Technological innovation, particularly in AI and portable imaging, is a significant driver, alongside a strong regulatory framework focused on patient safety and data privacy. The market faces competition from substitute technologies, such as advanced diagnostic tests, while end-user demographics, including an aging population and increasing prevalence of chronic diseases, fuel demand. M&A activity within the sector has been moderate in recent years, with approximately XX deals recorded between 2019-2024, resulting in a slight increase in market consolidation.
- Market Concentration: Moderately concentrated, with top players holding approximately XX% market share in 2025.
- Technological Innovation: AI-powered diagnostics, portable imaging systems, and improved image resolution are key drivers.
- Regulatory Framework: Stringent regulations ensure quality and patient safety, potentially impacting innovation speed.
- Competitive Substitutes: Advanced blood tests and other diagnostic methods pose some competitive threat.
- End-User Demographics: Aging population and rising chronic disease prevalence drive demand.
- M&A Trends: Moderate activity, resulting in consolidation amongst smaller players. XX deals recorded between 2019 and 2024.
Australia & New Zealand Medical Imaging Services Industry Growth Trends & Insights
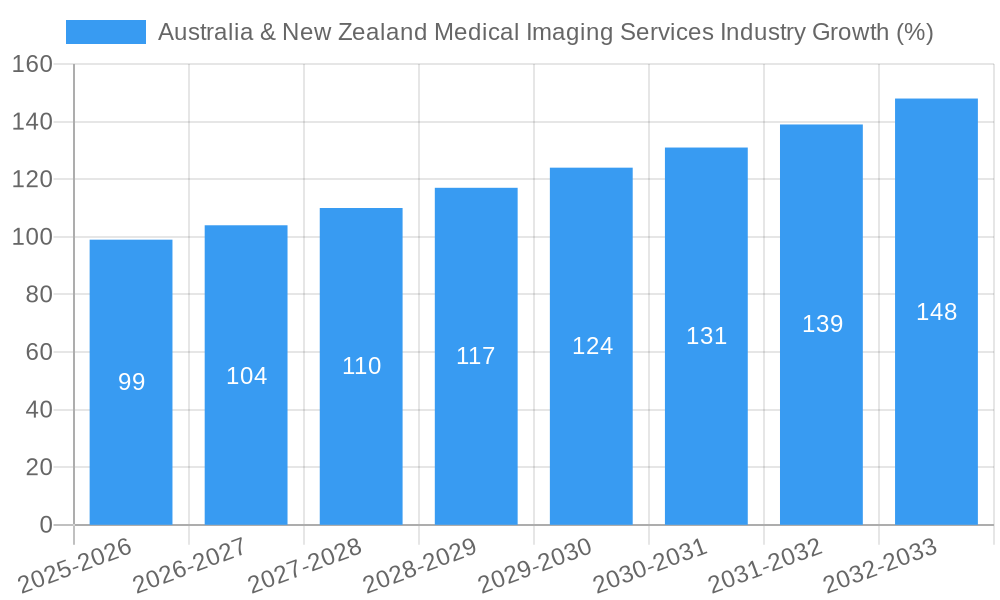
The Australian and New Zealand medical imaging services market experienced robust growth during the historical period (2019-2024), with a Compound Annual Growth Rate (CAGR) of XX%. This growth is projected to continue throughout the forecast period (2025-2033), with a forecasted CAGR of XX%, reaching an estimated market size of XX Million by 2033. This expansion is fueled by technological advancements, increasing healthcare expenditure, and rising awareness of preventative healthcare. Market penetration for advanced imaging modalities, such as MRI and CT scans, continues to increase, while adoption of AI-powered diagnostic tools is gaining traction. Consumer behavior shifts are evident in increased demand for convenient and accessible imaging services. The market is characterized by a high degree of technology adoption, with regular upgrades in equipment and software to improve efficiency and diagnostic accuracy.
Dominant Regions, Countries, or Segments in Australia & New Zealand Medical Imaging Services Industry
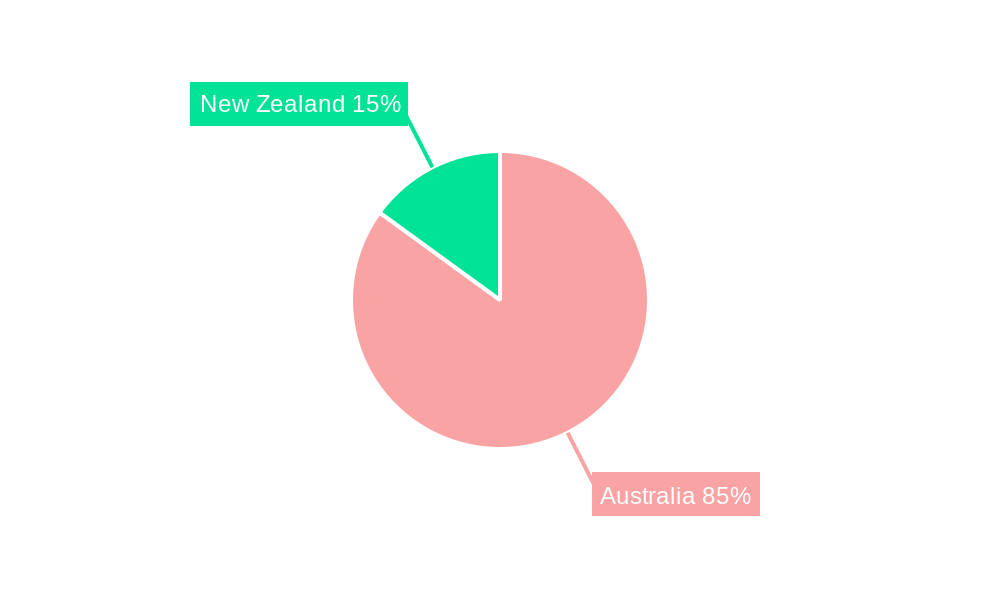
The Australian market represents a larger share (XX%) of the overall Australia & New Zealand medical imaging services market compared to New Zealand (XX%) in 2025. Within the segments, the Hospital end-user segment holds the largest market share (XX%) due to higher volume and availability of advanced technologies. By modality, Computed Tomography (CT) and Magnetic Resonance Imaging (MRI) are the dominant segments, reflecting the importance of these technologies in diagnosing a wide range of conditions. By application, Cardiology and Oncology show strong growth potential driven by the increasing prevalence of cardiovascular diseases and cancers, respectively.
- Key Drivers (Australia): Higher healthcare expenditure, advanced medical infrastructure, strong government initiatives.
- Key Drivers (New Zealand): Growing focus on preventative healthcare, government funding for healthcare technology upgrades.
- Dominant Segments: Hospitals (End User), CT and MRI (Modality), Cardiology and Oncology (Application).
Australia & New Zealand Medical Imaging Services Industry Product Landscape
The medical imaging product landscape is dynamic, with continuous advancements in resolution, speed, and integration of AI. Manufacturers are focusing on developing portable and user-friendly systems, reducing costs, and improving diagnostic accuracy. New products incorporate advanced features like AI-powered image analysis, reducing human error and improving diagnostic efficiency. Unique selling propositions frequently centre on superior image quality, reduced radiation exposure, or streamlined workflow integration.
Key Drivers, Barriers & Challenges in Australia & New Zealand Medical Imaging Services Industry
Key Drivers: Increasing prevalence of chronic diseases, technological advancements leading to better diagnostics, rising healthcare expenditure, and government initiatives promoting preventative healthcare.
Key Challenges: High equipment costs, stringent regulatory approvals, skilled workforce shortages, and the potential for data security breaches. The impact of supply chain disruptions on equipment availability has also been significant, leading to XX% increase in equipment costs in 2024.
Emerging Opportunities in Australia & New Zealand Medical Imaging Services Industry
Emerging opportunities lie in the adoption of AI-driven diagnostic tools, telehealth integration, development of more cost-effective imaging solutions, focus on preventative care, and expanding services in underserved rural areas. The growing interest in personalized medicine also presents new opportunities for tailored imaging solutions.
Growth Accelerators in the Australia & New Zealand Medical Imaging Services Industry
Technological breakthroughs, especially in AI and minimally invasive procedures, coupled with strategic partnerships between imaging providers and healthcare institutions, are fueling growth. Government investments in healthcare infrastructure and proactive strategies to expand access to imaging services in remote areas also contribute to market expansion.
Key Players Shaping the Australia & New Zealand Medical Imaging Services Market
- Hologic Inc
- GE Healthcare
- Esaote
- Canon Medical Systems Ltd
- Siemens Healthcare GmbH
- Carestream Health
- Koninklijke Philips NV
- Fujifilm Holdings Corporation
Notable Milestones in Australia & New Zealand Medical Imaging Services Industry Sector
- May 2022: EMVision (Australia) develops portable brain imaging technology.
- May 2022: Toku Eyes (New Zealand) unveils AI-powered heart risk assessment using retinal scans.
In-Depth Australia & New Zealand Medical Imaging Services Industry Market Outlook
The future of the Australia & New Zealand medical imaging services market is bright, driven by continued technological advancements, an aging population, and increasing emphasis on preventative healthcare. Strategic opportunities exist for companies that can leverage AI, develop cost-effective solutions, and expand into underserved markets. The market is poised for sustained growth, offering lucrative opportunities for both established players and innovative newcomers.
Australia & New Zealand Medical Imaging Services Industry Segmentation
-
1. Modality
- 1.1. MRI
- 1.2. Computed Tomography
- 1.3. Ultrasound
- 1.4. X-ray
- 1.5. Nuclear Imaging
- 1.6. Fluoroscopy
- 1.7. Mamography
-
2. Application
- 2.1. Cardiology
- 2.2. Oncology
- 2.3. Neurology
- 2.4. Orthopedics
- 2.5. Gastroenterology
- 2.6. Gynecology
- 2.7. Other Applications
-
3. End User
- 3.1. Hospital
- 3.2. Diagnostic Centers
- 3.3. Others
Australia & New Zealand Medical Imaging Services Industry Segmentation By Geography
- 1. Australia
Australia & New Zealand Medical Imaging Services Industry REPORT HIGHLIGHTS
| Aspects | Details |
|---|---|
| Study Period | 2019-2033 |
| Base Year | 2024 |
| Estimated Year | 2025 |
| Forecast Period | 2025-2033 |
| Historical Period | 2019-2024 |
| Growth Rate | CAGR of 6.11% from 2019-2033 |
| Segmentation |
|
Table of Contents
- 1. Introduction
- 1.1. Research Scope
- 1.2. Market Segmentation
- 1.3. Research Methodology
- 1.4. Definitions and Assumptions
- 2. Executive Summary
- 2.1. Introduction
- 3. Market Dynamics
- 3.1. Introduction
- 3.2. Market Drivers
- 3.2.1. Technological Advancements; Growth Burden of Chronic Diseases
- 3.3. Market Restrains
- 3.3.1. High Cost of Advanced Diagnostic Imaging Devices
- 3.4. Market Trends
- 3.4.1. X-ray Segment Captures the Largest Market Share and is Expected to Retain its Dominance over the Forecast Period
- 4. Market Factor Analysis
- 4.1. Porters Five Forces
- 4.2. Supply/Value Chain
- 4.3. PESTEL analysis
- 4.4. Market Entropy
- 4.5. Patent/Trademark Analysis
- 5. Australia & New Zealand Medical Imaging Services Industry Analysis, Insights and Forecast, 2019-2031
- 5.1. Market Analysis, Insights and Forecast - by Modality
- 5.1.1. MRI
- 5.1.2. Computed Tomography
- 5.1.3. Ultrasound
- 5.1.4. X-ray
- 5.1.5. Nuclear Imaging
- 5.1.6. Fluoroscopy
- 5.1.7. Mamography
- 5.2. Market Analysis, Insights and Forecast - by Application
- 5.2.1. Cardiology
- 5.2.2. Oncology
- 5.2.3. Neurology
- 5.2.4. Orthopedics
- 5.2.5. Gastroenterology
- 5.2.6. Gynecology
- 5.2.7. Other Applications
- 5.3. Market Analysis, Insights and Forecast - by End User
- 5.3.1. Hospital
- 5.3.2. Diagnostic Centers
- 5.3.3. Others
- 5.4. Market Analysis, Insights and Forecast - by Region
- 5.4.1. Australia
- 5.1. Market Analysis, Insights and Forecast - by Modality
- 6. Competitive Analysis
- 6.1. Market Share Analysis 2024
- 6.2. Company Profiles
- 6.2.1 Hologic Inc
- 6.2.1.1. Overview
- 6.2.1.2. Products
- 6.2.1.3. SWOT Analysis
- 6.2.1.4. Recent Developments
- 6.2.1.5. Financials (Based on Availability)
- 6.2.2 GE Healthcare
- 6.2.2.1. Overview
- 6.2.2.2. Products
- 6.2.2.3. SWOT Analysis
- 6.2.2.4. Recent Developments
- 6.2.2.5. Financials (Based on Availability)
- 6.2.3 Esaote
- 6.2.3.1. Overview
- 6.2.3.2. Products
- 6.2.3.3. SWOT Analysis
- 6.2.3.4. Recent Developments
- 6.2.3.5. Financials (Based on Availability)
- 6.2.4 Canon Medical Systems Ltd
- 6.2.4.1. Overview
- 6.2.4.2. Products
- 6.2.4.3. SWOT Analysis
- 6.2.4.4. Recent Developments
- 6.2.4.5. Financials (Based on Availability)
- 6.2.5 Siemens Healthcare GmbH*List Not Exhaustive
- 6.2.5.1. Overview
- 6.2.5.2. Products
- 6.2.5.3. SWOT Analysis
- 6.2.5.4. Recent Developments
- 6.2.5.5. Financials (Based on Availability)
- 6.2.6 Carestream Health
- 6.2.6.1. Overview
- 6.2.6.2. Products
- 6.2.6.3. SWOT Analysis
- 6.2.6.4. Recent Developments
- 6.2.6.5. Financials (Based on Availability)
- 6.2.7 Koninklijke Philips NV
- 6.2.7.1. Overview
- 6.2.7.2. Products
- 6.2.7.3. SWOT Analysis
- 6.2.7.4. Recent Developments
- 6.2.7.5. Financials (Based on Availability)
- 6.2.8 Fujifilm Holdings Corporation
- 6.2.8.1. Overview
- 6.2.8.2. Products
- 6.2.8.3. SWOT Analysis
- 6.2.8.4. Recent Developments
- 6.2.8.5. Financials (Based on Availability)
- 6.2.1 Hologic Inc
List of Figures
- Figure 1: Australia & New Zealand Medical Imaging Services Industry Revenue Breakdown (Million, %) by Product 2024 & 2032
- Figure 2: Australia & New Zealand Medical Imaging Services Industry Share (%) by Company 2024
List of Tables
- Table 1: Australia & New Zealand Medical Imaging Services Industry Revenue Million Forecast, by Region 2019 & 2032
- Table 2: Australia & New Zealand Medical Imaging Services Industry Revenue Million Forecast, by Modality 2019 & 2032
- Table 3: Australia & New Zealand Medical Imaging Services Industry Revenue Million Forecast, by Application 2019 & 2032
- Table 4: Australia & New Zealand Medical Imaging Services Industry Revenue Million Forecast, by End User 2019 & 2032
- Table 5: Australia & New Zealand Medical Imaging Services Industry Revenue Million Forecast, by Region 2019 & 2032
- Table 6: Australia & New Zealand Medical Imaging Services Industry Revenue Million Forecast, by Country 2019 & 2032
- Table 7: Australia & New Zealand Medical Imaging Services Industry Revenue Million Forecast, by Modality 2019 & 2032
- Table 8: Australia & New Zealand Medical Imaging Services Industry Revenue Million Forecast, by Application 2019 & 2032
- Table 9: Australia & New Zealand Medical Imaging Services Industry Revenue Million Forecast, by End User 2019 & 2032
- Table 10: Australia & New Zealand Medical Imaging Services Industry Revenue Million Forecast, by Country 2019 & 2032
Frequently Asked Questions
1. What is the projected Compound Annual Growth Rate (CAGR) of the Australia & New Zealand Medical Imaging Services Industry?
The projected CAGR is approximately 6.11%.
2. Which companies are prominent players in the Australia & New Zealand Medical Imaging Services Industry?
Key companies in the market include Hologic Inc, GE Healthcare, Esaote, Canon Medical Systems Ltd, Siemens Healthcare GmbH*List Not Exhaustive, Carestream Health, Koninklijke Philips NV, Fujifilm Holdings Corporation.
3. What are the main segments of the Australia & New Zealand Medical Imaging Services Industry?
The market segments include Modality, Application, End User.
4. Can you provide details about the market size?
The market size is estimated to be USD XX Million as of 2022.
5. What are some drivers contributing to market growth?
Technological Advancements; Growth Burden of Chronic Diseases.
6. What are the notable trends driving market growth?
X-ray Segment Captures the Largest Market Share and is Expected to Retain its Dominance over the Forecast Period.
7. Are there any restraints impacting market growth?
High Cost of Advanced Diagnostic Imaging Devices.
8. Can you provide examples of recent developments in the market?
In May 2022, The Australian medical technology company EMVision has developed portable brain imaging technology.
9. What pricing options are available for accessing the report?
Pricing options include single-user, multi-user, and enterprise licenses priced at USD 3800, USD 4500, and USD 5800 respectively.
10. Is the market size provided in terms of value or volume?
The market size is provided in terms of value, measured in Million.
11. Are there any specific market keywords associated with the report?
Yes, the market keyword associated with the report is "Australia & New Zealand Medical Imaging Services Industry," which aids in identifying and referencing the specific market segment covered.
12. How do I determine which pricing option suits my needs best?
The pricing options vary based on user requirements and access needs. Individual users may opt for single-user licenses, while businesses requiring broader access may choose multi-user or enterprise licenses for cost-effective access to the report.
13. Are there any additional resources or data provided in the Australia & New Zealand Medical Imaging Services Industry report?
While the report offers comprehensive insights, it's advisable to review the specific contents or supplementary materials provided to ascertain if additional resources or data are available.
14. How can I stay updated on further developments or reports in the Australia & New Zealand Medical Imaging Services Industry?
To stay informed about further developments, trends, and reports in the Australia & New Zealand Medical Imaging Services Industry, consider subscribing to industry newsletters, following relevant companies and organizations, or regularly checking reputable industry news sources and publications.
Methodology
Step 1 - Identification of Relevant Samples Size from Population Database


Step 2 - Approaches for Defining Global Market Size (Value, Volume* & Price*)

Note*: In applicable scenarios
Step 3 - Data Sources
Primary Research
- Web Analytics
- Survey Reports
- Research Institute
- Latest Research Reports
- Opinion Leaders
Secondary Research
- Annual Reports
- White Paper
- Latest Press Release
- Industry Association
- Paid Database
- Investor Presentations

Step 4 - Data Triangulation
Involves using different sources of information in order to increase the validity of a study
These sources are likely to be stakeholders in a program - participants, other researchers, program staff, other community members, and so on.
Then we put all data in single framework & apply various statistical tools to find out the dynamic on the market.
During the analysis stage, feedback from the stakeholder groups would be compared to determine areas of agreement as well as areas of divergence
