

Key Insights
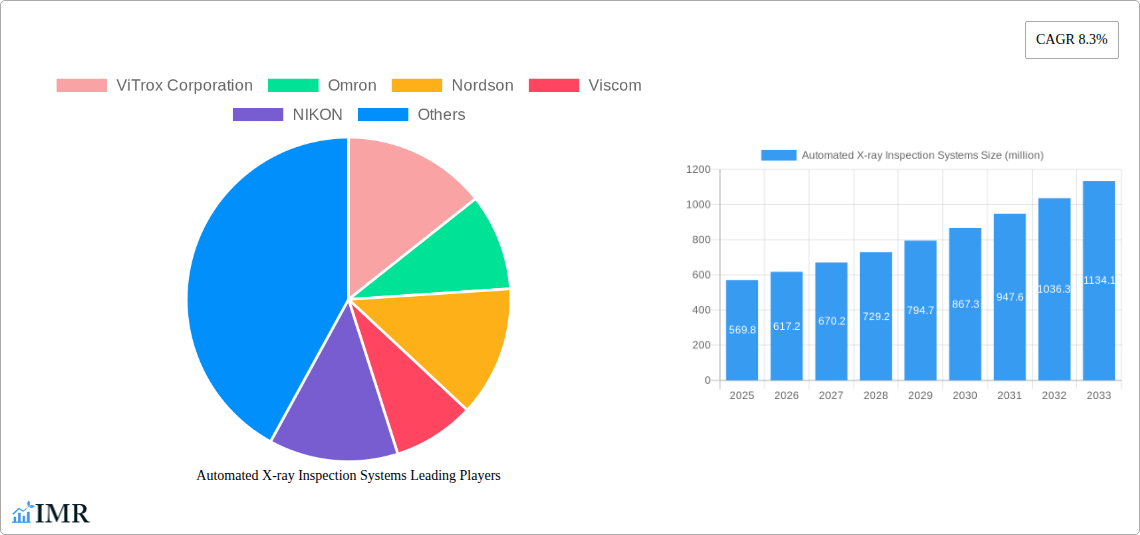
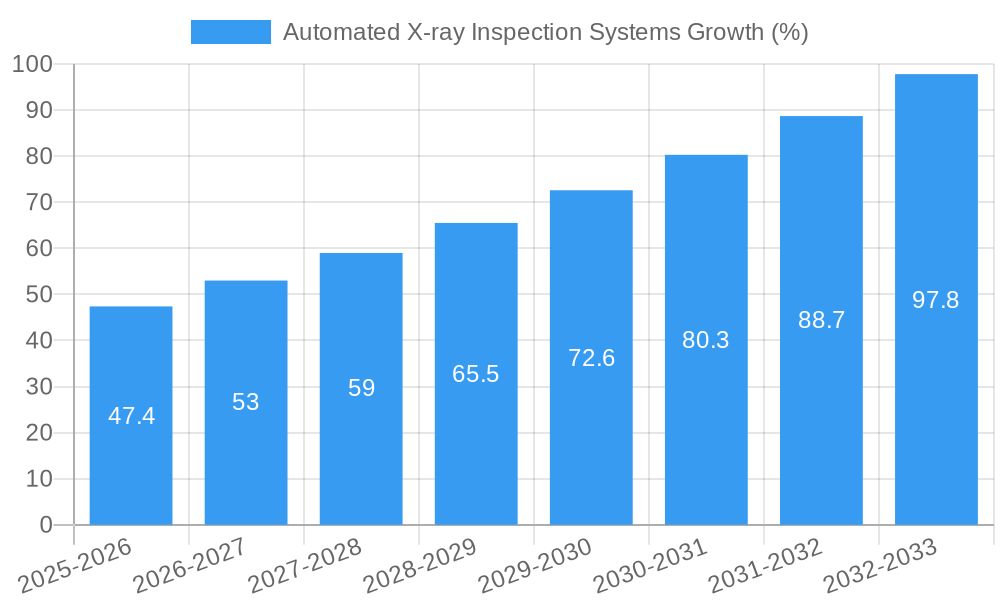
The Automated X-ray Inspection Systems (AXIS) market is experiencing robust growth, projected to reach $569.8 million in 2025 and maintain a compound annual growth rate (CAGR) of 8.3% from 2025 to 2033. This expansion is driven by several key factors. Increasing demand for higher quality control in diverse manufacturing sectors, particularly electronics, automotive, and pharmaceuticals, fuels the adoption of AXIS for defect detection and process optimization. The rising prevalence of miniaturization and complex component designs necessitates more sophisticated inspection techniques, making AXIS indispensable. Furthermore, advancements in X-ray technology, including improved image resolution and faster processing speeds, are enhancing the capabilities and efficiency of these systems. The market is also witnessing the integration of Artificial Intelligence (AI) and machine learning algorithms to automate analysis and improve accuracy, further bolstering market growth. Competitive pressures are driving innovation, with major players like ViTrox, Omron, and Nikon continuously developing advanced systems to cater to evolving industry requirements.
Despite the positive outlook, certain challenges exist. High initial investment costs associated with AXIS implementation can hinder adoption, particularly for smaller businesses. Moreover, the need for skilled personnel to operate and maintain these complex systems presents a potential barrier. However, the long-term benefits of improved quality control, reduced waste, and enhanced production efficiency are likely to outweigh these challenges. The market segmentation is likely diverse, with variations in system types (e.g., 2D vs. 3D), applications (e.g., PCB inspection, component analysis), and target industries. The competitive landscape is characterized by established players alongside emerging technology providers, signifying ongoing innovation and consolidation within the sector. The forecast period suggests a steady increase in market value, driven by sustained industry growth and technological advancements.
Automated X-ray Inspection Systems Market Report: 2019-2033
This comprehensive report provides an in-depth analysis of the Automated X-ray Inspection Systems market, encompassing market dynamics, growth trends, regional segmentation, product landscape, and competitive analysis. The report covers the period from 2019 to 2033, with a base year of 2025 and a forecast period of 2025-2033. The study examines the parent market of industrial automation and the child market of non-destructive testing (NDT) equipment. It’s an invaluable resource for industry professionals, investors, and stakeholders seeking to understand and capitalize on the growth opportunities within this dynamic sector. The market is estimated at xx million USD in 2025 and is projected to reach xx million USD by 2033.
Automated X-ray Inspection Systems Market Dynamics & Structure
The Automated X-ray Inspection Systems market is characterized by moderate concentration, with several key players holding significant market share. Technological innovation, driven by advancements in image processing, AI, and robotics, is a key growth driver. Regulatory frameworks related to product safety and quality control across various industries (e.g., automotive, electronics, pharmaceuticals) significantly impact market demand. Competitive substitutes include other NDT methods like ultrasound and CT scanning, but X-ray inspection holds advantages in certain applications. The end-user demographics are diverse, encompassing manufacturers across various industries. M&A activity in the sector has been moderate, with strategic acquisitions focused on expanding product portfolios and geographical reach.
- Market Concentration: Moderately concentrated, with the top 5 players holding approximately xx% market share in 2025.
- Technological Innovation: Advancements in AI-powered defect detection, high-resolution imaging, and faster processing speeds are driving growth.
- Regulatory Framework: Stringent quality and safety regulations in sectors like pharmaceuticals and aerospace are boosting demand.
- Competitive Substitutes: Ultrasound and CT scanning present some competition, but X-ray systems often offer superior resolution and speed for specific applications.
- End-User Demographics: Diverse, including automotive, electronics, aerospace, food & beverage, and pharmaceuticals.
- M&A Trends: Moderate M&A activity, primarily focused on strategic acquisitions for technological advancements and market expansion. Estimated xx deals between 2019-2024.
Automated X-ray Inspection Systems Growth Trends & Insights
The Automated X-ray Inspection Systems market experienced significant growth during the historical period (2019-2024), driven by increasing automation in manufacturing and rising demand for enhanced product quality. The market is projected to maintain a healthy CAGR of xx% during the forecast period (2025-2033), fueled by technological advancements and expansion into new applications. Adoption rates are particularly high in industries with stringent quality control requirements. Technological disruptions, such as the integration of AI and machine learning, are enhancing inspection accuracy and efficiency. Consumer behavior shifts towards higher-quality products and increased demand for traceability are further driving market growth. Market penetration is expected to increase significantly across various industries, particularly in emerging economies.
Dominant Regions, Countries, or Segments in Automated X-ray Inspection Systems
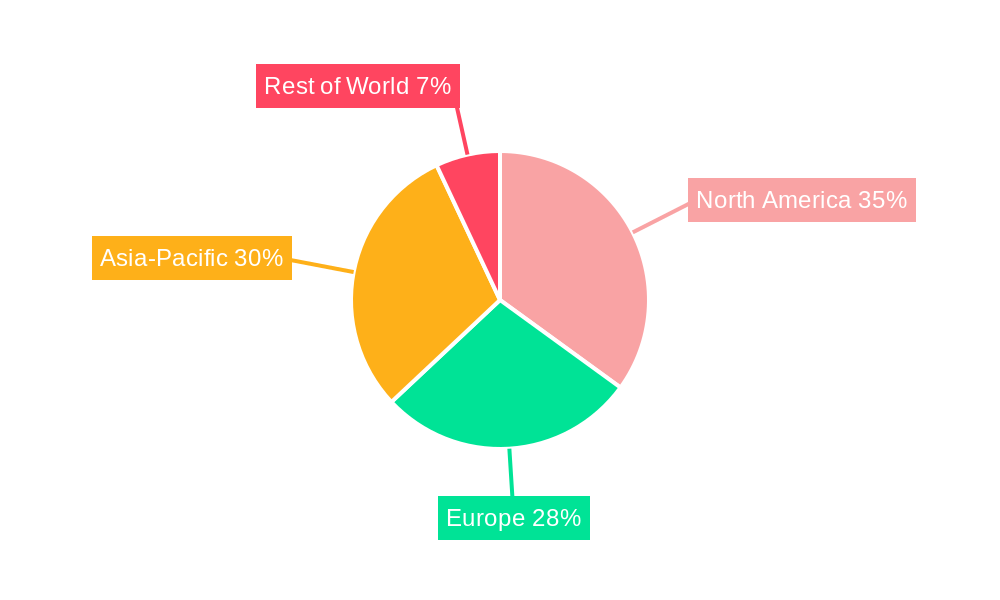
The North American market currently holds the largest share of the Automated X-ray Inspection Systems market, followed by Europe and Asia-Pacific. The dominance of North America is attributed to high adoption rates in industries such as automotive and electronics, coupled with stringent quality control regulations. Asia-Pacific is exhibiting rapid growth due to increasing industrialization and a surge in manufacturing activities. Key drivers for regional growth include:
- North America: Stringent regulatory frameworks, high adoption rates in key industries (automotive, electronics), and substantial R&D investments.
- Europe: Focus on quality and safety standards in various industries, robust industrial base, and government support for automation.
- Asia-Pacific: Rapid industrialization, rising manufacturing activities, cost-effective manufacturing locations, and growing consumer demand.
- Rest of the World: Emerging economies are demonstrating a growing demand for automated inspection systems due to increasing quality consciousness and governmental support.
Automated X-ray Inspection Systems Product Landscape
The Automated X-ray Inspection Systems market offers a diverse range of products, including systems for various applications, such as inline inspection, off-line inspection, and 3D X-ray imaging. Product innovations focus on improved image processing algorithms, higher resolution imaging capabilities, and more efficient defect detection techniques. Unique selling propositions include advanced software features, ease of use, and integration with existing manufacturing systems. Technological advancements such as AI-powered defect classification and automated reporting are enhancing system performance and operational efficiency.
Key Drivers, Barriers & Challenges in Automated X-ray Inspection Systems
Key Drivers:
- Increasing demand for improved product quality and reduced defect rates.
- Growing adoption of automation across various industries.
- Stringent regulatory compliance requirements.
- Advancements in X-ray technology and image processing capabilities.
Key Challenges:
- High initial investment costs for automated systems.
- Complexity of integration with existing manufacturing lines.
- Skill gap in operating and maintaining advanced systems.
- Supply chain disruptions impacting component availability. (estimated xx% impact on market growth in 2024)
Emerging Opportunities in Automated X-ray Inspection Systems
Emerging opportunities include expansion into new industries (e.g., healthcare, recycling), the development of specialized systems for specific applications (e.g., microelectronics inspection), and the integration of advanced analytics for predictive maintenance. Untapped markets in developing economies also present significant growth potential. The development of more compact and portable X-ray systems will also open up new applications.
Growth Accelerators in the Automated X-ray Inspection Systems Industry
Technological breakthroughs in AI-driven image analysis and 3D X-ray imaging are significantly enhancing inspection accuracy and speed, driving market expansion. Strategic partnerships between system providers and industrial automation companies facilitate seamless integration and broader market reach. Expansion into new geographical regions and application areas, along with aggressive marketing and sales strategies, will play a crucial role in accelerating market growth.
Key Players Shaping the Automated X-ray Inspection Systems Market
- ViTrox Corporation
- Omron
- Nordson
- Viscom
- NIKON
- Innometry
- Comet Yxlon
- Unicomp Technology
- Zhengye Technology
- Waygate Technologies (Baker Hughes)
- Test Research Inc. (TRI)
- DC Precision
- Saki Corporation
- ZEISS
- Techvalley
- SEC
- Seamark ZM
- Goepel Electronic
- Scienscope
Notable Milestones in Automated X-ray Inspection Systems Sector
- 2020: Introduction of AI-powered defect classification software by Viscom.
- 2021: Acquisition of a smaller competitor by Nordson, expanding its product portfolio.
- 2022: Launch of a new high-resolution 3D X-ray imaging system by ZEISS.
- 2023: Several companies announced partnerships to integrate robotics into their automated X-ray systems, improving efficiency and speed.
- 2024: Significant increase in adoption of cloud-based data management systems for managing and analyzing X-ray inspection data.
In-Depth Automated X-ray Inspection Systems Market Outlook
The Automated X-ray Inspection Systems market is poised for continued strong growth driven by technological innovations, increased automation in manufacturing, and rising demand for superior product quality across diverse industries. Strategic investments in R&D, expansion into new applications, and adoption of advanced technologies like AI and machine learning will shape the future market landscape. The market presents numerous opportunities for companies to establish leadership positions through product differentiation, strategic partnerships, and robust market penetration strategies. The continued focus on improving inspection speed, accuracy, and ease-of-use will lead to accelerated market adoption across all major regions.
Automated X-ray Inspection Systems Segmentation
-
1. Application
- 1.1. PCB Industry
- 1.2. Integrated Circuits
- 1.3. Battery Industry
- 1.4. LED & Casting
- 1.5. Others
-
2. Types
- 2.1. 2D AXI
- 2.2. 3D AXI
Automated X-ray Inspection Systems Segmentation By Geography
-
1. North America
- 1.1. United States
- 1.2. Canada
- 1.3. Mexico
-
2. South America
- 2.1. Brazil
- 2.2. Argentina
- 2.3. Rest of South America
-
3. Europe
- 3.1. United Kingdom
- 3.2. Germany
- 3.3. France
- 3.4. Italy
- 3.5. Spain
- 3.6. Russia
- 3.7. Benelux
- 3.8. Nordics
- 3.9. Rest of Europe
-
4. Middle East & Africa
- 4.1. Turkey
- 4.2. Israel
- 4.3. GCC
- 4.4. North Africa
- 4.5. South Africa
- 4.6. Rest of Middle East & Africa
-
5. Asia Pacific
- 5.1. China
- 5.2. India
- 5.3. Japan
- 5.4. South Korea
- 5.5. ASEAN
- 5.6. Oceania
- 5.7. Rest of Asia Pacific
Automated X-ray Inspection Systems REPORT HIGHLIGHTS
| Aspects | Details |
|---|---|
| Study Period | 2019-2033 |
| Base Year | 2024 |
| Estimated Year | 2025 |
| Forecast Period | 2025-2033 |
| Historical Period | 2019-2024 |
| Growth Rate | CAGR of 8.3% from 2019-2033 |
| Segmentation |
|
Table of Contents
- 1. Introduction
- 1.1. Research Scope
- 1.2. Market Segmentation
- 1.3. Research Methodology
- 1.4. Definitions and Assumptions
- 2. Executive Summary
- 2.1. Introduction
- 3. Market Dynamics
- 3.1. Introduction
- 3.2. Market Drivers
- 3.3. Market Restrains
- 3.4. Market Trends
- 4. Market Factor Analysis
- 4.1. Porters Five Forces
- 4.2. Supply/Value Chain
- 4.3. PESTEL analysis
- 4.4. Market Entropy
- 4.5. Patent/Trademark Analysis
- 5. Global Automated X-ray Inspection Systems Analysis, Insights and Forecast, 2019-2031
- 5.1. Market Analysis, Insights and Forecast - by Application
- 5.1.1. PCB Industry
- 5.1.2. Integrated Circuits
- 5.1.3. Battery Industry
- 5.1.4. LED & Casting
- 5.1.5. Others
- 5.2. Market Analysis, Insights and Forecast - by Types
- 5.2.1. 2D AXI
- 5.2.2. 3D AXI
- 5.3. Market Analysis, Insights and Forecast - by Region
- 5.3.1. North America
- 5.3.2. South America
- 5.3.3. Europe
- 5.3.4. Middle East & Africa
- 5.3.5. Asia Pacific
- 5.1. Market Analysis, Insights and Forecast - by Application
- 6. North America Automated X-ray Inspection Systems Analysis, Insights and Forecast, 2019-2031
- 6.1. Market Analysis, Insights and Forecast - by Application
- 6.1.1. PCB Industry
- 6.1.2. Integrated Circuits
- 6.1.3. Battery Industry
- 6.1.4. LED & Casting
- 6.1.5. Others
- 6.2. Market Analysis, Insights and Forecast - by Types
- 6.2.1. 2D AXI
- 6.2.2. 3D AXI
- 6.1. Market Analysis, Insights and Forecast - by Application
- 7. South America Automated X-ray Inspection Systems Analysis, Insights and Forecast, 2019-2031
- 7.1. Market Analysis, Insights and Forecast - by Application
- 7.1.1. PCB Industry
- 7.1.2. Integrated Circuits
- 7.1.3. Battery Industry
- 7.1.4. LED & Casting
- 7.1.5. Others
- 7.2. Market Analysis, Insights and Forecast - by Types
- 7.2.1. 2D AXI
- 7.2.2. 3D AXI
- 7.1. Market Analysis, Insights and Forecast - by Application
- 8. Europe Automated X-ray Inspection Systems Analysis, Insights and Forecast, 2019-2031
- 8.1. Market Analysis, Insights and Forecast - by Application
- 8.1.1. PCB Industry
- 8.1.2. Integrated Circuits
- 8.1.3. Battery Industry
- 8.1.4. LED & Casting
- 8.1.5. Others
- 8.2. Market Analysis, Insights and Forecast - by Types
- 8.2.1. 2D AXI
- 8.2.2. 3D AXI
- 8.1. Market Analysis, Insights and Forecast - by Application
- 9. Middle East & Africa Automated X-ray Inspection Systems Analysis, Insights and Forecast, 2019-2031
- 9.1. Market Analysis, Insights and Forecast - by Application
- 9.1.1. PCB Industry
- 9.1.2. Integrated Circuits
- 9.1.3. Battery Industry
- 9.1.4. LED & Casting
- 9.1.5. Others
- 9.2. Market Analysis, Insights and Forecast - by Types
- 9.2.1. 2D AXI
- 9.2.2. 3D AXI
- 9.1. Market Analysis, Insights and Forecast - by Application
- 10. Asia Pacific Automated X-ray Inspection Systems Analysis, Insights and Forecast, 2019-2031
- 10.1. Market Analysis, Insights and Forecast - by Application
- 10.1.1. PCB Industry
- 10.1.2. Integrated Circuits
- 10.1.3. Battery Industry
- 10.1.4. LED & Casting
- 10.1.5. Others
- 10.2. Market Analysis, Insights and Forecast - by Types
- 10.2.1. 2D AXI
- 10.2.2. 3D AXI
- 10.1. Market Analysis, Insights and Forecast - by Application
- 11. Competitive Analysis
- 11.1. Global Market Share Analysis 2024
- 11.2. Company Profiles
- 11.2.1 ViTrox Corporation
- 11.2.1.1. Overview
- 11.2.1.2. Products
- 11.2.1.3. SWOT Analysis
- 11.2.1.4. Recent Developments
- 11.2.1.5. Financials (Based on Availability)
- 11.2.2 Omron
- 11.2.2.1. Overview
- 11.2.2.2. Products
- 11.2.2.3. SWOT Analysis
- 11.2.2.4. Recent Developments
- 11.2.2.5. Financials (Based on Availability)
- 11.2.3 Nordson
- 11.2.3.1. Overview
- 11.2.3.2. Products
- 11.2.3.3. SWOT Analysis
- 11.2.3.4. Recent Developments
- 11.2.3.5. Financials (Based on Availability)
- 11.2.4 Viscom
- 11.2.4.1. Overview
- 11.2.4.2. Products
- 11.2.4.3. SWOT Analysis
- 11.2.4.4. Recent Developments
- 11.2.4.5. Financials (Based on Availability)
- 11.2.5 NIKON
- 11.2.5.1. Overview
- 11.2.5.2. Products
- 11.2.5.3. SWOT Analysis
- 11.2.5.4. Recent Developments
- 11.2.5.5. Financials (Based on Availability)
- 11.2.6 Innometry
- 11.2.6.1. Overview
- 11.2.6.2. Products
- 11.2.6.3. SWOT Analysis
- 11.2.6.4. Recent Developments
- 11.2.6.5. Financials (Based on Availability)
- 11.2.7 Comet Yxlon
- 11.2.7.1. Overview
- 11.2.7.2. Products
- 11.2.7.3. SWOT Analysis
- 11.2.7.4. Recent Developments
- 11.2.7.5. Financials (Based on Availability)
- 11.2.8 Unicomp Technology
- 11.2.8.1. Overview
- 11.2.8.2. Products
- 11.2.8.3. SWOT Analysis
- 11.2.8.4. Recent Developments
- 11.2.8.5. Financials (Based on Availability)
- 11.2.9 Zhengye Technology
- 11.2.9.1. Overview
- 11.2.9.2. Products
- 11.2.9.3. SWOT Analysis
- 11.2.9.4. Recent Developments
- 11.2.9.5. Financials (Based on Availability)
- 11.2.10 Waygate Technologies (Baker Hughes)
- 11.2.10.1. Overview
- 11.2.10.2. Products
- 11.2.10.3. SWOT Analysis
- 11.2.10.4. Recent Developments
- 11.2.10.5. Financials (Based on Availability)
- 11.2.11 Test Research Inc. (TRI)
- 11.2.11.1. Overview
- 11.2.11.2. Products
- 11.2.11.3. SWOT Analysis
- 11.2.11.4. Recent Developments
- 11.2.11.5. Financials (Based on Availability)
- 11.2.12 DC Precision
- 11.2.12.1. Overview
- 11.2.12.2. Products
- 11.2.12.3. SWOT Analysis
- 11.2.12.4. Recent Developments
- 11.2.12.5. Financials (Based on Availability)
- 11.2.13 Saki Corporation
- 11.2.13.1. Overview
- 11.2.13.2. Products
- 11.2.13.3. SWOT Analysis
- 11.2.13.4. Recent Developments
- 11.2.13.5. Financials (Based on Availability)
- 11.2.14 ZEISS
- 11.2.14.1. Overview
- 11.2.14.2. Products
- 11.2.14.3. SWOT Analysis
- 11.2.14.4. Recent Developments
- 11.2.14.5. Financials (Based on Availability)
- 11.2.15 Techvalley
- 11.2.15.1. Overview
- 11.2.15.2. Products
- 11.2.15.3. SWOT Analysis
- 11.2.15.4. Recent Developments
- 11.2.15.5. Financials (Based on Availability)
- 11.2.16 SEC
- 11.2.16.1. Overview
- 11.2.16.2. Products
- 11.2.16.3. SWOT Analysis
- 11.2.16.4. Recent Developments
- 11.2.16.5. Financials (Based on Availability)
- 11.2.17 Seamark ZM
- 11.2.17.1. Overview
- 11.2.17.2. Products
- 11.2.17.3. SWOT Analysis
- 11.2.17.4. Recent Developments
- 11.2.17.5. Financials (Based on Availability)
- 11.2.18 Goepel Electronic
- 11.2.18.1. Overview
- 11.2.18.2. Products
- 11.2.18.3. SWOT Analysis
- 11.2.18.4. Recent Developments
- 11.2.18.5. Financials (Based on Availability)
- 11.2.19 Scienscope
- 11.2.19.1. Overview
- 11.2.19.2. Products
- 11.2.19.3. SWOT Analysis
- 11.2.19.4. Recent Developments
- 11.2.19.5. Financials (Based on Availability)
- 11.2.1 ViTrox Corporation
List of Figures
- Figure 1: Global Automated X-ray Inspection Systems Revenue Breakdown (million, %) by Region 2024 & 2032
- Figure 2: North America Automated X-ray Inspection Systems Revenue (million), by Application 2024 & 2032
- Figure 3: North America Automated X-ray Inspection Systems Revenue Share (%), by Application 2024 & 2032
- Figure 4: North America Automated X-ray Inspection Systems Revenue (million), by Types 2024 & 2032
- Figure 5: North America Automated X-ray Inspection Systems Revenue Share (%), by Types 2024 & 2032
- Figure 6: North America Automated X-ray Inspection Systems Revenue (million), by Country 2024 & 2032
- Figure 7: North America Automated X-ray Inspection Systems Revenue Share (%), by Country 2024 & 2032
- Figure 8: South America Automated X-ray Inspection Systems Revenue (million), by Application 2024 & 2032
- Figure 9: South America Automated X-ray Inspection Systems Revenue Share (%), by Application 2024 & 2032
- Figure 10: South America Automated X-ray Inspection Systems Revenue (million), by Types 2024 & 2032
- Figure 11: South America Automated X-ray Inspection Systems Revenue Share (%), by Types 2024 & 2032
- Figure 12: South America Automated X-ray Inspection Systems Revenue (million), by Country 2024 & 2032
- Figure 13: South America Automated X-ray Inspection Systems Revenue Share (%), by Country 2024 & 2032
- Figure 14: Europe Automated X-ray Inspection Systems Revenue (million), by Application 2024 & 2032
- Figure 15: Europe Automated X-ray Inspection Systems Revenue Share (%), by Application 2024 & 2032
- Figure 16: Europe Automated X-ray Inspection Systems Revenue (million), by Types 2024 & 2032
- Figure 17: Europe Automated X-ray Inspection Systems Revenue Share (%), by Types 2024 & 2032
- Figure 18: Europe Automated X-ray Inspection Systems Revenue (million), by Country 2024 & 2032
- Figure 19: Europe Automated X-ray Inspection Systems Revenue Share (%), by Country 2024 & 2032
- Figure 20: Middle East & Africa Automated X-ray Inspection Systems Revenue (million), by Application 2024 & 2032
- Figure 21: Middle East & Africa Automated X-ray Inspection Systems Revenue Share (%), by Application 2024 & 2032
- Figure 22: Middle East & Africa Automated X-ray Inspection Systems Revenue (million), by Types 2024 & 2032
- Figure 23: Middle East & Africa Automated X-ray Inspection Systems Revenue Share (%), by Types 2024 & 2032
- Figure 24: Middle East & Africa Automated X-ray Inspection Systems Revenue (million), by Country 2024 & 2032
- Figure 25: Middle East & Africa Automated X-ray Inspection Systems Revenue Share (%), by Country 2024 & 2032
- Figure 26: Asia Pacific Automated X-ray Inspection Systems Revenue (million), by Application 2024 & 2032
- Figure 27: Asia Pacific Automated X-ray Inspection Systems Revenue Share (%), by Application 2024 & 2032
- Figure 28: Asia Pacific Automated X-ray Inspection Systems Revenue (million), by Types 2024 & 2032
- Figure 29: Asia Pacific Automated X-ray Inspection Systems Revenue Share (%), by Types 2024 & 2032
- Figure 30: Asia Pacific Automated X-ray Inspection Systems Revenue (million), by Country 2024 & 2032
- Figure 31: Asia Pacific Automated X-ray Inspection Systems Revenue Share (%), by Country 2024 & 2032
List of Tables
- Table 1: Global Automated X-ray Inspection Systems Revenue million Forecast, by Region 2019 & 2032
- Table 2: Global Automated X-ray Inspection Systems Revenue million Forecast, by Application 2019 & 2032
- Table 3: Global Automated X-ray Inspection Systems Revenue million Forecast, by Types 2019 & 2032
- Table 4: Global Automated X-ray Inspection Systems Revenue million Forecast, by Region 2019 & 2032
- Table 5: Global Automated X-ray Inspection Systems Revenue million Forecast, by Application 2019 & 2032
- Table 6: Global Automated X-ray Inspection Systems Revenue million Forecast, by Types 2019 & 2032
- Table 7: Global Automated X-ray Inspection Systems Revenue million Forecast, by Country 2019 & 2032
- Table 8: United States Automated X-ray Inspection Systems Revenue (million) Forecast, by Application 2019 & 2032
- Table 9: Canada Automated X-ray Inspection Systems Revenue (million) Forecast, by Application 2019 & 2032
- Table 10: Mexico Automated X-ray Inspection Systems Revenue (million) Forecast, by Application 2019 & 2032
- Table 11: Global Automated X-ray Inspection Systems Revenue million Forecast, by Application 2019 & 2032
- Table 12: Global Automated X-ray Inspection Systems Revenue million Forecast, by Types 2019 & 2032
- Table 13: Global Automated X-ray Inspection Systems Revenue million Forecast, by Country 2019 & 2032
- Table 14: Brazil Automated X-ray Inspection Systems Revenue (million) Forecast, by Application 2019 & 2032
- Table 15: Argentina Automated X-ray Inspection Systems Revenue (million) Forecast, by Application 2019 & 2032
- Table 16: Rest of South America Automated X-ray Inspection Systems Revenue (million) Forecast, by Application 2019 & 2032
- Table 17: Global Automated X-ray Inspection Systems Revenue million Forecast, by Application 2019 & 2032
- Table 18: Global Automated X-ray Inspection Systems Revenue million Forecast, by Types 2019 & 2032
- Table 19: Global Automated X-ray Inspection Systems Revenue million Forecast, by Country 2019 & 2032
- Table 20: United Kingdom Automated X-ray Inspection Systems Revenue (million) Forecast, by Application 2019 & 2032
- Table 21: Germany Automated X-ray Inspection Systems Revenue (million) Forecast, by Application 2019 & 2032
- Table 22: France Automated X-ray Inspection Systems Revenue (million) Forecast, by Application 2019 & 2032
- Table 23: Italy Automated X-ray Inspection Systems Revenue (million) Forecast, by Application 2019 & 2032
- Table 24: Spain Automated X-ray Inspection Systems Revenue (million) Forecast, by Application 2019 & 2032
- Table 25: Russia Automated X-ray Inspection Systems Revenue (million) Forecast, by Application 2019 & 2032
- Table 26: Benelux Automated X-ray Inspection Systems Revenue (million) Forecast, by Application 2019 & 2032
- Table 27: Nordics Automated X-ray Inspection Systems Revenue (million) Forecast, by Application 2019 & 2032
- Table 28: Rest of Europe Automated X-ray Inspection Systems Revenue (million) Forecast, by Application 2019 & 2032
- Table 29: Global Automated X-ray Inspection Systems Revenue million Forecast, by Application 2019 & 2032
- Table 30: Global Automated X-ray Inspection Systems Revenue million Forecast, by Types 2019 & 2032
- Table 31: Global Automated X-ray Inspection Systems Revenue million Forecast, by Country 2019 & 2032
- Table 32: Turkey Automated X-ray Inspection Systems Revenue (million) Forecast, by Application 2019 & 2032
- Table 33: Israel Automated X-ray Inspection Systems Revenue (million) Forecast, by Application 2019 & 2032
- Table 34: GCC Automated X-ray Inspection Systems Revenue (million) Forecast, by Application 2019 & 2032
- Table 35: North Africa Automated X-ray Inspection Systems Revenue (million) Forecast, by Application 2019 & 2032
- Table 36: South Africa Automated X-ray Inspection Systems Revenue (million) Forecast, by Application 2019 & 2032
- Table 37: Rest of Middle East & Africa Automated X-ray Inspection Systems Revenue (million) Forecast, by Application 2019 & 2032
- Table 38: Global Automated X-ray Inspection Systems Revenue million Forecast, by Application 2019 & 2032
- Table 39: Global Automated X-ray Inspection Systems Revenue million Forecast, by Types 2019 & 2032
- Table 40: Global Automated X-ray Inspection Systems Revenue million Forecast, by Country 2019 & 2032
- Table 41: China Automated X-ray Inspection Systems Revenue (million) Forecast, by Application 2019 & 2032
- Table 42: India Automated X-ray Inspection Systems Revenue (million) Forecast, by Application 2019 & 2032
- Table 43: Japan Automated X-ray Inspection Systems Revenue (million) Forecast, by Application 2019 & 2032
- Table 44: South Korea Automated X-ray Inspection Systems Revenue (million) Forecast, by Application 2019 & 2032
- Table 45: ASEAN Automated X-ray Inspection Systems Revenue (million) Forecast, by Application 2019 & 2032
- Table 46: Oceania Automated X-ray Inspection Systems Revenue (million) Forecast, by Application 2019 & 2032
- Table 47: Rest of Asia Pacific Automated X-ray Inspection Systems Revenue (million) Forecast, by Application 2019 & 2032
Frequently Asked Questions
1. What is the projected Compound Annual Growth Rate (CAGR) of the Automated X-ray Inspection Systems?
The projected CAGR is approximately 8.3%.
2. Which companies are prominent players in the Automated X-ray Inspection Systems?
Key companies in the market include ViTrox Corporation, Omron, Nordson, Viscom, NIKON, Innometry, Comet Yxlon, Unicomp Technology, Zhengye Technology, Waygate Technologies (Baker Hughes), Test Research Inc. (TRI), DC Precision, Saki Corporation, ZEISS, Techvalley, SEC, Seamark ZM, Goepel Electronic, Scienscope.
3. What are the main segments of the Automated X-ray Inspection Systems?
The market segments include Application, Types.
4. Can you provide details about the market size?
The market size is estimated to be USD 569.8 million as of 2022.
5. What are some drivers contributing to market growth?
N/A
6. What are the notable trends driving market growth?
N/A
7. Are there any restraints impacting market growth?
N/A
8. Can you provide examples of recent developments in the market?
N/A
9. What pricing options are available for accessing the report?
Pricing options include single-user, multi-user, and enterprise licenses priced at USD 2900.00, USD 4350.00, and USD 5800.00 respectively.
10. Is the market size provided in terms of value or volume?
The market size is provided in terms of value, measured in million.
11. Are there any specific market keywords associated with the report?
Yes, the market keyword associated with the report is "Automated X-ray Inspection Systems," which aids in identifying and referencing the specific market segment covered.
12. How do I determine which pricing option suits my needs best?
The pricing options vary based on user requirements and access needs. Individual users may opt for single-user licenses, while businesses requiring broader access may choose multi-user or enterprise licenses for cost-effective access to the report.
13. Are there any additional resources or data provided in the Automated X-ray Inspection Systems report?
While the report offers comprehensive insights, it's advisable to review the specific contents or supplementary materials provided to ascertain if additional resources or data are available.
14. How can I stay updated on further developments or reports in the Automated X-ray Inspection Systems?
To stay informed about further developments, trends, and reports in the Automated X-ray Inspection Systems, consider subscribing to industry newsletters, following relevant companies and organizations, or regularly checking reputable industry news sources and publications.
Methodology
Step 1 - Identification of Relevant Samples Size from Population Database


Step 2 - Approaches for Defining Global Market Size (Value, Volume* & Price*)

Note*: In applicable scenarios
Step 3 - Data Sources
Primary Research
- Web Analytics
- Survey Reports
- Research Institute
- Latest Research Reports
- Opinion Leaders
Secondary Research
- Annual Reports
- White Paper
- Latest Press Release
- Industry Association
- Paid Database
- Investor Presentations

Step 4 - Data Triangulation
Involves using different sources of information in order to increase the validity of a study
These sources are likely to be stakeholders in a program - participants, other researchers, program staff, other community members, and so on.
Then we put all data in single framework & apply various statistical tools to find out the dynamic on the market.
During the analysis stage, feedback from the stakeholder groups would be compared to determine areas of agreement as well as areas of divergence
