

Key Insights
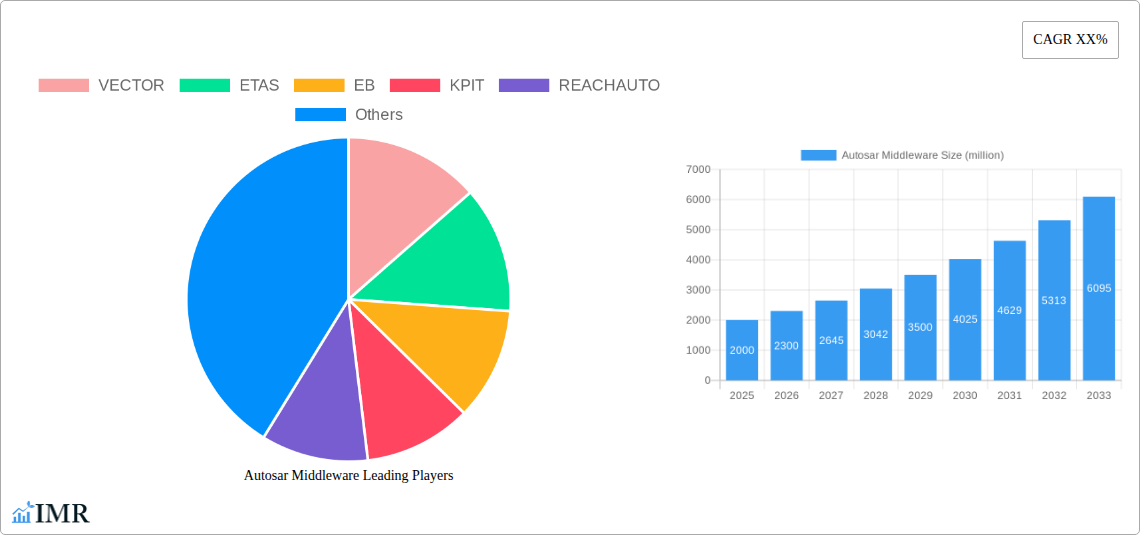
The AUTOSAR (AUTomotive Open System ARchitecture) middleware market is experiencing robust growth, driven by the increasing demand for advanced driver-assistance systems (ADAS) and autonomous driving features. The automotive industry's shift towards software-defined vehicles (SDVs) is a significant catalyst, requiring sophisticated middleware solutions to manage complex communication and data exchange between various electronic control units (ECUs). This necessitates efficient, reliable, and secure middleware capable of handling the high volume of data generated by sensors, actuators, and other vehicle components. The market is further fueled by stringent regulatory requirements for vehicle safety and cybersecurity, emphasizing the need for robust and standardized middleware platforms. We estimate the market size to be approximately $2 billion in 2025, with a Compound Annual Growth Rate (CAGR) of 15% projected through 2033. This growth is expected across various segments, including passenger cars and commercial vehicles, as well as geographical regions. The increasing adoption of electric vehicles (EVs) and hybrid electric vehicles (HEVs) also contributes significantly, as these vehicles rely heavily on sophisticated software and electronic systems.
Competition in the AUTOSAR middleware market is intense, with established players like Vector, ETAS, and EB competing alongside emerging technology providers like KPIT and Reachauto, and several Chinese companies showing strong growth. The market is characterized by a strong emphasis on innovation, with continuous advancements in areas such as over-the-air (OTA) updates, functional safety, and security features. While the high initial investment and complexity of AUTOSAR implementation can present challenges, the long-term benefits of enhanced vehicle functionality, improved safety, and reduced development costs are driving adoption across the automotive industry. This competitive landscape will likely lead to further consolidation and strategic partnerships in the coming years, as companies strive to expand their market share and technological capabilities.
Autosar Middleware Market Report: 2019-2033
This comprehensive report provides an in-depth analysis of the Autosar Middleware market, projecting robust growth from 2025 to 2033. The study covers market dynamics, growth trends, regional dominance, product landscape, key players, and future outlook. Targeting automotive manufacturers, Tier-1 suppliers, and technology providers, this report is essential for strategic decision-making in the rapidly evolving automotive software landscape. The parent market is the Automotive Software market (estimated at xx million units in 2025), with Autosar Middleware representing a significant child market.
Autosar Middleware Market Dynamics & Structure
This section analyzes the competitive landscape, technological advancements, and regulatory influences shaping the Autosar Middleware market. The market is moderately fragmented, with key players vying for market share through innovation and strategic partnerships. The study period (2019-2033), with a base year of 2025 and forecast period of 2025-2033, allows for a comprehensive understanding of historical trends and future projections.
- Market Concentration: The market exhibits moderate concentration, with the top 5 players holding an estimated xx% market share in 2025.
- Technological Innovation: The continuous development of AUTOSAR standards, coupled with the rise of functional safety and security requirements, is a major driver of innovation.
- Regulatory Frameworks: Stringent automotive safety and cybersecurity regulations are influencing product development and adoption.
- Competitive Substitutes: Alternative middleware solutions exist, but AUTOSAR's widespread adoption creates a strong barrier to entry for substitutes.
- End-User Demographics: The primary end users are automotive OEMs and Tier-1 suppliers, with a growing focus on electric and autonomous vehicles.
- M&A Trends: The market has witnessed xx M&A deals in the historical period (2019-2024), indicating strategic consolidation among players.
Autosar Middleware Growth Trends & Insights
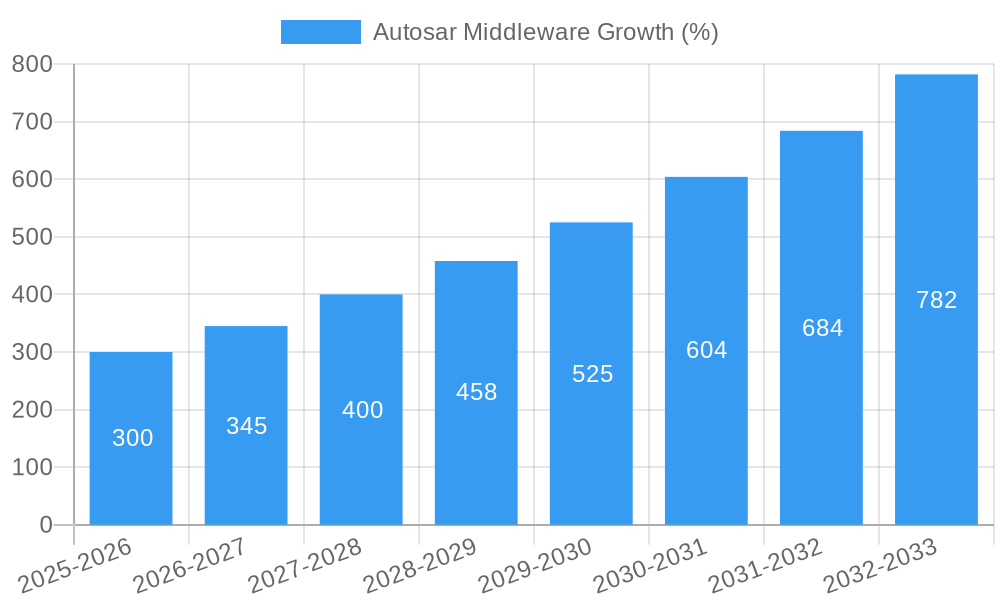
This section delves into the growth trajectory of the Autosar Middleware market, analyzing market size evolution, adoption rates, and technological disruptions. Using proprietary data and industry analysis, the report projects a Compound Annual Growth Rate (CAGR) of xx% during the forecast period (2025-2033), driven by increasing demand for advanced driver-assistance systems (ADAS) and autonomous driving capabilities. Market penetration is expected to reach xx% by 2033. The report explores shifts in consumer preferences towards connected and intelligent vehicles as a major growth catalyst.
Dominant Regions, Countries, or Segments in Autosar Middleware
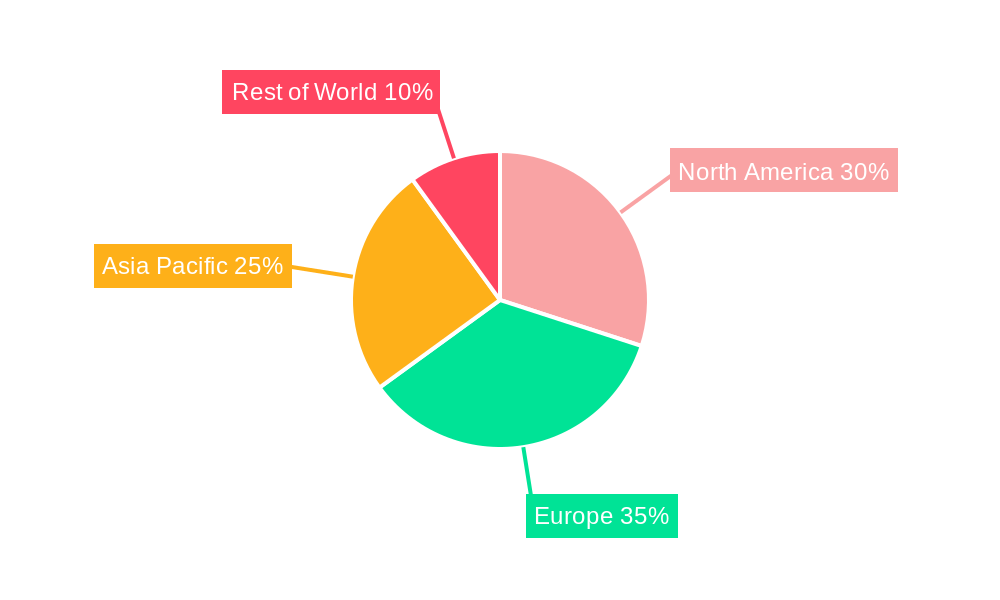
This section identifies the key geographical markets and segments driving Autosar Middleware adoption. While exact figures are proprietary to the full report, the report indicates that Europe and North America currently represent significant regional markets, driven by robust automotive industries and early adoption of advanced technologies. Asia Pacific is also experiencing significant growth, due to increasing vehicle production and government support for electric vehicle development.
- Key Drivers: Favorable government policies promoting vehicle electrification and automation, robust automotive manufacturing sectors, and well-developed infrastructure.
- Dominance Factors: Early adoption of AUTOSAR standards, strong presence of key players, and high demand for advanced automotive features. The specific market share breakdown by region/segment is detailed within the full report.
Autosar Middleware Product Landscape
The Autosar Middleware market features a range of solutions catering to diverse automotive needs. Products are categorized by features such as communication protocols (CAN, LIN, Ethernet), functional safety levels (ASIL), and real-time capabilities. Key innovations include the integration of artificial intelligence (AI) and machine learning (ML) algorithms for enhanced vehicle performance and safety. The unique selling propositions of various products include optimized performance, enhanced security, and reduced development time.
Key Drivers, Barriers & Challenges in Autosar Middleware
Key Drivers: The increasing complexity of automotive ECUs, growing demand for connected and autonomous vehicles, and stringent safety and security regulations are driving adoption. The push for software-defined vehicles is another significant driver.
Challenges: High development costs associated with AUTOSAR implementation, integration complexities with existing legacy systems, and ensuring compatibility across different AUTOSAR versions pose significant challenges. Supply chain disruptions also have a quantifiable impact, potentially delaying projects and increasing costs by an estimated xx million units annually.
Emerging Opportunities in Autosar Middleware
Emerging opportunities include the integration of Autosar Middleware in next-generation vehicle architectures, such as zonal architectures, and its application in areas beyond traditional automotive, such as industrial automation. Untapped markets in developing economies and the growing adoption of over-the-air (OTA) updates present further growth potential.
Growth Accelerators in the Autosar Middleware Industry
Technological advancements, particularly in areas like artificial intelligence and functional safety, are fueling market growth. Strategic partnerships between automotive OEMs, Tier-1 suppliers, and middleware providers are also accelerating adoption. Expansion into new markets, such as commercial vehicles and off-highway vehicles, contributes to long-term growth.
Key Players Shaping the Autosar Middleware Market
- VECTOR
- ETAS
- EB
- KPIT
- REACHAUTO
- ISoft Infrastructure Software
- Jingwei Hirain Technologies
- Huawei
- Zebra Network Technology
- Novauto
- Yingchi Technology
- Untouch
- LinearX Technology
- HingeTech
- Guoqi Intelligent Control (Beijing) Technology
Notable Milestones in Autosar Middleware Sector
- 2020: Release of AUTOSAR Adaptive Platform 19-10, enabling seamless integration with cloud-based services.
- 2021: Several key partnerships announced between middleware providers and automotive OEMs to accelerate adoption in electric and autonomous vehicles.
- 2022: Introduction of new security features in Autosar Middleware to address growing cybersecurity concerns. (Further milestones detailed in full report).
In-Depth Autosar Middleware Market Outlook
The Autosar Middleware market is poised for continued expansion, driven by the convergence of several technological and market trends. Future growth will be fueled by the increasing adoption of software-defined vehicles, the expansion into new applications and markets, and ongoing advancements in functional safety and security. Strategic partnerships and investments in R&D will further accelerate market growth, leading to a significant increase in market size in the coming years.
Autosar Middleware Segmentation
-
1. Application
- 1.1. Passenger Vehicle
- 1.2. Commercial Vehicle
-
2. Types
- 2.1. Autorsar CP
- 2.2. Autorsar AP
Autosar Middleware Segmentation By Geography
-
1. North America
- 1.1. United States
- 1.2. Canada
- 1.3. Mexico
-
2. South America
- 2.1. Brazil
- 2.2. Argentina
- 2.3. Rest of South America
-
3. Europe
- 3.1. United Kingdom
- 3.2. Germany
- 3.3. France
- 3.4. Italy
- 3.5. Spain
- 3.6. Russia
- 3.7. Benelux
- 3.8. Nordics
- 3.9. Rest of Europe
-
4. Middle East & Africa
- 4.1. Turkey
- 4.2. Israel
- 4.3. GCC
- 4.4. North Africa
- 4.5. South Africa
- 4.6. Rest of Middle East & Africa
-
5. Asia Pacific
- 5.1. China
- 5.2. India
- 5.3. Japan
- 5.4. South Korea
- 5.5. ASEAN
- 5.6. Oceania
- 5.7. Rest of Asia Pacific
Autosar Middleware REPORT HIGHLIGHTS
| Aspects | Details |
|---|---|
| Study Period | 2019-2033 |
| Base Year | 2024 |
| Estimated Year | 2025 |
| Forecast Period | 2025-2033 |
| Historical Period | 2019-2024 |
| Growth Rate | CAGR of XX% from 2019-2033 |
| Segmentation |
|
Table of Contents
- 1. Introduction
- 1.1. Research Scope
- 1.2. Market Segmentation
- 1.3. Research Methodology
- 1.4. Definitions and Assumptions
- 2. Executive Summary
- 2.1. Introduction
- 3. Market Dynamics
- 3.1. Introduction
- 3.2. Market Drivers
- 3.3. Market Restrains
- 3.4. Market Trends
- 4. Market Factor Analysis
- 4.1. Porters Five Forces
- 4.2. Supply/Value Chain
- 4.3. PESTEL analysis
- 4.4. Market Entropy
- 4.5. Patent/Trademark Analysis
- 5. Global Autosar Middleware Analysis, Insights and Forecast, 2019-2031
- 5.1. Market Analysis, Insights and Forecast - by Application
- 5.1.1. Passenger Vehicle
- 5.1.2. Commercial Vehicle
- 5.2. Market Analysis, Insights and Forecast - by Types
- 5.2.1. Autorsar CP
- 5.2.2. Autorsar AP
- 5.3. Market Analysis, Insights and Forecast - by Region
- 5.3.1. North America
- 5.3.2. South America
- 5.3.3. Europe
- 5.3.4. Middle East & Africa
- 5.3.5. Asia Pacific
- 5.1. Market Analysis, Insights and Forecast - by Application
- 6. North America Autosar Middleware Analysis, Insights and Forecast, 2019-2031
- 6.1. Market Analysis, Insights and Forecast - by Application
- 6.1.1. Passenger Vehicle
- 6.1.2. Commercial Vehicle
- 6.2. Market Analysis, Insights and Forecast - by Types
- 6.2.1. Autorsar CP
- 6.2.2. Autorsar AP
- 6.1. Market Analysis, Insights and Forecast - by Application
- 7. South America Autosar Middleware Analysis, Insights and Forecast, 2019-2031
- 7.1. Market Analysis, Insights and Forecast - by Application
- 7.1.1. Passenger Vehicle
- 7.1.2. Commercial Vehicle
- 7.2. Market Analysis, Insights and Forecast - by Types
- 7.2.1. Autorsar CP
- 7.2.2. Autorsar AP
- 7.1. Market Analysis, Insights and Forecast - by Application
- 8. Europe Autosar Middleware Analysis, Insights and Forecast, 2019-2031
- 8.1. Market Analysis, Insights and Forecast - by Application
- 8.1.1. Passenger Vehicle
- 8.1.2. Commercial Vehicle
- 8.2. Market Analysis, Insights and Forecast - by Types
- 8.2.1. Autorsar CP
- 8.2.2. Autorsar AP
- 8.1. Market Analysis, Insights and Forecast - by Application
- 9. Middle East & Africa Autosar Middleware Analysis, Insights and Forecast, 2019-2031
- 9.1. Market Analysis, Insights and Forecast - by Application
- 9.1.1. Passenger Vehicle
- 9.1.2. Commercial Vehicle
- 9.2. Market Analysis, Insights and Forecast - by Types
- 9.2.1. Autorsar CP
- 9.2.2. Autorsar AP
- 9.1. Market Analysis, Insights and Forecast - by Application
- 10. Asia Pacific Autosar Middleware Analysis, Insights and Forecast, 2019-2031
- 10.1. Market Analysis, Insights and Forecast - by Application
- 10.1.1. Passenger Vehicle
- 10.1.2. Commercial Vehicle
- 10.2. Market Analysis, Insights and Forecast - by Types
- 10.2.1. Autorsar CP
- 10.2.2. Autorsar AP
- 10.1. Market Analysis, Insights and Forecast - by Application
- 11. Competitive Analysis
- 11.1. Global Market Share Analysis 2024
- 11.2. Company Profiles
- 11.2.1 VECTOR
- 11.2.1.1. Overview
- 11.2.1.2. Products
- 11.2.1.3. SWOT Analysis
- 11.2.1.4. Recent Developments
- 11.2.1.5. Financials (Based on Availability)
- 11.2.2 ETAS
- 11.2.2.1. Overview
- 11.2.2.2. Products
- 11.2.2.3. SWOT Analysis
- 11.2.2.4. Recent Developments
- 11.2.2.5. Financials (Based on Availability)
- 11.2.3 EB
- 11.2.3.1. Overview
- 11.2.3.2. Products
- 11.2.3.3. SWOT Analysis
- 11.2.3.4. Recent Developments
- 11.2.3.5. Financials (Based on Availability)
- 11.2.4 KPIT
- 11.2.4.1. Overview
- 11.2.4.2. Products
- 11.2.4.3. SWOT Analysis
- 11.2.4.4. Recent Developments
- 11.2.4.5. Financials (Based on Availability)
- 11.2.5 REACHAUTO
- 11.2.5.1. Overview
- 11.2.5.2. Products
- 11.2.5.3. SWOT Analysis
- 11.2.5.4. Recent Developments
- 11.2.5.5. Financials (Based on Availability)
- 11.2.6 ISoft Infrastructure Software
- 11.2.6.1. Overview
- 11.2.6.2. Products
- 11.2.6.3. SWOT Analysis
- 11.2.6.4. Recent Developments
- 11.2.6.5. Financials (Based on Availability)
- 11.2.7 Jingwei Hirain Technologies
- 11.2.7.1. Overview
- 11.2.7.2. Products
- 11.2.7.3. SWOT Analysis
- 11.2.7.4. Recent Developments
- 11.2.7.5. Financials (Based on Availability)
- 11.2.8 Huawei
- 11.2.8.1. Overview
- 11.2.8.2. Products
- 11.2.8.3. SWOT Analysis
- 11.2.8.4. Recent Developments
- 11.2.8.5. Financials (Based on Availability)
- 11.2.9 Zebra Network Technology
- 11.2.9.1. Overview
- 11.2.9.2. Products
- 11.2.9.3. SWOT Analysis
- 11.2.9.4. Recent Developments
- 11.2.9.5. Financials (Based on Availability)
- 11.2.10 Novauto
- 11.2.10.1. Overview
- 11.2.10.2. Products
- 11.2.10.3. SWOT Analysis
- 11.2.10.4. Recent Developments
- 11.2.10.5. Financials (Based on Availability)
- 11.2.11 Yingchi Technology
- 11.2.11.1. Overview
- 11.2.11.2. Products
- 11.2.11.3. SWOT Analysis
- 11.2.11.4. Recent Developments
- 11.2.11.5. Financials (Based on Availability)
- 11.2.12 Untouch
- 11.2.12.1. Overview
- 11.2.12.2. Products
- 11.2.12.3. SWOT Analysis
- 11.2.12.4. Recent Developments
- 11.2.12.5. Financials (Based on Availability)
- 11.2.13 LinearX Technology
- 11.2.13.1. Overview
- 11.2.13.2. Products
- 11.2.13.3. SWOT Analysis
- 11.2.13.4. Recent Developments
- 11.2.13.5. Financials (Based on Availability)
- 11.2.14 HingeTech
- 11.2.14.1. Overview
- 11.2.14.2. Products
- 11.2.14.3. SWOT Analysis
- 11.2.14.4. Recent Developments
- 11.2.14.5. Financials (Based on Availability)
- 11.2.15 Guoqi Intelligent Control (Beijing) Technology
- 11.2.15.1. Overview
- 11.2.15.2. Products
- 11.2.15.3. SWOT Analysis
- 11.2.15.4. Recent Developments
- 11.2.15.5. Financials (Based on Availability)
- 11.2.1 VECTOR
List of Figures
- Figure 1: Global Autosar Middleware Revenue Breakdown (million, %) by Region 2024 & 2032
- Figure 2: North America Autosar Middleware Revenue (million), by Application 2024 & 2032
- Figure 3: North America Autosar Middleware Revenue Share (%), by Application 2024 & 2032
- Figure 4: North America Autosar Middleware Revenue (million), by Types 2024 & 2032
- Figure 5: North America Autosar Middleware Revenue Share (%), by Types 2024 & 2032
- Figure 6: North America Autosar Middleware Revenue (million), by Country 2024 & 2032
- Figure 7: North America Autosar Middleware Revenue Share (%), by Country 2024 & 2032
- Figure 8: South America Autosar Middleware Revenue (million), by Application 2024 & 2032
- Figure 9: South America Autosar Middleware Revenue Share (%), by Application 2024 & 2032
- Figure 10: South America Autosar Middleware Revenue (million), by Types 2024 & 2032
- Figure 11: South America Autosar Middleware Revenue Share (%), by Types 2024 & 2032
- Figure 12: South America Autosar Middleware Revenue (million), by Country 2024 & 2032
- Figure 13: South America Autosar Middleware Revenue Share (%), by Country 2024 & 2032
- Figure 14: Europe Autosar Middleware Revenue (million), by Application 2024 & 2032
- Figure 15: Europe Autosar Middleware Revenue Share (%), by Application 2024 & 2032
- Figure 16: Europe Autosar Middleware Revenue (million), by Types 2024 & 2032
- Figure 17: Europe Autosar Middleware Revenue Share (%), by Types 2024 & 2032
- Figure 18: Europe Autosar Middleware Revenue (million), by Country 2024 & 2032
- Figure 19: Europe Autosar Middleware Revenue Share (%), by Country 2024 & 2032
- Figure 20: Middle East & Africa Autosar Middleware Revenue (million), by Application 2024 & 2032
- Figure 21: Middle East & Africa Autosar Middleware Revenue Share (%), by Application 2024 & 2032
- Figure 22: Middle East & Africa Autosar Middleware Revenue (million), by Types 2024 & 2032
- Figure 23: Middle East & Africa Autosar Middleware Revenue Share (%), by Types 2024 & 2032
- Figure 24: Middle East & Africa Autosar Middleware Revenue (million), by Country 2024 & 2032
- Figure 25: Middle East & Africa Autosar Middleware Revenue Share (%), by Country 2024 & 2032
- Figure 26: Asia Pacific Autosar Middleware Revenue (million), by Application 2024 & 2032
- Figure 27: Asia Pacific Autosar Middleware Revenue Share (%), by Application 2024 & 2032
- Figure 28: Asia Pacific Autosar Middleware Revenue (million), by Types 2024 & 2032
- Figure 29: Asia Pacific Autosar Middleware Revenue Share (%), by Types 2024 & 2032
- Figure 30: Asia Pacific Autosar Middleware Revenue (million), by Country 2024 & 2032
- Figure 31: Asia Pacific Autosar Middleware Revenue Share (%), by Country 2024 & 2032
List of Tables
- Table 1: Global Autosar Middleware Revenue million Forecast, by Region 2019 & 2032
- Table 2: Global Autosar Middleware Revenue million Forecast, by Application 2019 & 2032
- Table 3: Global Autosar Middleware Revenue million Forecast, by Types 2019 & 2032
- Table 4: Global Autosar Middleware Revenue million Forecast, by Region 2019 & 2032
- Table 5: Global Autosar Middleware Revenue million Forecast, by Application 2019 & 2032
- Table 6: Global Autosar Middleware Revenue million Forecast, by Types 2019 & 2032
- Table 7: Global Autosar Middleware Revenue million Forecast, by Country 2019 & 2032
- Table 8: United States Autosar Middleware Revenue (million) Forecast, by Application 2019 & 2032
- Table 9: Canada Autosar Middleware Revenue (million) Forecast, by Application 2019 & 2032
- Table 10: Mexico Autosar Middleware Revenue (million) Forecast, by Application 2019 & 2032
- Table 11: Global Autosar Middleware Revenue million Forecast, by Application 2019 & 2032
- Table 12: Global Autosar Middleware Revenue million Forecast, by Types 2019 & 2032
- Table 13: Global Autosar Middleware Revenue million Forecast, by Country 2019 & 2032
- Table 14: Brazil Autosar Middleware Revenue (million) Forecast, by Application 2019 & 2032
- Table 15: Argentina Autosar Middleware Revenue (million) Forecast, by Application 2019 & 2032
- Table 16: Rest of South America Autosar Middleware Revenue (million) Forecast, by Application 2019 & 2032
- Table 17: Global Autosar Middleware Revenue million Forecast, by Application 2019 & 2032
- Table 18: Global Autosar Middleware Revenue million Forecast, by Types 2019 & 2032
- Table 19: Global Autosar Middleware Revenue million Forecast, by Country 2019 & 2032
- Table 20: United Kingdom Autosar Middleware Revenue (million) Forecast, by Application 2019 & 2032
- Table 21: Germany Autosar Middleware Revenue (million) Forecast, by Application 2019 & 2032
- Table 22: France Autosar Middleware Revenue (million) Forecast, by Application 2019 & 2032
- Table 23: Italy Autosar Middleware Revenue (million) Forecast, by Application 2019 & 2032
- Table 24: Spain Autosar Middleware Revenue (million) Forecast, by Application 2019 & 2032
- Table 25: Russia Autosar Middleware Revenue (million) Forecast, by Application 2019 & 2032
- Table 26: Benelux Autosar Middleware Revenue (million) Forecast, by Application 2019 & 2032
- Table 27: Nordics Autosar Middleware Revenue (million) Forecast, by Application 2019 & 2032
- Table 28: Rest of Europe Autosar Middleware Revenue (million) Forecast, by Application 2019 & 2032
- Table 29: Global Autosar Middleware Revenue million Forecast, by Application 2019 & 2032
- Table 30: Global Autosar Middleware Revenue million Forecast, by Types 2019 & 2032
- Table 31: Global Autosar Middleware Revenue million Forecast, by Country 2019 & 2032
- Table 32: Turkey Autosar Middleware Revenue (million) Forecast, by Application 2019 & 2032
- Table 33: Israel Autosar Middleware Revenue (million) Forecast, by Application 2019 & 2032
- Table 34: GCC Autosar Middleware Revenue (million) Forecast, by Application 2019 & 2032
- Table 35: North Africa Autosar Middleware Revenue (million) Forecast, by Application 2019 & 2032
- Table 36: South Africa Autosar Middleware Revenue (million) Forecast, by Application 2019 & 2032
- Table 37: Rest of Middle East & Africa Autosar Middleware Revenue (million) Forecast, by Application 2019 & 2032
- Table 38: Global Autosar Middleware Revenue million Forecast, by Application 2019 & 2032
- Table 39: Global Autosar Middleware Revenue million Forecast, by Types 2019 & 2032
- Table 40: Global Autosar Middleware Revenue million Forecast, by Country 2019 & 2032
- Table 41: China Autosar Middleware Revenue (million) Forecast, by Application 2019 & 2032
- Table 42: India Autosar Middleware Revenue (million) Forecast, by Application 2019 & 2032
- Table 43: Japan Autosar Middleware Revenue (million) Forecast, by Application 2019 & 2032
- Table 44: South Korea Autosar Middleware Revenue (million) Forecast, by Application 2019 & 2032
- Table 45: ASEAN Autosar Middleware Revenue (million) Forecast, by Application 2019 & 2032
- Table 46: Oceania Autosar Middleware Revenue (million) Forecast, by Application 2019 & 2032
- Table 47: Rest of Asia Pacific Autosar Middleware Revenue (million) Forecast, by Application 2019 & 2032
Frequently Asked Questions
1. What is the projected Compound Annual Growth Rate (CAGR) of the Autosar Middleware?
The projected CAGR is approximately XX%.
2. Which companies are prominent players in the Autosar Middleware?
Key companies in the market include VECTOR, ETAS, EB, KPIT, REACHAUTO, ISoft Infrastructure Software, Jingwei Hirain Technologies, Huawei, Zebra Network Technology, Novauto, Yingchi Technology, Untouch, LinearX Technology, HingeTech, Guoqi Intelligent Control (Beijing) Technology.
3. What are the main segments of the Autosar Middleware?
The market segments include Application, Types.
4. Can you provide details about the market size?
The market size is estimated to be USD XXX million as of 2022.
5. What are some drivers contributing to market growth?
N/A
6. What are the notable trends driving market growth?
N/A
7. Are there any restraints impacting market growth?
N/A
8. Can you provide examples of recent developments in the market?
N/A
9. What pricing options are available for accessing the report?
Pricing options include single-user, multi-user, and enterprise licenses priced at USD 4900.00, USD 7350.00, and USD 9800.00 respectively.
10. Is the market size provided in terms of value or volume?
The market size is provided in terms of value, measured in million.
11. Are there any specific market keywords associated with the report?
Yes, the market keyword associated with the report is "Autosar Middleware," which aids in identifying and referencing the specific market segment covered.
12. How do I determine which pricing option suits my needs best?
The pricing options vary based on user requirements and access needs. Individual users may opt for single-user licenses, while businesses requiring broader access may choose multi-user or enterprise licenses for cost-effective access to the report.
13. Are there any additional resources or data provided in the Autosar Middleware report?
While the report offers comprehensive insights, it's advisable to review the specific contents or supplementary materials provided to ascertain if additional resources or data are available.
14. How can I stay updated on further developments or reports in the Autosar Middleware?
To stay informed about further developments, trends, and reports in the Autosar Middleware, consider subscribing to industry newsletters, following relevant companies and organizations, or regularly checking reputable industry news sources and publications.
Methodology
Step 1 - Identification of Relevant Samples Size from Population Database


Step 2 - Approaches for Defining Global Market Size (Value, Volume* & Price*)

Note*: In applicable scenarios
Step 3 - Data Sources
Primary Research
- Web Analytics
- Survey Reports
- Research Institute
- Latest Research Reports
- Opinion Leaders
Secondary Research
- Annual Reports
- White Paper
- Latest Press Release
- Industry Association
- Paid Database
- Investor Presentations

Step 4 - Data Triangulation
Involves using different sources of information in order to increase the validity of a study
These sources are likely to be stakeholders in a program - participants, other researchers, program staff, other community members, and so on.
Then we put all data in single framework & apply various statistical tools to find out the dynamic on the market.
During the analysis stage, feedback from the stakeholder groups would be compared to determine areas of agreement as well as areas of divergence
