

Key Insights
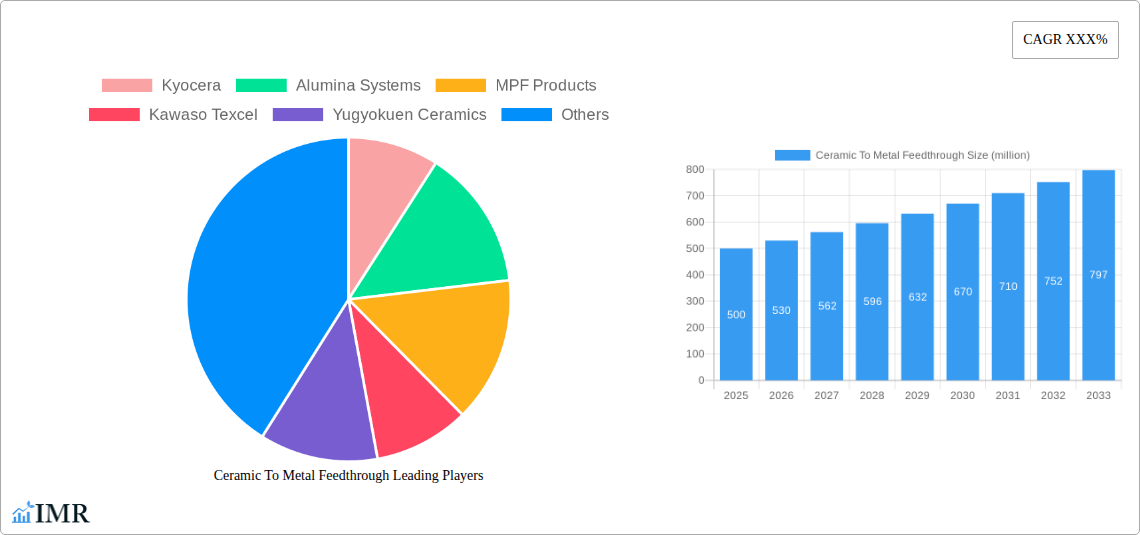
The global ceramic to metal feedthrough market is experiencing robust growth, driven by increasing demand across diverse industries. The market's expansion is fueled by the unique properties of ceramic to metal feedthroughs, such as their excellent hermetic sealing capabilities, high-temperature resistance, and ability to withstand harsh environments. These features make them indispensable components in applications requiring high reliability and precision, such as aerospace, medical devices, semiconductor manufacturing, and automotive electronics. The market is further propelled by advancements in material science, leading to the development of more durable and efficient feedthroughs with enhanced performance characteristics. We estimate the market size in 2025 to be approximately $500 million, with a compound annual growth rate (CAGR) of around 6% projected for the forecast period 2025-2033. This growth is expected to be driven by continuous technological advancements and expanding applications in high-growth sectors.
Key restraining factors include the relatively high cost of ceramic to metal feedthroughs compared to alternative technologies and the complex manufacturing processes involved. However, the increasing demand for high-performance and reliable solutions in critical applications is expected to outweigh these limitations. The market is segmented by type (e.g., single-pin, multi-pin), application (e.g., sensors, actuators, power supplies), and geography. Major players like Kyocera, CeramTec, and Morgan Advanced Materials are actively shaping the market through strategic partnerships, technological innovations, and product diversification. Future growth will likely be influenced by the increasing adoption of automation in manufacturing, the development of advanced materials with improved performance, and the expansion of applications in emerging markets.
Ceramic to Metal Feedthrough Market Report: 2019-2033
This comprehensive report provides an in-depth analysis of the Ceramic to Metal Feedthrough market, encompassing market dynamics, growth trends, regional analysis, competitive landscape, and future outlook. The study period covers 2019-2033, with 2025 as the base and estimated year. The report leverages extensive primary and secondary research to deliver actionable insights for industry professionals, investors, and strategic decision-makers within the parent market of industrial components and the child market of electronic components. The market size is projected to reach xx million units by 2033.
Ceramic To Metal Feedthrough Market Dynamics & Structure
The Ceramic to Metal Feedthrough market is characterized by moderate concentration, with key players like Kyocera, CeramTec, and Morgan Advanced Materials holding significant market share. Technological innovation, driven by the need for higher performance and reliability in demanding applications, is a key driver. Stringent regulatory frameworks, particularly in industries like medical and aerospace, influence product design and manufacturing processes. Competitive substitutes, such as hermetic seals using different materials, pose a challenge. The market is witnessing increasing M&A activity, with xx deals recorded between 2019 and 2024, primarily driven by expansion into new markets and technological capabilities. End-user demographics are diverse, including automotive, medical, aerospace, and industrial automation sectors.
- Market Concentration: Moderately concentrated, with top 5 players holding approximately xx% market share in 2024.
- Technological Innovation: Focus on miniaturization, improved hermeticity, and higher temperature resistance.
- Regulatory Framework: Compliance with industry-specific standards (e.g., ISO, FDA) influences product development.
- Competitive Substitutes: Hermetic seals using glass, plastic, or other metal-to-metal sealing technologies.
- End-User Demographics: Automotive, medical, aerospace, industrial automation, and semiconductor industries.
- M&A Trends: xx deals between 2019 and 2024, primarily focused on acquiring technological expertise and expanding geographic reach.
Ceramic To Metal Feedthrough Growth Trends & Insights
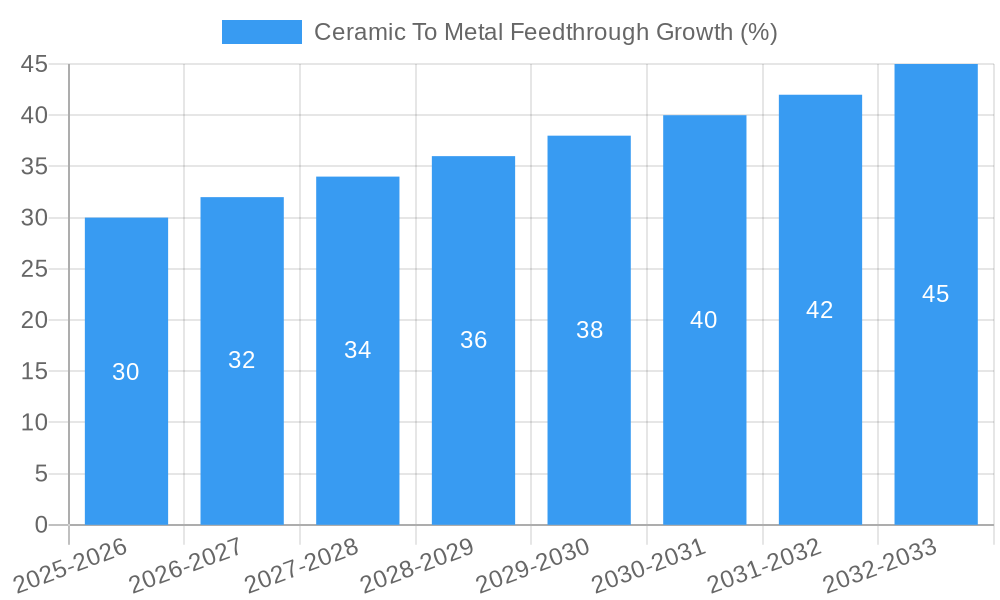
The Ceramic to Metal Feedthrough market exhibited a CAGR of xx% during the historical period (2019-2024), driven by increasing demand from various end-use sectors. The adoption rate is expected to increase steadily during the forecast period (2025-2033), fueled by technological advancements such as improved material compositions and manufacturing processes. Technological disruptions, including the introduction of new materials and sealing techniques, are shaping market dynamics. Shifting consumer behavior towards miniaturization and higher reliability in electronic devices further propels market growth. Market penetration is expected to reach xx% by 2033, primarily in high-growth regions.
Dominant Regions, Countries, or Segments in Ceramic To Metal Feedthrough
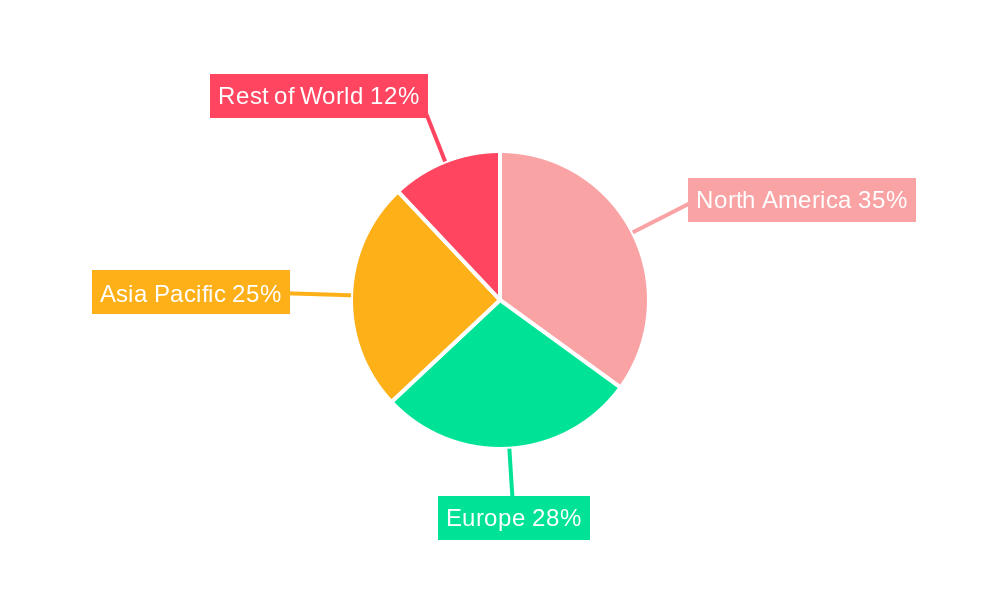
North America currently holds the largest market share, driven by robust demand from the medical and aerospace sectors. This dominance is attributed to factors including strong technological advancements, favorable regulatory environments, and a well-established manufacturing base. Europe and Asia-Pacific are expected to witness significant growth during the forecast period, fueled by increasing industrialization and rising investments in infrastructure development, particularly in the automotive and industrial automation sectors.
- North America: Strong presence of major players, high adoption rates in medical and aerospace.
- Europe: Growth driven by increasing industrial automation and stringent environmental regulations.
- Asia-Pacific: Rapid industrialization, rising disposable incomes, and government initiatives boosting market growth.
- Market Share: North America holds approximately xx% market share in 2024, followed by Europe with xx% and Asia-Pacific with xx%.
Ceramic To Metal Feedthrough Product Landscape
Ceramic to metal feedthrough products are continuously evolving, with innovations focusing on improving hermetic sealing, miniaturization, and resistance to extreme temperatures and pressures. Applications span various industries, from high-vacuum systems to medical implants, demanding high levels of reliability and precision. Unique selling propositions often involve customized designs, specialized materials, and rigorous quality control. Technological advancements such as laser welding and advanced ceramic materials are enabling the development of superior feedthrough products.
Key Drivers, Barriers & Challenges in Ceramic To Metal Feedthrough
Key Drivers: Increasing demand from the medical device industry, growth in the semiconductor sector, and advancements in material science driving higher performance capabilities are key drivers. The need for improved reliability in high-precision applications further propels market growth.
Key Challenges: High manufacturing costs, complex design and manufacturing processes, and potential material limitations present key challenges. Supply chain disruptions caused by geopolitical instability and the availability of specialized materials can also impact market growth. Intense competition necessitates continuous innovation and cost optimization.
Emerging Opportunities in Ceramic To Metal Feedthrough
Emerging opportunities lie in the development of miniaturized feedthroughs for microelectronics, the expansion into niche markets like the renewable energy sector, and the integration of advanced sensing and data acquisition capabilities within feedthrough devices. Customized solutions for specific applications and the use of advanced materials to improve performance are further promising areas.
Growth Accelerators in the Ceramic To Metal Feedthrough Industry
Technological breakthroughs in material science and manufacturing processes, strategic partnerships among players to develop innovative products, and expansion into new and growing markets such as electric vehicles and renewable energy are critical accelerators. Government support for research and development in advanced materials also supports market growth.
Key Players Shaping the Ceramic To Metal Feedthrough Market
- Kyocera
- Alumina Systems
- MPF Products
- Kawaso Texcel
- Yugyokuen Ceramics
- CeramTec
- AdTech Ceramics
- SCT CERAMICS
- Morgan Advanced Materials
- Solid Sealing Technology
Notable Milestones in Ceramic To Metal Feedthrough Sector
- 2021 Q3: Kyocera launched a new line of high-temperature ceramic to metal feedthroughs.
- 2022 Q1: A significant merger occurred between two smaller players in the European market. (Specific details unavailable - xx)
- 2023 Q2: CeramTec announced a breakthrough in material science improving hermetic sealing capabilities.
In-Depth Ceramic To Metal Feedthrough Market Outlook
The Ceramic to Metal Feedthrough market is poised for continued growth, driven by technological innovation and expanding applications across various industries. The demand for reliable, high-performance components is expected to fuel market expansion, creating significant opportunities for established players and new entrants. Strategic investments in R&D, focus on customized solutions, and expansion into niche markets will be crucial for success in this dynamic sector.
Ceramic To Metal Feedthrough Segmentation
-
1. Application
- 1.1. Electric Power
- 1.2. Semiconductor Processing Equipment
- 1.3. Analytical Instruments
- 1.4. Medical Implant
- 1.5. Aerospace Equipement
- 1.6. X-Ray Equipment
- 1.7. Others
-
2. Type
- 2.1. Below 12kV
- 2.2. 12 ~100kV
- 2.3. Above 100kV
Ceramic To Metal Feedthrough Segmentation By Geography
-
1. North America
- 1.1. United States
- 1.2. Canada
- 1.3. Mexico
-
2. South America
- 2.1. Brazil
- 2.2. Argentina
- 2.3. Rest of South America
-
3. Europe
- 3.1. United Kingdom
- 3.2. Germany
- 3.3. France
- 3.4. Italy
- 3.5. Spain
- 3.6. Russia
- 3.7. Benelux
- 3.8. Nordics
- 3.9. Rest of Europe
-
4. Middle East & Africa
- 4.1. Turkey
- 4.2. Israel
- 4.3. GCC
- 4.4. North Africa
- 4.5. South Africa
- 4.6. Rest of Middle East & Africa
-
5. Asia Pacific
- 5.1. China
- 5.2. India
- 5.3. Japan
- 5.4. South Korea
- 5.5. ASEAN
- 5.6. Oceania
- 5.7. Rest of Asia Pacific
Ceramic To Metal Feedthrough REPORT HIGHLIGHTS
| Aspects | Details |
|---|---|
| Study Period | 2019-2033 |
| Base Year | 2024 |
| Estimated Year | 2025 |
| Forecast Period | 2025-2033 |
| Historical Period | 2019-2024 |
| Growth Rate | CAGR of XXX% from 2019-2033 |
| Segmentation |
|
Table of Contents
- 1. Introduction
- 1.1. Research Scope
- 1.2. Market Segmentation
- 1.3. Research Methodology
- 1.4. Definitions and Assumptions
- 2. Executive Summary
- 2.1. Introduction
- 3. Market Dynamics
- 3.1. Introduction
- 3.2. Market Drivers
- 3.3. Market Restrains
- 3.4. Market Trends
- 4. Market Factor Analysis
- 4.1. Porters Five Forces
- 4.2. Supply/Value Chain
- 4.3. PESTEL analysis
- 4.4. Market Entropy
- 4.5. Patent/Trademark Analysis
- 5. Global Ceramic To Metal Feedthrough Analysis, Insights and Forecast, 2019-2031
- 5.1. Market Analysis, Insights and Forecast - by Application
- 5.1.1. Electric Power
- 5.1.2. Semiconductor Processing Equipment
- 5.1.3. Analytical Instruments
- 5.1.4. Medical Implant
- 5.1.5. Aerospace Equipement
- 5.1.6. X-Ray Equipment
- 5.1.7. Others
- 5.2. Market Analysis, Insights and Forecast - by Type
- 5.2.1. Below 12kV
- 5.2.2. 12 ~100kV
- 5.2.3. Above 100kV
- 5.3. Market Analysis, Insights and Forecast - by Region
- 5.3.1. North America
- 5.3.2. South America
- 5.3.3. Europe
- 5.3.4. Middle East & Africa
- 5.3.5. Asia Pacific
- 5.1. Market Analysis, Insights and Forecast - by Application
- 6. North America Ceramic To Metal Feedthrough Analysis, Insights and Forecast, 2019-2031
- 6.1. Market Analysis, Insights and Forecast - by Application
- 6.1.1. Electric Power
- 6.1.2. Semiconductor Processing Equipment
- 6.1.3. Analytical Instruments
- 6.1.4. Medical Implant
- 6.1.5. Aerospace Equipement
- 6.1.6. X-Ray Equipment
- 6.1.7. Others
- 6.2. Market Analysis, Insights and Forecast - by Type
- 6.2.1. Below 12kV
- 6.2.2. 12 ~100kV
- 6.2.3. Above 100kV
- 6.1. Market Analysis, Insights and Forecast - by Application
- 7. South America Ceramic To Metal Feedthrough Analysis, Insights and Forecast, 2019-2031
- 7.1. Market Analysis, Insights and Forecast - by Application
- 7.1.1. Electric Power
- 7.1.2. Semiconductor Processing Equipment
- 7.1.3. Analytical Instruments
- 7.1.4. Medical Implant
- 7.1.5. Aerospace Equipement
- 7.1.6. X-Ray Equipment
- 7.1.7. Others
- 7.2. Market Analysis, Insights and Forecast - by Type
- 7.2.1. Below 12kV
- 7.2.2. 12 ~100kV
- 7.2.3. Above 100kV
- 7.1. Market Analysis, Insights and Forecast - by Application
- 8. Europe Ceramic To Metal Feedthrough Analysis, Insights and Forecast, 2019-2031
- 8.1. Market Analysis, Insights and Forecast - by Application
- 8.1.1. Electric Power
- 8.1.2. Semiconductor Processing Equipment
- 8.1.3. Analytical Instruments
- 8.1.4. Medical Implant
- 8.1.5. Aerospace Equipement
- 8.1.6. X-Ray Equipment
- 8.1.7. Others
- 8.2. Market Analysis, Insights and Forecast - by Type
- 8.2.1. Below 12kV
- 8.2.2. 12 ~100kV
- 8.2.3. Above 100kV
- 8.1. Market Analysis, Insights and Forecast - by Application
- 9. Middle East & Africa Ceramic To Metal Feedthrough Analysis, Insights and Forecast, 2019-2031
- 9.1. Market Analysis, Insights and Forecast - by Application
- 9.1.1. Electric Power
- 9.1.2. Semiconductor Processing Equipment
- 9.1.3. Analytical Instruments
- 9.1.4. Medical Implant
- 9.1.5. Aerospace Equipement
- 9.1.6. X-Ray Equipment
- 9.1.7. Others
- 9.2. Market Analysis, Insights and Forecast - by Type
- 9.2.1. Below 12kV
- 9.2.2. 12 ~100kV
- 9.2.3. Above 100kV
- 9.1. Market Analysis, Insights and Forecast - by Application
- 10. Asia Pacific Ceramic To Metal Feedthrough Analysis, Insights and Forecast, 2019-2031
- 10.1. Market Analysis, Insights and Forecast - by Application
- 10.1.1. Electric Power
- 10.1.2. Semiconductor Processing Equipment
- 10.1.3. Analytical Instruments
- 10.1.4. Medical Implant
- 10.1.5. Aerospace Equipement
- 10.1.6. X-Ray Equipment
- 10.1.7. Others
- 10.2. Market Analysis, Insights and Forecast - by Type
- 10.2.1. Below 12kV
- 10.2.2. 12 ~100kV
- 10.2.3. Above 100kV
- 10.1. Market Analysis, Insights and Forecast - by Application
- 11. Competitive Analysis
- 11.1. Global Market Share Analysis 2024
- 11.2. Company Profiles
- 11.2.1 Kyocera
- 11.2.1.1. Overview
- 11.2.1.2. Products
- 11.2.1.3. SWOT Analysis
- 11.2.1.4. Recent Developments
- 11.2.1.5. Financials (Based on Availability)
- 11.2.2 Alumina Systems
- 11.2.2.1. Overview
- 11.2.2.2. Products
- 11.2.2.3. SWOT Analysis
- 11.2.2.4. Recent Developments
- 11.2.2.5. Financials (Based on Availability)
- 11.2.3 MPF Products
- 11.2.3.1. Overview
- 11.2.3.2. Products
- 11.2.3.3. SWOT Analysis
- 11.2.3.4. Recent Developments
- 11.2.3.5. Financials (Based on Availability)
- 11.2.4 Kawaso Texcel
- 11.2.4.1. Overview
- 11.2.4.2. Products
- 11.2.4.3. SWOT Analysis
- 11.2.4.4. Recent Developments
- 11.2.4.5. Financials (Based on Availability)
- 11.2.5 Yugyokuen Ceramics
- 11.2.5.1. Overview
- 11.2.5.2. Products
- 11.2.5.3. SWOT Analysis
- 11.2.5.4. Recent Developments
- 11.2.5.5. Financials (Based on Availability)
- 11.2.6 CeramTec
- 11.2.6.1. Overview
- 11.2.6.2. Products
- 11.2.6.3. SWOT Analysis
- 11.2.6.4. Recent Developments
- 11.2.6.5. Financials (Based on Availability)
- 11.2.7 AdTech Ceramics
- 11.2.7.1. Overview
- 11.2.7.2. Products
- 11.2.7.3. SWOT Analysis
- 11.2.7.4. Recent Developments
- 11.2.7.5. Financials (Based on Availability)
- 11.2.8 SCT CERAMICS
- 11.2.8.1. Overview
- 11.2.8.2. Products
- 11.2.8.3. SWOT Analysis
- 11.2.8.4. Recent Developments
- 11.2.8.5. Financials (Based on Availability)
- 11.2.9 Morgan Advanced Materials
- 11.2.9.1. Overview
- 11.2.9.2. Products
- 11.2.9.3. SWOT Analysis
- 11.2.9.4. Recent Developments
- 11.2.9.5. Financials (Based on Availability)
- 11.2.10 Solid Sealing Technology
- 11.2.10.1. Overview
- 11.2.10.2. Products
- 11.2.10.3. SWOT Analysis
- 11.2.10.4. Recent Developments
- 11.2.10.5. Financials (Based on Availability)
- 11.2.1 Kyocera
List of Figures
- Figure 1: Global Ceramic To Metal Feedthrough Revenue Breakdown (million, %) by Region 2024 & 2032
- Figure 2: North America Ceramic To Metal Feedthrough Revenue (million), by Application 2024 & 2032
- Figure 3: North America Ceramic To Metal Feedthrough Revenue Share (%), by Application 2024 & 2032
- Figure 4: North America Ceramic To Metal Feedthrough Revenue (million), by Type 2024 & 2032
- Figure 5: North America Ceramic To Metal Feedthrough Revenue Share (%), by Type 2024 & 2032
- Figure 6: North America Ceramic To Metal Feedthrough Revenue (million), by Country 2024 & 2032
- Figure 7: North America Ceramic To Metal Feedthrough Revenue Share (%), by Country 2024 & 2032
- Figure 8: South America Ceramic To Metal Feedthrough Revenue (million), by Application 2024 & 2032
- Figure 9: South America Ceramic To Metal Feedthrough Revenue Share (%), by Application 2024 & 2032
- Figure 10: South America Ceramic To Metal Feedthrough Revenue (million), by Type 2024 & 2032
- Figure 11: South America Ceramic To Metal Feedthrough Revenue Share (%), by Type 2024 & 2032
- Figure 12: South America Ceramic To Metal Feedthrough Revenue (million), by Country 2024 & 2032
- Figure 13: South America Ceramic To Metal Feedthrough Revenue Share (%), by Country 2024 & 2032
- Figure 14: Europe Ceramic To Metal Feedthrough Revenue (million), by Application 2024 & 2032
- Figure 15: Europe Ceramic To Metal Feedthrough Revenue Share (%), by Application 2024 & 2032
- Figure 16: Europe Ceramic To Metal Feedthrough Revenue (million), by Type 2024 & 2032
- Figure 17: Europe Ceramic To Metal Feedthrough Revenue Share (%), by Type 2024 & 2032
- Figure 18: Europe Ceramic To Metal Feedthrough Revenue (million), by Country 2024 & 2032
- Figure 19: Europe Ceramic To Metal Feedthrough Revenue Share (%), by Country 2024 & 2032
- Figure 20: Middle East & Africa Ceramic To Metal Feedthrough Revenue (million), by Application 2024 & 2032
- Figure 21: Middle East & Africa Ceramic To Metal Feedthrough Revenue Share (%), by Application 2024 & 2032
- Figure 22: Middle East & Africa Ceramic To Metal Feedthrough Revenue (million), by Type 2024 & 2032
- Figure 23: Middle East & Africa Ceramic To Metal Feedthrough Revenue Share (%), by Type 2024 & 2032
- Figure 24: Middle East & Africa Ceramic To Metal Feedthrough Revenue (million), by Country 2024 & 2032
- Figure 25: Middle East & Africa Ceramic To Metal Feedthrough Revenue Share (%), by Country 2024 & 2032
- Figure 26: Asia Pacific Ceramic To Metal Feedthrough Revenue (million), by Application 2024 & 2032
- Figure 27: Asia Pacific Ceramic To Metal Feedthrough Revenue Share (%), by Application 2024 & 2032
- Figure 28: Asia Pacific Ceramic To Metal Feedthrough Revenue (million), by Type 2024 & 2032
- Figure 29: Asia Pacific Ceramic To Metal Feedthrough Revenue Share (%), by Type 2024 & 2032
- Figure 30: Asia Pacific Ceramic To Metal Feedthrough Revenue (million), by Country 2024 & 2032
- Figure 31: Asia Pacific Ceramic To Metal Feedthrough Revenue Share (%), by Country 2024 & 2032
List of Tables
- Table 1: Global Ceramic To Metal Feedthrough Revenue million Forecast, by Region 2019 & 2032
- Table 2: Global Ceramic To Metal Feedthrough Revenue million Forecast, by Application 2019 & 2032
- Table 3: Global Ceramic To Metal Feedthrough Revenue million Forecast, by Type 2019 & 2032
- Table 4: Global Ceramic To Metal Feedthrough Revenue million Forecast, by Region 2019 & 2032
- Table 5: Global Ceramic To Metal Feedthrough Revenue million Forecast, by Application 2019 & 2032
- Table 6: Global Ceramic To Metal Feedthrough Revenue million Forecast, by Type 2019 & 2032
- Table 7: Global Ceramic To Metal Feedthrough Revenue million Forecast, by Country 2019 & 2032
- Table 8: United States Ceramic To Metal Feedthrough Revenue (million) Forecast, by Application 2019 & 2032
- Table 9: Canada Ceramic To Metal Feedthrough Revenue (million) Forecast, by Application 2019 & 2032
- Table 10: Mexico Ceramic To Metal Feedthrough Revenue (million) Forecast, by Application 2019 & 2032
- Table 11: Global Ceramic To Metal Feedthrough Revenue million Forecast, by Application 2019 & 2032
- Table 12: Global Ceramic To Metal Feedthrough Revenue million Forecast, by Type 2019 & 2032
- Table 13: Global Ceramic To Metal Feedthrough Revenue million Forecast, by Country 2019 & 2032
- Table 14: Brazil Ceramic To Metal Feedthrough Revenue (million) Forecast, by Application 2019 & 2032
- Table 15: Argentina Ceramic To Metal Feedthrough Revenue (million) Forecast, by Application 2019 & 2032
- Table 16: Rest of South America Ceramic To Metal Feedthrough Revenue (million) Forecast, by Application 2019 & 2032
- Table 17: Global Ceramic To Metal Feedthrough Revenue million Forecast, by Application 2019 & 2032
- Table 18: Global Ceramic To Metal Feedthrough Revenue million Forecast, by Type 2019 & 2032
- Table 19: Global Ceramic To Metal Feedthrough Revenue million Forecast, by Country 2019 & 2032
- Table 20: United Kingdom Ceramic To Metal Feedthrough Revenue (million) Forecast, by Application 2019 & 2032
- Table 21: Germany Ceramic To Metal Feedthrough Revenue (million) Forecast, by Application 2019 & 2032
- Table 22: France Ceramic To Metal Feedthrough Revenue (million) Forecast, by Application 2019 & 2032
- Table 23: Italy Ceramic To Metal Feedthrough Revenue (million) Forecast, by Application 2019 & 2032
- Table 24: Spain Ceramic To Metal Feedthrough Revenue (million) Forecast, by Application 2019 & 2032
- Table 25: Russia Ceramic To Metal Feedthrough Revenue (million) Forecast, by Application 2019 & 2032
- Table 26: Benelux Ceramic To Metal Feedthrough Revenue (million) Forecast, by Application 2019 & 2032
- Table 27: Nordics Ceramic To Metal Feedthrough Revenue (million) Forecast, by Application 2019 & 2032
- Table 28: Rest of Europe Ceramic To Metal Feedthrough Revenue (million) Forecast, by Application 2019 & 2032
- Table 29: Global Ceramic To Metal Feedthrough Revenue million Forecast, by Application 2019 & 2032
- Table 30: Global Ceramic To Metal Feedthrough Revenue million Forecast, by Type 2019 & 2032
- Table 31: Global Ceramic To Metal Feedthrough Revenue million Forecast, by Country 2019 & 2032
- Table 32: Turkey Ceramic To Metal Feedthrough Revenue (million) Forecast, by Application 2019 & 2032
- Table 33: Israel Ceramic To Metal Feedthrough Revenue (million) Forecast, by Application 2019 & 2032
- Table 34: GCC Ceramic To Metal Feedthrough Revenue (million) Forecast, by Application 2019 & 2032
- Table 35: North Africa Ceramic To Metal Feedthrough Revenue (million) Forecast, by Application 2019 & 2032
- Table 36: South Africa Ceramic To Metal Feedthrough Revenue (million) Forecast, by Application 2019 & 2032
- Table 37: Rest of Middle East & Africa Ceramic To Metal Feedthrough Revenue (million) Forecast, by Application 2019 & 2032
- Table 38: Global Ceramic To Metal Feedthrough Revenue million Forecast, by Application 2019 & 2032
- Table 39: Global Ceramic To Metal Feedthrough Revenue million Forecast, by Type 2019 & 2032
- Table 40: Global Ceramic To Metal Feedthrough Revenue million Forecast, by Country 2019 & 2032
- Table 41: China Ceramic To Metal Feedthrough Revenue (million) Forecast, by Application 2019 & 2032
- Table 42: India Ceramic To Metal Feedthrough Revenue (million) Forecast, by Application 2019 & 2032
- Table 43: Japan Ceramic To Metal Feedthrough Revenue (million) Forecast, by Application 2019 & 2032
- Table 44: South Korea Ceramic To Metal Feedthrough Revenue (million) Forecast, by Application 2019 & 2032
- Table 45: ASEAN Ceramic To Metal Feedthrough Revenue (million) Forecast, by Application 2019 & 2032
- Table 46: Oceania Ceramic To Metal Feedthrough Revenue (million) Forecast, by Application 2019 & 2032
- Table 47: Rest of Asia Pacific Ceramic To Metal Feedthrough Revenue (million) Forecast, by Application 2019 & 2032
Frequently Asked Questions
1. What is the projected Compound Annual Growth Rate (CAGR) of the Ceramic To Metal Feedthrough?
The projected CAGR is approximately XXX%.
2. Which companies are prominent players in the Ceramic To Metal Feedthrough?
Key companies in the market include Kyocera, Alumina Systems, MPF Products, Kawaso Texcel, Yugyokuen Ceramics, CeramTec, AdTech Ceramics, SCT CERAMICS, Morgan Advanced Materials, Solid Sealing Technology.
3. What are the main segments of the Ceramic To Metal Feedthrough?
The market segments include Application, Type.
4. Can you provide details about the market size?
The market size is estimated to be USD XXX million as of 2022.
5. What are some drivers contributing to market growth?
N/A
6. What are the notable trends driving market growth?
N/A
7. Are there any restraints impacting market growth?
N/A
8. Can you provide examples of recent developments in the market?
N/A
9. What pricing options are available for accessing the report?
Pricing options include single-user, multi-user, and enterprise licenses priced at USD 2900.00, USD 4350.00, and USD 5800.00 respectively.
10. Is the market size provided in terms of value or volume?
The market size is provided in terms of value, measured in million.
11. Are there any specific market keywords associated with the report?
Yes, the market keyword associated with the report is "Ceramic To Metal Feedthrough," which aids in identifying and referencing the specific market segment covered.
12. How do I determine which pricing option suits my needs best?
The pricing options vary based on user requirements and access needs. Individual users may opt for single-user licenses, while businesses requiring broader access may choose multi-user or enterprise licenses for cost-effective access to the report.
13. Are there any additional resources or data provided in the Ceramic To Metal Feedthrough report?
While the report offers comprehensive insights, it's advisable to review the specific contents or supplementary materials provided to ascertain if additional resources or data are available.
14. How can I stay updated on further developments or reports in the Ceramic To Metal Feedthrough?
To stay informed about further developments, trends, and reports in the Ceramic To Metal Feedthrough, consider subscribing to industry newsletters, following relevant companies and organizations, or regularly checking reputable industry news sources and publications.
Methodology
Step 1 - Identification of Relevant Samples Size from Population Database


Step 2 - Approaches for Defining Global Market Size (Value, Volume* & Price*)

Note*: In applicable scenarios
Step 3 - Data Sources
Primary Research
- Web Analytics
- Survey Reports
- Research Institute
- Latest Research Reports
- Opinion Leaders
Secondary Research
- Annual Reports
- White Paper
- Latest Press Release
- Industry Association
- Paid Database
- Investor Presentations

Step 4 - Data Triangulation
Involves using different sources of information in order to increase the validity of a study
These sources are likely to be stakeholders in a program - participants, other researchers, program staff, other community members, and so on.
Then we put all data in single framework & apply various statistical tools to find out the dynamic on the market.
During the analysis stage, feedback from the stakeholder groups would be compared to determine areas of agreement as well as areas of divergence
