

Key Insights
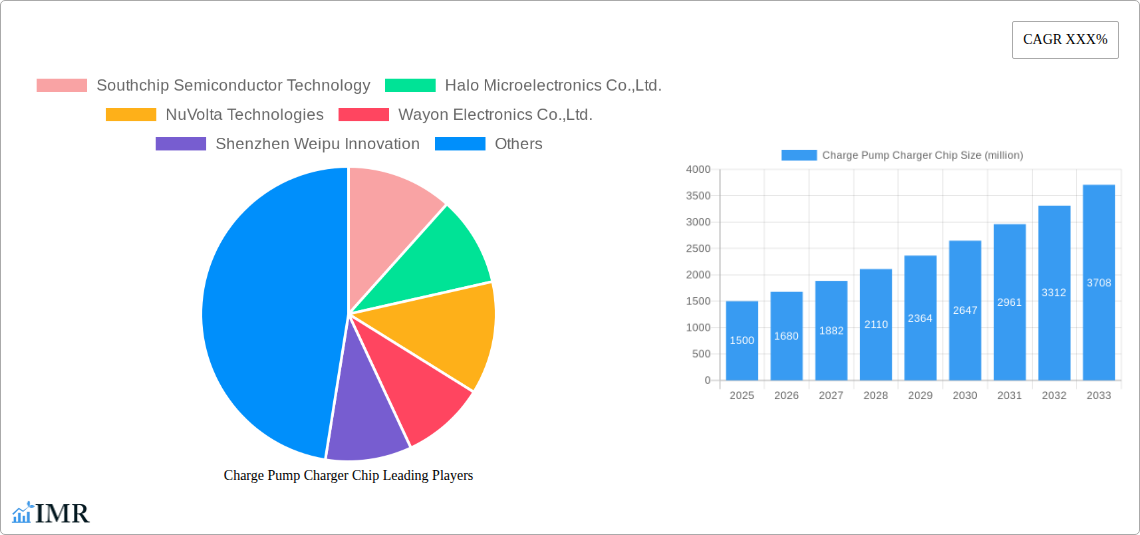
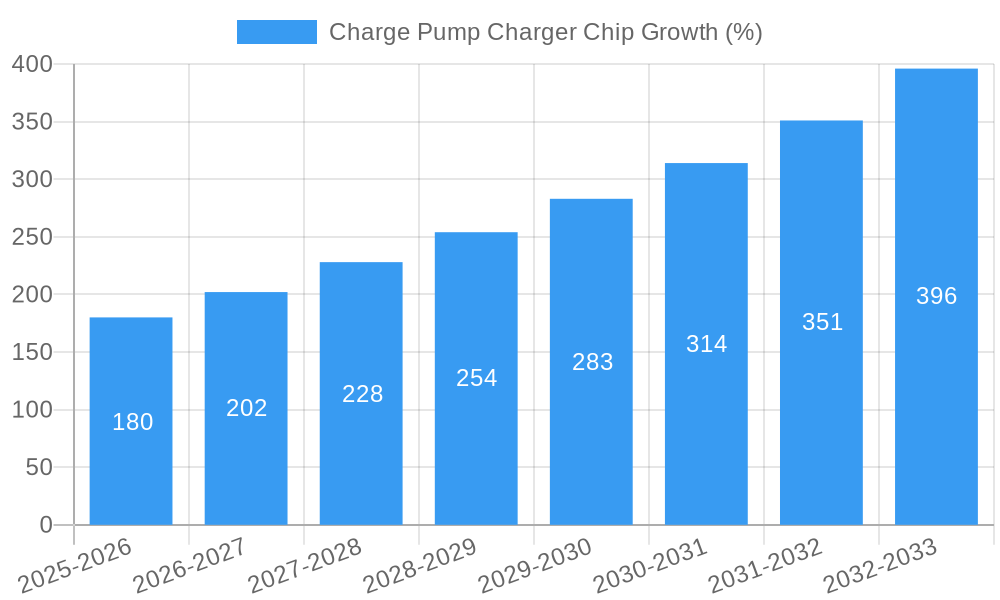
The charge pump charger chip market is experiencing robust growth, driven by the increasing demand for portable electronic devices and the rising adoption of energy-efficient charging solutions. The market, estimated at $1.5 billion in 2025, is projected to exhibit a Compound Annual Growth Rate (CAGR) of 12% from 2025 to 2033, reaching approximately $4.2 billion by 2033. This growth is fueled by several key factors, including the miniaturization of electronic devices, the need for faster charging capabilities, and the increasing integration of charge pump technology into various applications like smartphones, wearables, and IoT devices. The market is segmented by application (e.g., smartphones, wearables, tablets, laptops), technology (e.g., single-stage, multi-stage), and geography. Leading players such as Southchip Semiconductor Technology, Halo Microelectronics Co., Ltd., NuVolta Technologies, Wayon Electronics Co., Ltd., and Shenzhen Weipu Innovation are actively contributing to market expansion through innovation and product diversification.
Despite its strong growth trajectory, the market faces some restraints. These include the increasing complexity of chip design and manufacturing, the rising costs associated with advanced materials and processes, and the potential for competition from alternative charging technologies. However, ongoing research and development efforts focused on improving efficiency, power density, and cost-effectiveness of charge pump chargers are expected to mitigate these challenges. The emergence of new applications in areas like electric vehicles and renewable energy systems presents further opportunities for significant market expansion in the coming years. The competitive landscape is dynamic, with companies focusing on strategic partnerships, acquisitions, and product differentiation to maintain a strong market position.
Charge Pump Charger Chip Market Report: 2019-2033
This comprehensive report provides an in-depth analysis of the Charge Pump Charger Chip market, encompassing market dynamics, growth trends, regional analysis, competitive landscape, and future outlook. The study period covers 2019-2033, with 2025 serving as the base and estimated year. The report caters to industry professionals, investors, and strategists seeking actionable insights into this dynamic market. The parent market is the broader power management integrated circuit (PMIC) market, while the child market is specifically charger ICs. The global market size is projected to reach xx million units by 2033.
Charge Pump Charger Chip Market Dynamics & Structure
The Charge Pump Charger Chip market is characterized by moderate concentration, with a few key players holding significant market share. Technological innovation, particularly in energy efficiency and miniaturization, is a major driver. Regulatory frameworks concerning energy consumption and electronic waste influence product design and manufacturing. Competitive substitutes include linear regulators and switching regulators, though charge pumps offer advantages in specific applications. The end-user demographics are diverse, spanning consumer electronics, automotive, industrial, and medical devices. M&A activity has been relatively moderate, with xx deals recorded between 2019 and 2024.
- Market Concentration: Moderately concentrated, with the top 5 players holding approximately xx% of the market share in 2024.
- Technological Innovation: Focus on improving efficiency, reducing size, and integrating additional functionalities.
- Regulatory Landscape: Compliance with energy efficiency standards and e-waste regulations is crucial.
- Competitive Substitutes: Linear and switching regulators pose competition, but charge pumps are preferred for specific applications needing small size and high efficiency.
- End-User Demographics: Consumer electronics (xx million units in 2024), automotive (xx million units in 2024), industrial (xx million units in 2024), and medical devices (xx million units in 2024) are key segments.
- M&A Activity: xx deals recorded between 2019 and 2024, primarily focused on expanding product portfolios and geographic reach.
Charge Pump Charger Chip Growth Trends & Insights
The Charge Pump Charger Chip market experienced significant growth during the historical period (2019-2024), driven by the increasing demand for portable and wearable electronics. The market size grew from xx million units in 2019 to xx million units in 2024, exhibiting a CAGR of xx%. This growth is expected to continue throughout the forecast period (2025-2033), with adoption rates increasing across various end-user segments. Technological disruptions, such as the development of GaN-based charge pumps, are further accelerating market expansion. Consumer behavior shifts towards smaller, more power-efficient devices are also driving demand. Market penetration is expected to reach xx% by 2033.
Dominant Regions, Countries, or Segments in Charge Pump Charger Chip
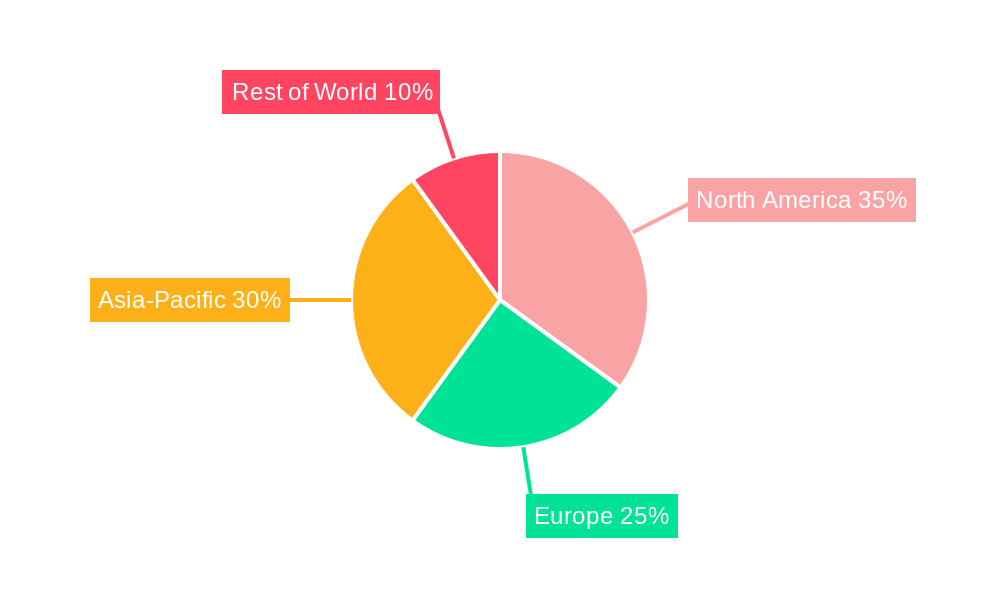
Asia Pacific dominates the Charge Pump Charger Chip market, driven by the robust growth of the consumer electronics industry and the presence of major manufacturing hubs in countries like China, South Korea, and Taiwan. These regions benefit from favorable economic policies supporting technological advancement and a well-established supply chain infrastructure.
- Key Drivers in Asia Pacific: High consumer electronics production, favorable government policies, strong supply chain infrastructure.
- Dominance Factors: Large consumer base, established manufacturing base, cost-effective production.
- Growth Potential: Continued growth is anticipated due to rising disposable incomes and increasing demand for smart devices. Other regions such as North America and Europe are experiencing steady growth, driven by increasing adoption in automotive and industrial applications.
Charge Pump Charger Chip Product Landscape
Charge pump charger chips are constantly evolving, with innovations focused on enhancing efficiency, miniaturization, and integration of additional functionalities. Key features include higher input voltage ranges, improved output current capabilities, and enhanced protection mechanisms. These advancements cater to the diverse needs of different applications, enabling faster charging times and improved battery life. Unique selling propositions frequently include improved efficiency, smaller form factors, and enhanced protection features.
Key Drivers, Barriers & Challenges in Charge Pump Charger Chip
Key Drivers: Increasing demand for portable and wearable electronics, miniaturization trends in consumer electronics, growth of the electric vehicle market, and stringent energy efficiency regulations.
Key Challenges and Restraints: Competition from alternative charging technologies, supply chain disruptions impacting component availability (potentially leading to xx% increase in production costs), and the need for stringent quality control to meet safety standards. Regulatory hurdles in specific regions can also hamper market expansion.
Emerging Opportunities in Charge Pump Charger Chip
Emerging opportunities lie in the expanding applications of charge pumps in areas such as wireless charging, energy harvesting, and Internet of Things (IoT) devices. Untapped markets in developing economies offer significant growth potential. Furthermore, innovative applications in medical devices and automotive electronics are expected to create new demand.
Growth Accelerators in the Charge Pump Charger Chip Industry
Technological advancements, strategic partnerships to expand market reach, and aggressive market penetration strategies by leading companies are driving long-term growth. The development of high-efficiency GaN-based charge pumps is a significant catalyst.
Key Players Shaping the Charge Pump Charger Chip Market
- Southchip Semiconductor Technology
- Halo Microelectronics Co.,Ltd.
- NuVolta Technologies
- Wayon Electronics Co.,Ltd.
- Shenzhen Weipu Innovation
Notable Milestones in Charge Pump Charger Chip Sector
- 2020: NuVolta Technologies launched its high-efficiency GaN-based charge pump.
- 2022: Southchip Semiconductor Technology announced a strategic partnership with a major consumer electronics manufacturer.
- 2023: Increased focus on automotive applications by several key players. (Specific details not available, placeholder used.)
In-Depth Charge Pump Charger Chip Market Outlook
The Charge Pump Charger Chip market is poised for continued growth, driven by technological advancements and expanding applications across various end-user segments. Strategic partnerships and investments in research and development will further fuel market expansion, creating lucrative opportunities for industry players. The market is expected to maintain strong growth momentum throughout the forecast period, with significant potential for further market penetration in emerging economies.
Charge Pump Charger Chip Segmentation
-
1. Application
- 1.1. Smartphone
- 1.2. Tablet PC
- 1.3. Other
-
2. Type
- 2.1. Single Cell
- 2.2. Dual Cell
Charge Pump Charger Chip Segmentation By Geography
-
1. North America
- 1.1. United States
- 1.2. Canada
- 1.3. Mexico
-
2. South America
- 2.1. Brazil
- 2.2. Argentina
- 2.3. Rest of South America
-
3. Europe
- 3.1. United Kingdom
- 3.2. Germany
- 3.3. France
- 3.4. Italy
- 3.5. Spain
- 3.6. Russia
- 3.7. Benelux
- 3.8. Nordics
- 3.9. Rest of Europe
-
4. Middle East & Africa
- 4.1. Turkey
- 4.2. Israel
- 4.3. GCC
- 4.4. North Africa
- 4.5. South Africa
- 4.6. Rest of Middle East & Africa
-
5. Asia Pacific
- 5.1. China
- 5.2. India
- 5.3. Japan
- 5.4. South Korea
- 5.5. ASEAN
- 5.6. Oceania
- 5.7. Rest of Asia Pacific
Charge Pump Charger Chip REPORT HIGHLIGHTS
| Aspects | Details |
|---|---|
| Study Period | 2019-2033 |
| Base Year | 2024 |
| Estimated Year | 2025 |
| Forecast Period | 2025-2033 |
| Historical Period | 2019-2024 |
| Growth Rate | CAGR of XXX% from 2019-2033 |
| Segmentation |
|
Table of Contents
- 1. Introduction
- 1.1. Research Scope
- 1.2. Market Segmentation
- 1.3. Research Methodology
- 1.4. Definitions and Assumptions
- 2. Executive Summary
- 2.1. Introduction
- 3. Market Dynamics
- 3.1. Introduction
- 3.2. Market Drivers
- 3.3. Market Restrains
- 3.4. Market Trends
- 4. Market Factor Analysis
- 4.1. Porters Five Forces
- 4.2. Supply/Value Chain
- 4.3. PESTEL analysis
- 4.4. Market Entropy
- 4.5. Patent/Trademark Analysis
- 5. Global Charge Pump Charger Chip Analysis, Insights and Forecast, 2019-2031
- 5.1. Market Analysis, Insights and Forecast - by Application
- 5.1.1. Smartphone
- 5.1.2. Tablet PC
- 5.1.3. Other
- 5.2. Market Analysis, Insights and Forecast - by Type
- 5.2.1. Single Cell
- 5.2.2. Dual Cell
- 5.3. Market Analysis, Insights and Forecast - by Region
- 5.3.1. North America
- 5.3.2. South America
- 5.3.3. Europe
- 5.3.4. Middle East & Africa
- 5.3.5. Asia Pacific
- 5.1. Market Analysis, Insights and Forecast - by Application
- 6. North America Charge Pump Charger Chip Analysis, Insights and Forecast, 2019-2031
- 6.1. Market Analysis, Insights and Forecast - by Application
- 6.1.1. Smartphone
- 6.1.2. Tablet PC
- 6.1.3. Other
- 6.2. Market Analysis, Insights and Forecast - by Type
- 6.2.1. Single Cell
- 6.2.2. Dual Cell
- 6.1. Market Analysis, Insights and Forecast - by Application
- 7. South America Charge Pump Charger Chip Analysis, Insights and Forecast, 2019-2031
- 7.1. Market Analysis, Insights and Forecast - by Application
- 7.1.1. Smartphone
- 7.1.2. Tablet PC
- 7.1.3. Other
- 7.2. Market Analysis, Insights and Forecast - by Type
- 7.2.1. Single Cell
- 7.2.2. Dual Cell
- 7.1. Market Analysis, Insights and Forecast - by Application
- 8. Europe Charge Pump Charger Chip Analysis, Insights and Forecast, 2019-2031
- 8.1. Market Analysis, Insights and Forecast - by Application
- 8.1.1. Smartphone
- 8.1.2. Tablet PC
- 8.1.3. Other
- 8.2. Market Analysis, Insights and Forecast - by Type
- 8.2.1. Single Cell
- 8.2.2. Dual Cell
- 8.1. Market Analysis, Insights and Forecast - by Application
- 9. Middle East & Africa Charge Pump Charger Chip Analysis, Insights and Forecast, 2019-2031
- 9.1. Market Analysis, Insights and Forecast - by Application
- 9.1.1. Smartphone
- 9.1.2. Tablet PC
- 9.1.3. Other
- 9.2. Market Analysis, Insights and Forecast - by Type
- 9.2.1. Single Cell
- 9.2.2. Dual Cell
- 9.1. Market Analysis, Insights and Forecast - by Application
- 10. Asia Pacific Charge Pump Charger Chip Analysis, Insights and Forecast, 2019-2031
- 10.1. Market Analysis, Insights and Forecast - by Application
- 10.1.1. Smartphone
- 10.1.2. Tablet PC
- 10.1.3. Other
- 10.2. Market Analysis, Insights and Forecast - by Type
- 10.2.1. Single Cell
- 10.2.2. Dual Cell
- 10.1. Market Analysis, Insights and Forecast - by Application
- 11. Competitive Analysis
- 11.1. Global Market Share Analysis 2024
- 11.2. Company Profiles
- 11.2.1 Southchip Semiconductor Technology
- 11.2.1.1. Overview
- 11.2.1.2. Products
- 11.2.1.3. SWOT Analysis
- 11.2.1.4. Recent Developments
- 11.2.1.5. Financials (Based on Availability)
- 11.2.2 Halo Microelectronics Co.Ltd.
- 11.2.2.1. Overview
- 11.2.2.2. Products
- 11.2.2.3. SWOT Analysis
- 11.2.2.4. Recent Developments
- 11.2.2.5. Financials (Based on Availability)
- 11.2.3 NuVolta Technologies
- 11.2.3.1. Overview
- 11.2.3.2. Products
- 11.2.3.3. SWOT Analysis
- 11.2.3.4. Recent Developments
- 11.2.3.5. Financials (Based on Availability)
- 11.2.4 Wayon Electronics Co.Ltd.
- 11.2.4.1. Overview
- 11.2.4.2. Products
- 11.2.4.3. SWOT Analysis
- 11.2.4.4. Recent Developments
- 11.2.4.5. Financials (Based on Availability)
- 11.2.5 Shenzhen Weipu Innovation
- 11.2.5.1. Overview
- 11.2.5.2. Products
- 11.2.5.3. SWOT Analysis
- 11.2.5.4. Recent Developments
- 11.2.5.5. Financials (Based on Availability)
- 11.2.1 Southchip Semiconductor Technology
List of Figures
- Figure 1: Global Charge Pump Charger Chip Revenue Breakdown (million, %) by Region 2024 & 2032
- Figure 2: North America Charge Pump Charger Chip Revenue (million), by Application 2024 & 2032
- Figure 3: North America Charge Pump Charger Chip Revenue Share (%), by Application 2024 & 2032
- Figure 4: North America Charge Pump Charger Chip Revenue (million), by Type 2024 & 2032
- Figure 5: North America Charge Pump Charger Chip Revenue Share (%), by Type 2024 & 2032
- Figure 6: North America Charge Pump Charger Chip Revenue (million), by Country 2024 & 2032
- Figure 7: North America Charge Pump Charger Chip Revenue Share (%), by Country 2024 & 2032
- Figure 8: South America Charge Pump Charger Chip Revenue (million), by Application 2024 & 2032
- Figure 9: South America Charge Pump Charger Chip Revenue Share (%), by Application 2024 & 2032
- Figure 10: South America Charge Pump Charger Chip Revenue (million), by Type 2024 & 2032
- Figure 11: South America Charge Pump Charger Chip Revenue Share (%), by Type 2024 & 2032
- Figure 12: South America Charge Pump Charger Chip Revenue (million), by Country 2024 & 2032
- Figure 13: South America Charge Pump Charger Chip Revenue Share (%), by Country 2024 & 2032
- Figure 14: Europe Charge Pump Charger Chip Revenue (million), by Application 2024 & 2032
- Figure 15: Europe Charge Pump Charger Chip Revenue Share (%), by Application 2024 & 2032
- Figure 16: Europe Charge Pump Charger Chip Revenue (million), by Type 2024 & 2032
- Figure 17: Europe Charge Pump Charger Chip Revenue Share (%), by Type 2024 & 2032
- Figure 18: Europe Charge Pump Charger Chip Revenue (million), by Country 2024 & 2032
- Figure 19: Europe Charge Pump Charger Chip Revenue Share (%), by Country 2024 & 2032
- Figure 20: Middle East & Africa Charge Pump Charger Chip Revenue (million), by Application 2024 & 2032
- Figure 21: Middle East & Africa Charge Pump Charger Chip Revenue Share (%), by Application 2024 & 2032
- Figure 22: Middle East & Africa Charge Pump Charger Chip Revenue (million), by Type 2024 & 2032
- Figure 23: Middle East & Africa Charge Pump Charger Chip Revenue Share (%), by Type 2024 & 2032
- Figure 24: Middle East & Africa Charge Pump Charger Chip Revenue (million), by Country 2024 & 2032
- Figure 25: Middle East & Africa Charge Pump Charger Chip Revenue Share (%), by Country 2024 & 2032
- Figure 26: Asia Pacific Charge Pump Charger Chip Revenue (million), by Application 2024 & 2032
- Figure 27: Asia Pacific Charge Pump Charger Chip Revenue Share (%), by Application 2024 & 2032
- Figure 28: Asia Pacific Charge Pump Charger Chip Revenue (million), by Type 2024 & 2032
- Figure 29: Asia Pacific Charge Pump Charger Chip Revenue Share (%), by Type 2024 & 2032
- Figure 30: Asia Pacific Charge Pump Charger Chip Revenue (million), by Country 2024 & 2032
- Figure 31: Asia Pacific Charge Pump Charger Chip Revenue Share (%), by Country 2024 & 2032
List of Tables
- Table 1: Global Charge Pump Charger Chip Revenue million Forecast, by Region 2019 & 2032
- Table 2: Global Charge Pump Charger Chip Revenue million Forecast, by Application 2019 & 2032
- Table 3: Global Charge Pump Charger Chip Revenue million Forecast, by Type 2019 & 2032
- Table 4: Global Charge Pump Charger Chip Revenue million Forecast, by Region 2019 & 2032
- Table 5: Global Charge Pump Charger Chip Revenue million Forecast, by Application 2019 & 2032
- Table 6: Global Charge Pump Charger Chip Revenue million Forecast, by Type 2019 & 2032
- Table 7: Global Charge Pump Charger Chip Revenue million Forecast, by Country 2019 & 2032
- Table 8: United States Charge Pump Charger Chip Revenue (million) Forecast, by Application 2019 & 2032
- Table 9: Canada Charge Pump Charger Chip Revenue (million) Forecast, by Application 2019 & 2032
- Table 10: Mexico Charge Pump Charger Chip Revenue (million) Forecast, by Application 2019 & 2032
- Table 11: Global Charge Pump Charger Chip Revenue million Forecast, by Application 2019 & 2032
- Table 12: Global Charge Pump Charger Chip Revenue million Forecast, by Type 2019 & 2032
- Table 13: Global Charge Pump Charger Chip Revenue million Forecast, by Country 2019 & 2032
- Table 14: Brazil Charge Pump Charger Chip Revenue (million) Forecast, by Application 2019 & 2032
- Table 15: Argentina Charge Pump Charger Chip Revenue (million) Forecast, by Application 2019 & 2032
- Table 16: Rest of South America Charge Pump Charger Chip Revenue (million) Forecast, by Application 2019 & 2032
- Table 17: Global Charge Pump Charger Chip Revenue million Forecast, by Application 2019 & 2032
- Table 18: Global Charge Pump Charger Chip Revenue million Forecast, by Type 2019 & 2032
- Table 19: Global Charge Pump Charger Chip Revenue million Forecast, by Country 2019 & 2032
- Table 20: United Kingdom Charge Pump Charger Chip Revenue (million) Forecast, by Application 2019 & 2032
- Table 21: Germany Charge Pump Charger Chip Revenue (million) Forecast, by Application 2019 & 2032
- Table 22: France Charge Pump Charger Chip Revenue (million) Forecast, by Application 2019 & 2032
- Table 23: Italy Charge Pump Charger Chip Revenue (million) Forecast, by Application 2019 & 2032
- Table 24: Spain Charge Pump Charger Chip Revenue (million) Forecast, by Application 2019 & 2032
- Table 25: Russia Charge Pump Charger Chip Revenue (million) Forecast, by Application 2019 & 2032
- Table 26: Benelux Charge Pump Charger Chip Revenue (million) Forecast, by Application 2019 & 2032
- Table 27: Nordics Charge Pump Charger Chip Revenue (million) Forecast, by Application 2019 & 2032
- Table 28: Rest of Europe Charge Pump Charger Chip Revenue (million) Forecast, by Application 2019 & 2032
- Table 29: Global Charge Pump Charger Chip Revenue million Forecast, by Application 2019 & 2032
- Table 30: Global Charge Pump Charger Chip Revenue million Forecast, by Type 2019 & 2032
- Table 31: Global Charge Pump Charger Chip Revenue million Forecast, by Country 2019 & 2032
- Table 32: Turkey Charge Pump Charger Chip Revenue (million) Forecast, by Application 2019 & 2032
- Table 33: Israel Charge Pump Charger Chip Revenue (million) Forecast, by Application 2019 & 2032
- Table 34: GCC Charge Pump Charger Chip Revenue (million) Forecast, by Application 2019 & 2032
- Table 35: North Africa Charge Pump Charger Chip Revenue (million) Forecast, by Application 2019 & 2032
- Table 36: South Africa Charge Pump Charger Chip Revenue (million) Forecast, by Application 2019 & 2032
- Table 37: Rest of Middle East & Africa Charge Pump Charger Chip Revenue (million) Forecast, by Application 2019 & 2032
- Table 38: Global Charge Pump Charger Chip Revenue million Forecast, by Application 2019 & 2032
- Table 39: Global Charge Pump Charger Chip Revenue million Forecast, by Type 2019 & 2032
- Table 40: Global Charge Pump Charger Chip Revenue million Forecast, by Country 2019 & 2032
- Table 41: China Charge Pump Charger Chip Revenue (million) Forecast, by Application 2019 & 2032
- Table 42: India Charge Pump Charger Chip Revenue (million) Forecast, by Application 2019 & 2032
- Table 43: Japan Charge Pump Charger Chip Revenue (million) Forecast, by Application 2019 & 2032
- Table 44: South Korea Charge Pump Charger Chip Revenue (million) Forecast, by Application 2019 & 2032
- Table 45: ASEAN Charge Pump Charger Chip Revenue (million) Forecast, by Application 2019 & 2032
- Table 46: Oceania Charge Pump Charger Chip Revenue (million) Forecast, by Application 2019 & 2032
- Table 47: Rest of Asia Pacific Charge Pump Charger Chip Revenue (million) Forecast, by Application 2019 & 2032
Frequently Asked Questions
1. What is the projected Compound Annual Growth Rate (CAGR) of the Charge Pump Charger Chip?
The projected CAGR is approximately XXX%.
2. Which companies are prominent players in the Charge Pump Charger Chip?
Key companies in the market include Southchip Semiconductor Technology, Halo Microelectronics Co.,Ltd., NuVolta Technologies, Wayon Electronics Co.,Ltd., Shenzhen Weipu Innovation.
3. What are the main segments of the Charge Pump Charger Chip?
The market segments include Application, Type.
4. Can you provide details about the market size?
The market size is estimated to be USD XXX million as of 2022.
5. What are some drivers contributing to market growth?
N/A
6. What are the notable trends driving market growth?
N/A
7. Are there any restraints impacting market growth?
N/A
8. Can you provide examples of recent developments in the market?
N/A
9. What pricing options are available for accessing the report?
Pricing options include single-user, multi-user, and enterprise licenses priced at USD 2900.00, USD 4350.00, and USD 5800.00 respectively.
10. Is the market size provided in terms of value or volume?
The market size is provided in terms of value, measured in million.
11. Are there any specific market keywords associated with the report?
Yes, the market keyword associated with the report is "Charge Pump Charger Chip," which aids in identifying and referencing the specific market segment covered.
12. How do I determine which pricing option suits my needs best?
The pricing options vary based on user requirements and access needs. Individual users may opt for single-user licenses, while businesses requiring broader access may choose multi-user or enterprise licenses for cost-effective access to the report.
13. Are there any additional resources or data provided in the Charge Pump Charger Chip report?
While the report offers comprehensive insights, it's advisable to review the specific contents or supplementary materials provided to ascertain if additional resources or data are available.
14. How can I stay updated on further developments or reports in the Charge Pump Charger Chip?
To stay informed about further developments, trends, and reports in the Charge Pump Charger Chip, consider subscribing to industry newsletters, following relevant companies and organizations, or regularly checking reputable industry news sources and publications.
Methodology
Step 1 - Identification of Relevant Samples Size from Population Database


Step 2 - Approaches for Defining Global Market Size (Value, Volume* & Price*)

Note*: In applicable scenarios
Step 3 - Data Sources
Primary Research
- Web Analytics
- Survey Reports
- Research Institute
- Latest Research Reports
- Opinion Leaders
Secondary Research
- Annual Reports
- White Paper
- Latest Press Release
- Industry Association
- Paid Database
- Investor Presentations

Step 4 - Data Triangulation
Involves using different sources of information in order to increase the validity of a study
These sources are likely to be stakeholders in a program - participants, other researchers, program staff, other community members, and so on.
Then we put all data in single framework & apply various statistical tools to find out the dynamic on the market.
During the analysis stage, feedback from the stakeholder groups would be compared to determine areas of agreement as well as areas of divergence
