

Key Insights
The global Cloud Billing market is projected for significant expansion, anticipated to reach $13.87 billion by 2025, driven by a robust Compound Annual Growth Rate (CAGR) of 14.4%. This growth is propelled by escalating cloud service adoption across industries, attributed to scalability, flexibility, and cost-efficiency. Organizations are increasingly migrating to cloud infrastructure, requiring advanced billing solutions for subscription models, usage-based pricing, and recurring revenue management. Enhanced customer experience, accurate revenue recognition, and compliance mandates are further driving investment in sophisticated cloud billing platforms. The flourishing subscription economy necessitates robust cloud billing systems for sustainable growth and operational efficiency.
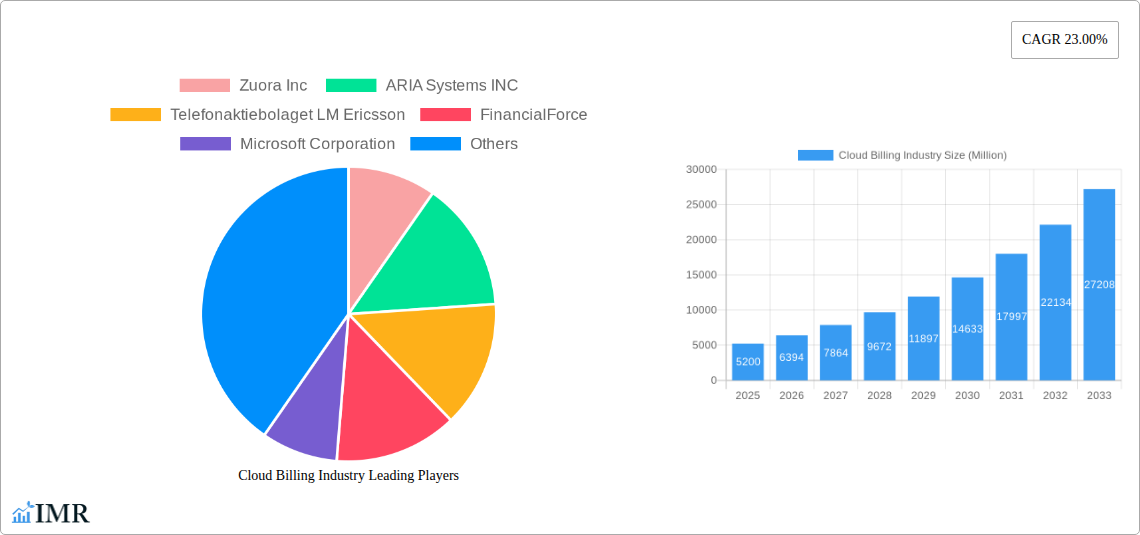
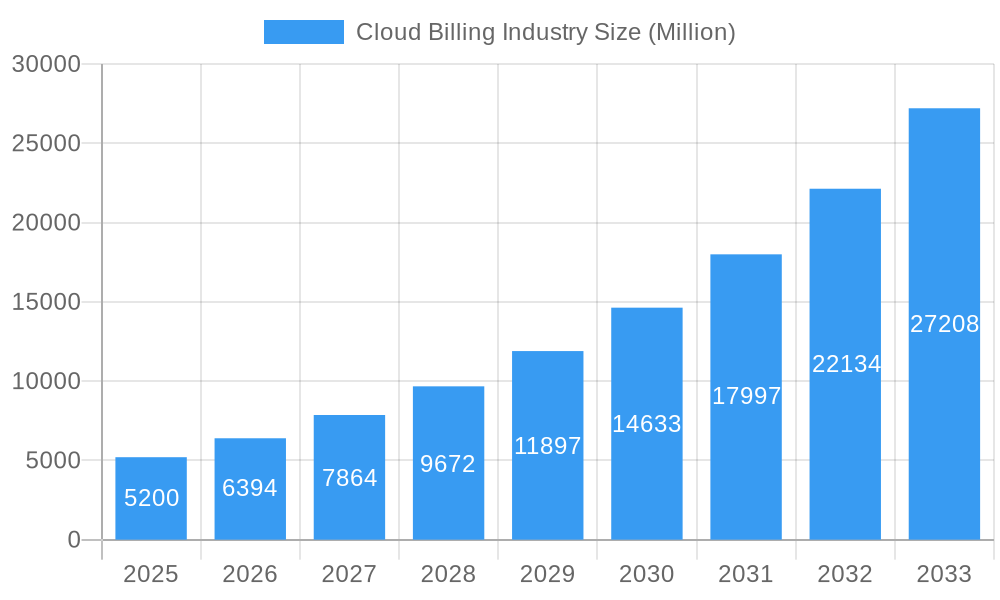
Cloud Billing Industry Market Size (In Billion)
The market features diverse segmentation across Public, Private, and Hybrid Cloud deployments. Both Platform and Services components are experiencing high demand for comprehensive solutions. Key end-user industries driving growth include Retail, Power & Energy, Healthcare, Telecommunications, and BFSI, each presenting unique billing challenges addressed by cloud solutions. Emerging regions, particularly Asia Pacific and Latin America, are poised for rapid expansion with increasing cloud adoption. Leading players such as Zuora Inc, ARIA Systems INC, and Oracle Corporation are innovating to meet evolving market demands. While data security and legacy system integration pose potential challenges, the overarching trend of digital transformation and the inherent advantages of cloud billing are expected to ensure sustained market growth through the forecast period ending 2025.
Cloud Billing Industry Company Market Share
Comprehensive Cloud Billing Industry Report: Market Dynamics, Growth Trends, and Future Outlook (2019-2033)
This in-depth report provides a critical analysis of the global Cloud Billing industry, covering market dynamics, growth trajectories, dominant segments, and future potential. With a study period spanning from 2019 to 2033, this analysis leverages data for the base and estimated year of 2025, and a forecast period from 2025 to 2033, building upon historical data from 2019-2024. Discover the key drivers, challenges, and emerging opportunities shaping this rapidly evolving market, essential for stakeholders seeking to understand and capitalize on advancements in automated invoicing, subscription management, and usage-based billing solutions. This report offers actionable insights for cloud billing platform providers, service integrators, and end-user industries such as Retail, Power & Energy, Healthcare, Telecommunications, and BFSI.
Cloud Billing Industry Market Dynamics & Structure
The Cloud Billing industry is characterized by a dynamic interplay of technological innovation, evolving regulatory landscapes, and intense competitive pressures. Market concentration is moderate, with a few large players like Microsoft Corporation and Amazon Web Services Inc. holding significant influence, alongside specialized providers such as Zuora Inc., ARIA Systems INC, and BillingPlatform. Technological innovation is a primary driver, with ongoing advancements in AI, machine learning, and blockchain integration enhancing billing accuracy, automation, and fraud detection. Regulatory frameworks, particularly concerning data privacy (e.g., GDPR, CCPA) and financial compliance, significantly influence product development and operational strategies. Competitive product substitutes, including on-premise billing systems and manual processes, are gradually being replaced by scalable and agile cloud solutions. End-user demographics are shifting towards greater demand for flexible, usage-based, and subscription-based billing models across all sectors. Mergers and acquisition (M&A) trends are on the rise as companies seek to expand their service offerings, gain market share, and consolidate their positions. For instance, the acquisition of smaller, niche players by larger enterprises aims to integrate advanced functionalities and broaden customer reach.
- Market Concentration: Moderate, with leading cloud providers and specialized billing solution vendors.
- Technological Innovation Drivers: AI/ML for automation and analytics, blockchain for security, IoT integration for usage-based billing.
- Regulatory Frameworks: Data privacy laws (GDPR, CCPA), financial compliance standards, cross-border billing regulations.
- Competitive Product Substitutes: Legacy on-premise systems, ERP integrated billing modules, manual invoicing.
- End-User Demographics: Increasing adoption of subscription and usage-based models, demand for self-service portals.
- M&A Trends: Strategic acquisitions for feature expansion, market consolidation, and customer base acquisition.
Cloud Billing Industry Growth Trends & Insights
The Cloud Billing industry is poised for significant expansion, driven by the accelerating digital transformation across global enterprises and the increasing prevalence of subscription and usage-based business models. The market size is projected to witness a robust Compound Annual Growth Rate (CAGR) of approximately 15-18% during the forecast period. This growth is fueled by enterprises migrating their financial operations to the cloud to leverage scalability, cost-efficiency, and enhanced agility. Adoption rates are particularly high in sectors that have embraced recurring revenue models, such as Software-as-a-Service (SaaS), digital media, and telecommunications. Technological disruptions, including the integration of AI for predictive analytics in billing and advanced automation tools for revenue recognition, are further accelerating market penetration. Consumer behavior shifts are also playing a crucial role; customers increasingly expect personalized pricing, transparent billing, and seamless self-service options, which cloud billing solutions are uniquely positioned to deliver. The demand for granular cost management and chargeback capabilities, especially within large organizations and IT departments, is another key growth enabler. As businesses continue to optimize their operational expenditures and focus on core competencies, the outsourcing of complex billing processes to specialized cloud providers will become increasingly prevalent. The overall market penetration is expected to reach over 70% for businesses adopting digital billing solutions by 2030.
Dominant Regions, Countries, or Segments in Cloud Billing Industry
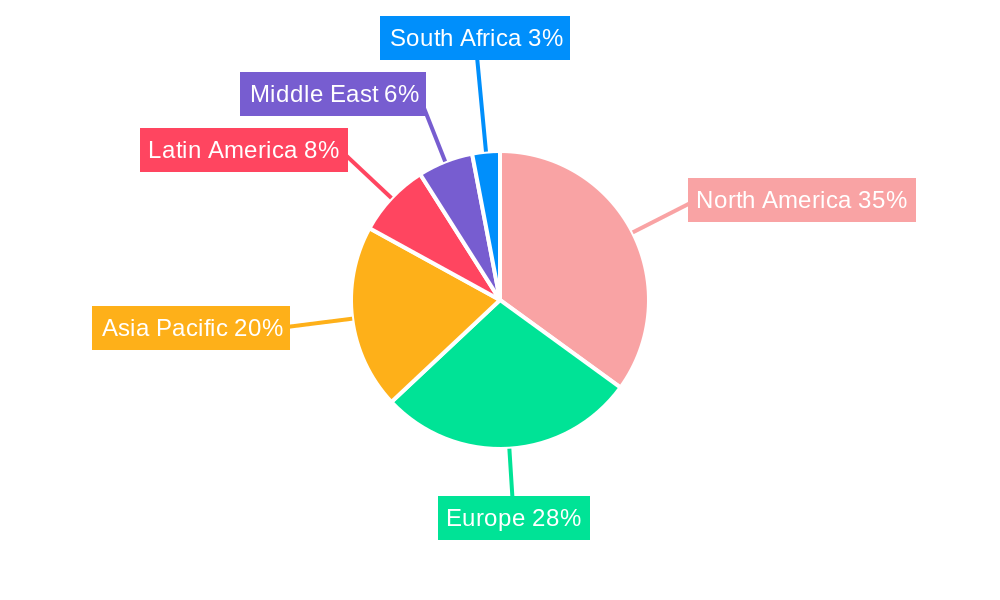
The Public Cloud deployment model is currently the dominant segment within the Cloud Billing industry, driven by its inherent scalability, cost-effectiveness, and accessibility. North America, particularly the United States, leads in market share due to its mature technological infrastructure, a high concentration of technology companies, and a strong adoption rate of cloud services across various end-user industries. The robust economic policies supporting digital innovation and the presence of key industry players like Microsoft Corporation and Amazon Web Services Inc. further solidify its leadership.
Within the Component segment, Services are exhibiting faster growth than the Platform itself. This is attributed to the increasing demand for specialized integration, implementation, and ongoing management of complex billing systems, particularly for businesses undergoing digital transformation. End-user industries like Telecommunications and BFSI (Banking, Financial Services, and Insurance) are significant growth drivers. The telecommunications sector's transition to diverse service plans and bundled offerings necessitates sophisticated billing capabilities, while the BFSI sector requires robust, compliant, and secure billing solutions for a wide array of financial products.
- Dominant Deployment: Public Cloud, due to scalability, cost-efficiency, and accessibility.
- Leading Region: North America, driven by technological maturity and early cloud adoption.
- Leading Country: United States, home to major cloud providers and tech innovation hubs.
- Dominant Component Segment: Services, fueled by demand for implementation and management support.
- Key End-User Industry Drivers:
- Telecommunications: Complex service plans, subscription models, and bundled offerings.
- BFSI: Need for secure, compliant, and versatile billing for financial products.
- Retail: Growth of e-commerce and subscription box services.
- Healthcare: Shift towards value-based care and complex reimbursement models.
Cloud Billing Industry Product Landscape
The Cloud Billing industry's product landscape is rapidly evolving, emphasizing comprehensive solutions that automate the entire revenue lifecycle. Innovations focus on advanced analytics for revenue forecasting, real-time transaction processing, and flexible pricing strategies to accommodate diverse business models, including subscription, usage-based, and hybrid approaches. Platforms are increasingly offering modular architectures, allowing businesses to select and integrate specific functionalities like invoicing, dunning, payment gateway integration, and tax compliance. Key performance metrics revolve around billing accuracy, reduction in manual intervention, faster payment cycles, and improved customer experience through self-service portals and personalized communication. Companies like BillingPlatform are innovating with robust CPQ (Configure, Price, Quote) capabilities integrated directly into their billing systems, streamlining complex sales processes.
Key Drivers, Barriers & Challenges in Cloud Billing Industry
The primary forces propelling the Cloud Billing industry include the accelerating digital transformation, the growing adoption of subscription and usage-based business models, and the inherent benefits of cloud technology such as scalability and cost-efficiency. Technological advancements in AI and automation further enhance operational efficiency and data analytics.
- Key Drivers:
- Digital Transformation Mandates: Businesses seeking agile and efficient operations.
- Subscription Economy Growth: Proliferation of recurring revenue models.
- Cloud Adoption Trends: Migration of critical business functions to the cloud.
- AI & Automation Advancements: Improved accuracy, reduced errors, and enhanced insights.
Key challenges and restraints include the complexities of integrating with legacy systems, the stringent data security and privacy regulations that vary across regions, and the initial investment costs associated with migrating to new billing platforms. Fierce competition and the need for continuous innovation to stay ahead of market demands also pose significant hurdles.
- Key Barriers & Challenges:
- Integration Complexity: Seamlessly connecting with existing ERP and CRM systems.
- Data Security & Privacy Compliance: Adhering to global regulatory standards.
- Initial Implementation Costs: Resource and financial investment for migration.
- Regulatory Hurdles: Navigating diverse and evolving financial and data regulations.
- Talent Acquisition: Shortage of skilled professionals in cloud billing management.
Emerging Opportunities in Cloud Billing Industry
Emerging opportunities in the Cloud Billing industry lie in serving niche markets and developing specialized solutions. The burgeoning Internet of Things (IoT) ecosystem presents a significant opportunity for usage-based billing models, enabling companies to accurately monetize device-level data consumption. Furthermore, the increasing demand for personalized customer experiences is driving the development of AI-powered billing assistants and intelligent self-service portals. The expansion of cloud billing solutions into emerging economies, where digital adoption is accelerating, also represents a substantial untapped market. Innovative applications in areas like blockchain for secure and transparent transaction management and predictive analytics for proactive revenue assurance are also gaining traction.
Growth Accelerators in the Cloud Billing Industry Industry
The long-term growth of the Cloud Billing industry is being significantly accelerated by groundbreaking technological advancements and strategic market expansion initiatives. The continuous refinement of AI and machine learning algorithms to optimize billing processes, detect anomalies, and personalize customer interactions is a major catalyst. Strategic partnerships between cloud billing providers and technology giants, as well as integrations with other business-critical software like CRM and ERP systems, are expanding their reach and capabilities. Market expansion strategies, including targeted outreach to underserved industries and geographical regions, are further driving adoption. The increasing focus on providing end-to-end revenue management solutions, encompassing not just billing but also subscription lifecycle management and analytics, is also fueling sustained growth.
Key Players Shaping the Cloud Billing Industry Market
- Zuora Inc.
- ARIA Systems INC
- Telefonaktiebolaget LM Ericsson
- FinancialForce
- Microsoft Corporation
- Amazon Web Services Inc.
- Oracle Corporation
- BillingPlatform
- Orbitera Inc
- SAP SE
Notable Milestones in Cloud Billing Industry Sector
- January 2023: Input 1, a leader in payments, digital billing, and premium financing, announced a strategic agreement with HawkSoft, an insurance technology supplier for agency management systems. This collaboration enhances premium collecting capabilities for HawkSoft agencies, leveraging Input 1's over 30 years of experience in its comprehensive payments and billing platform. The platform is utilized by more than 125 carriers, financial organizations, managing general agents, and thousands of insurance agents.
- March 2022: Amazon Web Services, Inc. (AWS) launched the AWS Billing Conductor. This application allows users to provide personalized pricing and cost information efficiently to end-users or organizational units, without affecting the existing invoicing and billing relationship with AWS clients. It specifically caters to clients with distinct chargeback requirements.
- March 2022: Aria Systems, a leader in subscription and usage-based revenue growth, announced that Rentokil North America, a global pest control market leader, selected Aria's cloud-based billing platform. Aria's system will manage billing across multiple lines of business for Rentokil, streamlining accounts receivable, reducing manual processes, and improving billing efficiency to support the company's rapid expansion.
In-Depth Cloud Billing Industry Market Outlook
The future market potential for the Cloud Billing industry is exceptionally promising, driven by a confluence of technological innovation and evolving business paradigms. Growth accelerators will continue to center on the intelligent automation of complex billing processes, enabling businesses to achieve greater operational efficiency and financial accuracy. Strategic opportunities abound in serving the increasing demand for real-time analytics, offering deeper insights into revenue streams and customer behavior. The expansion of cloud-native billing solutions tailored for emerging technologies like AI-driven services and decentralized finance will unlock new revenue avenues. Furthermore, a continued focus on enhancing customer experience through self-service options and transparent billing will solidify market leadership. The industry is set to become even more integral to business success, facilitating agile adaptation to market changes and driving sustainable revenue growth.
Cloud Billing Industry Segmentation
-
1. Deployment
- 1.1. Public Cloud
- 1.2. Private Cloud
- 1.3. Hybrid Cloud
-
2. Component
- 2.1. Platform
- 2.2. Services
-
3. End-user Industry
- 3.1. Retail
- 3.2. Power & Energy
- 3.3. Healthcare
- 3.4. Telecommunications
- 3.5. BFSI
- 3.6. Other End-user Industries
Cloud Billing Industry Segmentation By Geography
-
1. North America
- 1.1. United States
- 1.2. Canada
-
2. Europe
- 2.1. United Kingdom
- 2.2. Germany
- 2.3. France
- 2.4. Rest of Europe
-
3. Asia Pacific
- 3.1. China
- 3.2. India
- 3.3. South Korea
- 3.4. Rest of Asia Pacific
-
4. Latin America
- 4.1. Brazil
- 4.2. Mexico
- 4.3. Rest of Latin America
- 5. Middle East
-
6. United Arab Emirates
- 6.1. South Africa
- 6.2. Saudi Arabia
- 6.3. Rest of Middle East
Cloud Billing Industry Regional Market Share
Geographic Coverage of Cloud Billing Industry
Cloud Billing Industry REPORT HIGHLIGHTS
| Aspects | Details |
|---|---|
| Study Period | 2020-2034 |
| Base Year | 2025 |
| Estimated Year | 2026 |
| Forecast Period | 2026-2034 |
| Historical Period | 2020-2025 |
| Growth Rate | CAGR of 14.4% from 2020-2034 |
| Segmentation |
|
Table of Contents
- 1. Introduction
- 1.1. Research Scope
- 1.2. Market Segmentation
- 1.3. Research Methodology
- 1.4. Definitions and Assumptions
- 2. Executive Summary
- 2.1. Introduction
- 3. Market Dynamics
- 3.1. Introduction
- 3.2. Market Drivers
- 3.2.1. Increasing Adoption of Cloud Computing; Growth in E-commerce Platforms
- 3.3. Market Restrains
- 3.3.1. Transition From On-Premise to Cloud-Based Solutions; High Costs Involved and Data Privacy Issues
- 3.4. Market Trends
- 3.4.1. Retail Sector Expected to Show Maximum Application
- 4. Market Factor Analysis
- 4.1. Porters Five Forces
- 4.2. Supply/Value Chain
- 4.3. PESTEL analysis
- 4.4. Market Entropy
- 4.5. Patent/Trademark Analysis
- 5. Global Cloud Billing Industry Analysis, Insights and Forecast, 2020-2032
- 5.1. Market Analysis, Insights and Forecast - by Deployment
- 5.1.1. Public Cloud
- 5.1.2. Private Cloud
- 5.1.3. Hybrid Cloud
- 5.2. Market Analysis, Insights and Forecast - by Component
- 5.2.1. Platform
- 5.2.2. Services
- 5.3. Market Analysis, Insights and Forecast - by End-user Industry
- 5.3.1. Retail
- 5.3.2. Power & Energy
- 5.3.3. Healthcare
- 5.3.4. Telecommunications
- 5.3.5. BFSI
- 5.3.6. Other End-user Industries
- 5.4. Market Analysis, Insights and Forecast - by Region
- 5.4.1. North America
- 5.4.2. Europe
- 5.4.3. Asia Pacific
- 5.4.4. Latin America
- 5.4.5. Middle East
- 5.4.6. United Arab Emirates
- 5.1. Market Analysis, Insights and Forecast - by Deployment
- 6. North America Cloud Billing Industry Analysis, Insights and Forecast, 2020-2032
- 6.1. Market Analysis, Insights and Forecast - by Deployment
- 6.1.1. Public Cloud
- 6.1.2. Private Cloud
- 6.1.3. Hybrid Cloud
- 6.2. Market Analysis, Insights and Forecast - by Component
- 6.2.1. Platform
- 6.2.2. Services
- 6.3. Market Analysis, Insights and Forecast - by End-user Industry
- 6.3.1. Retail
- 6.3.2. Power & Energy
- 6.3.3. Healthcare
- 6.3.4. Telecommunications
- 6.3.5. BFSI
- 6.3.6. Other End-user Industries
- 6.1. Market Analysis, Insights and Forecast - by Deployment
- 7. Europe Cloud Billing Industry Analysis, Insights and Forecast, 2020-2032
- 7.1. Market Analysis, Insights and Forecast - by Deployment
- 7.1.1. Public Cloud
- 7.1.2. Private Cloud
- 7.1.3. Hybrid Cloud
- 7.2. Market Analysis, Insights and Forecast - by Component
- 7.2.1. Platform
- 7.2.2. Services
- 7.3. Market Analysis, Insights and Forecast - by End-user Industry
- 7.3.1. Retail
- 7.3.2. Power & Energy
- 7.3.3. Healthcare
- 7.3.4. Telecommunications
- 7.3.5. BFSI
- 7.3.6. Other End-user Industries
- 7.1. Market Analysis, Insights and Forecast - by Deployment
- 8. Asia Pacific Cloud Billing Industry Analysis, Insights and Forecast, 2020-2032
- 8.1. Market Analysis, Insights and Forecast - by Deployment
- 8.1.1. Public Cloud
- 8.1.2. Private Cloud
- 8.1.3. Hybrid Cloud
- 8.2. Market Analysis, Insights and Forecast - by Component
- 8.2.1. Platform
- 8.2.2. Services
- 8.3. Market Analysis, Insights and Forecast - by End-user Industry
- 8.3.1. Retail
- 8.3.2. Power & Energy
- 8.3.3. Healthcare
- 8.3.4. Telecommunications
- 8.3.5. BFSI
- 8.3.6. Other End-user Industries
- 8.1. Market Analysis, Insights and Forecast - by Deployment
- 9. Latin America Cloud Billing Industry Analysis, Insights and Forecast, 2020-2032
- 9.1. Market Analysis, Insights and Forecast - by Deployment
- 9.1.1. Public Cloud
- 9.1.2. Private Cloud
- 9.1.3. Hybrid Cloud
- 9.2. Market Analysis, Insights and Forecast - by Component
- 9.2.1. Platform
- 9.2.2. Services
- 9.3. Market Analysis, Insights and Forecast - by End-user Industry
- 9.3.1. Retail
- 9.3.2. Power & Energy
- 9.3.3. Healthcare
- 9.3.4. Telecommunications
- 9.3.5. BFSI
- 9.3.6. Other End-user Industries
- 9.1. Market Analysis, Insights and Forecast - by Deployment
- 10. Middle East Cloud Billing Industry Analysis, Insights and Forecast, 2020-2032
- 10.1. Market Analysis, Insights and Forecast - by Deployment
- 10.1.1. Public Cloud
- 10.1.2. Private Cloud
- 10.1.3. Hybrid Cloud
- 10.2. Market Analysis, Insights and Forecast - by Component
- 10.2.1. Platform
- 10.2.2. Services
- 10.3. Market Analysis, Insights and Forecast - by End-user Industry
- 10.3.1. Retail
- 10.3.2. Power & Energy
- 10.3.3. Healthcare
- 10.3.4. Telecommunications
- 10.3.5. BFSI
- 10.3.6. Other End-user Industries
- 10.1. Market Analysis, Insights and Forecast - by Deployment
- 11. United Arab Emirates Cloud Billing Industry Analysis, Insights and Forecast, 2020-2032
- 11.1. Market Analysis, Insights and Forecast - by Deployment
- 11.1.1. Public Cloud
- 11.1.2. Private Cloud
- 11.1.3. Hybrid Cloud
- 11.2. Market Analysis, Insights and Forecast - by Component
- 11.2.1. Platform
- 11.2.2. Services
- 11.3. Market Analysis, Insights and Forecast - by End-user Industry
- 11.3.1. Retail
- 11.3.2. Power & Energy
- 11.3.3. Healthcare
- 11.3.4. Telecommunications
- 11.3.5. BFSI
- 11.3.6. Other End-user Industries
- 11.1. Market Analysis, Insights and Forecast - by Deployment
- 12. Competitive Analysis
- 12.1. Global Market Share Analysis 2025
- 12.2. Company Profiles
- 12.2.1 Zuora Inc
- 12.2.1.1. Overview
- 12.2.1.2. Products
- 12.2.1.3. SWOT Analysis
- 12.2.1.4. Recent Developments
- 12.2.1.5. Financials (Based on Availability)
- 12.2.2 ARIA Systems INC
- 12.2.2.1. Overview
- 12.2.2.2. Products
- 12.2.2.3. SWOT Analysis
- 12.2.2.4. Recent Developments
- 12.2.2.5. Financials (Based on Availability)
- 12.2.3 Telefonaktiebolaget LM Ericsson
- 12.2.3.1. Overview
- 12.2.3.2. Products
- 12.2.3.3. SWOT Analysis
- 12.2.3.4. Recent Developments
- 12.2.3.5. Financials (Based on Availability)
- 12.2.4 FinancialForce
- 12.2.4.1. Overview
- 12.2.4.2. Products
- 12.2.4.3. SWOT Analysis
- 12.2.4.4. Recent Developments
- 12.2.4.5. Financials (Based on Availability)
- 12.2.5 Microsoft Corporation
- 12.2.5.1. Overview
- 12.2.5.2. Products
- 12.2.5.3. SWOT Analysis
- 12.2.5.4. Recent Developments
- 12.2.5.5. Financials (Based on Availability)
- 12.2.6 Amazon Web Services Inc
- 12.2.6.1. Overview
- 12.2.6.2. Products
- 12.2.6.3. SWOT Analysis
- 12.2.6.4. Recent Developments
- 12.2.6.5. Financials (Based on Availability)
- 12.2.7 Oracle Corporation
- 12.2.7.1. Overview
- 12.2.7.2. Products
- 12.2.7.3. SWOT Analysis
- 12.2.7.4. Recent Developments
- 12.2.7.5. Financials (Based on Availability)
- 12.2.8 BillingPlatform
- 12.2.8.1. Overview
- 12.2.8.2. Products
- 12.2.8.3. SWOT Analysis
- 12.2.8.4. Recent Developments
- 12.2.8.5. Financials (Based on Availability)
- 12.2.9 Orbitera Inc
- 12.2.9.1. Overview
- 12.2.9.2. Products
- 12.2.9.3. SWOT Analysis
- 12.2.9.4. Recent Developments
- 12.2.9.5. Financials (Based on Availability)
- 12.2.10 SAP SE
- 12.2.10.1. Overview
- 12.2.10.2. Products
- 12.2.10.3. SWOT Analysis
- 12.2.10.4. Recent Developments
- 12.2.10.5. Financials (Based on Availability)
- 12.2.1 Zuora Inc
List of Figures
- Figure 1: Global Cloud Billing Industry Revenue Breakdown (billion, %) by Region 2025 & 2033
- Figure 2: Global Cloud Billing Industry Volume Breakdown (K Unit, %) by Region 2025 & 2033
- Figure 3: North America Cloud Billing Industry Revenue (billion), by Deployment 2025 & 2033
- Figure 4: North America Cloud Billing Industry Volume (K Unit), by Deployment 2025 & 2033
- Figure 5: North America Cloud Billing Industry Revenue Share (%), by Deployment 2025 & 2033
- Figure 6: North America Cloud Billing Industry Volume Share (%), by Deployment 2025 & 2033
- Figure 7: North America Cloud Billing Industry Revenue (billion), by Component 2025 & 2033
- Figure 8: North America Cloud Billing Industry Volume (K Unit), by Component 2025 & 2033
- Figure 9: North America Cloud Billing Industry Revenue Share (%), by Component 2025 & 2033
- Figure 10: North America Cloud Billing Industry Volume Share (%), by Component 2025 & 2033
- Figure 11: North America Cloud Billing Industry Revenue (billion), by End-user Industry 2025 & 2033
- Figure 12: North America Cloud Billing Industry Volume (K Unit), by End-user Industry 2025 & 2033
- Figure 13: North America Cloud Billing Industry Revenue Share (%), by End-user Industry 2025 & 2033
- Figure 14: North America Cloud Billing Industry Volume Share (%), by End-user Industry 2025 & 2033
- Figure 15: North America Cloud Billing Industry Revenue (billion), by Country 2025 & 2033
- Figure 16: North America Cloud Billing Industry Volume (K Unit), by Country 2025 & 2033
- Figure 17: North America Cloud Billing Industry Revenue Share (%), by Country 2025 & 2033
- Figure 18: North America Cloud Billing Industry Volume Share (%), by Country 2025 & 2033
- Figure 19: Europe Cloud Billing Industry Revenue (billion), by Deployment 2025 & 2033
- Figure 20: Europe Cloud Billing Industry Volume (K Unit), by Deployment 2025 & 2033
- Figure 21: Europe Cloud Billing Industry Revenue Share (%), by Deployment 2025 & 2033
- Figure 22: Europe Cloud Billing Industry Volume Share (%), by Deployment 2025 & 2033
- Figure 23: Europe Cloud Billing Industry Revenue (billion), by Component 2025 & 2033
- Figure 24: Europe Cloud Billing Industry Volume (K Unit), by Component 2025 & 2033
- Figure 25: Europe Cloud Billing Industry Revenue Share (%), by Component 2025 & 2033
- Figure 26: Europe Cloud Billing Industry Volume Share (%), by Component 2025 & 2033
- Figure 27: Europe Cloud Billing Industry Revenue (billion), by End-user Industry 2025 & 2033
- Figure 28: Europe Cloud Billing Industry Volume (K Unit), by End-user Industry 2025 & 2033
- Figure 29: Europe Cloud Billing Industry Revenue Share (%), by End-user Industry 2025 & 2033
- Figure 30: Europe Cloud Billing Industry Volume Share (%), by End-user Industry 2025 & 2033
- Figure 31: Europe Cloud Billing Industry Revenue (billion), by Country 2025 & 2033
- Figure 32: Europe Cloud Billing Industry Volume (K Unit), by Country 2025 & 2033
- Figure 33: Europe Cloud Billing Industry Revenue Share (%), by Country 2025 & 2033
- Figure 34: Europe Cloud Billing Industry Volume Share (%), by Country 2025 & 2033
- Figure 35: Asia Pacific Cloud Billing Industry Revenue (billion), by Deployment 2025 & 2033
- Figure 36: Asia Pacific Cloud Billing Industry Volume (K Unit), by Deployment 2025 & 2033
- Figure 37: Asia Pacific Cloud Billing Industry Revenue Share (%), by Deployment 2025 & 2033
- Figure 38: Asia Pacific Cloud Billing Industry Volume Share (%), by Deployment 2025 & 2033
- Figure 39: Asia Pacific Cloud Billing Industry Revenue (billion), by Component 2025 & 2033
- Figure 40: Asia Pacific Cloud Billing Industry Volume (K Unit), by Component 2025 & 2033
- Figure 41: Asia Pacific Cloud Billing Industry Revenue Share (%), by Component 2025 & 2033
- Figure 42: Asia Pacific Cloud Billing Industry Volume Share (%), by Component 2025 & 2033
- Figure 43: Asia Pacific Cloud Billing Industry Revenue (billion), by End-user Industry 2025 & 2033
- Figure 44: Asia Pacific Cloud Billing Industry Volume (K Unit), by End-user Industry 2025 & 2033
- Figure 45: Asia Pacific Cloud Billing Industry Revenue Share (%), by End-user Industry 2025 & 2033
- Figure 46: Asia Pacific Cloud Billing Industry Volume Share (%), by End-user Industry 2025 & 2033
- Figure 47: Asia Pacific Cloud Billing Industry Revenue (billion), by Country 2025 & 2033
- Figure 48: Asia Pacific Cloud Billing Industry Volume (K Unit), by Country 2025 & 2033
- Figure 49: Asia Pacific Cloud Billing Industry Revenue Share (%), by Country 2025 & 2033
- Figure 50: Asia Pacific Cloud Billing Industry Volume Share (%), by Country 2025 & 2033
- Figure 51: Latin America Cloud Billing Industry Revenue (billion), by Deployment 2025 & 2033
- Figure 52: Latin America Cloud Billing Industry Volume (K Unit), by Deployment 2025 & 2033
- Figure 53: Latin America Cloud Billing Industry Revenue Share (%), by Deployment 2025 & 2033
- Figure 54: Latin America Cloud Billing Industry Volume Share (%), by Deployment 2025 & 2033
- Figure 55: Latin America Cloud Billing Industry Revenue (billion), by Component 2025 & 2033
- Figure 56: Latin America Cloud Billing Industry Volume (K Unit), by Component 2025 & 2033
- Figure 57: Latin America Cloud Billing Industry Revenue Share (%), by Component 2025 & 2033
- Figure 58: Latin America Cloud Billing Industry Volume Share (%), by Component 2025 & 2033
- Figure 59: Latin America Cloud Billing Industry Revenue (billion), by End-user Industry 2025 & 2033
- Figure 60: Latin America Cloud Billing Industry Volume (K Unit), by End-user Industry 2025 & 2033
- Figure 61: Latin America Cloud Billing Industry Revenue Share (%), by End-user Industry 2025 & 2033
- Figure 62: Latin America Cloud Billing Industry Volume Share (%), by End-user Industry 2025 & 2033
- Figure 63: Latin America Cloud Billing Industry Revenue (billion), by Country 2025 & 2033
- Figure 64: Latin America Cloud Billing Industry Volume (K Unit), by Country 2025 & 2033
- Figure 65: Latin America Cloud Billing Industry Revenue Share (%), by Country 2025 & 2033
- Figure 66: Latin America Cloud Billing Industry Volume Share (%), by Country 2025 & 2033
- Figure 67: Middle East Cloud Billing Industry Revenue (billion), by Deployment 2025 & 2033
- Figure 68: Middle East Cloud Billing Industry Volume (K Unit), by Deployment 2025 & 2033
- Figure 69: Middle East Cloud Billing Industry Revenue Share (%), by Deployment 2025 & 2033
- Figure 70: Middle East Cloud Billing Industry Volume Share (%), by Deployment 2025 & 2033
- Figure 71: Middle East Cloud Billing Industry Revenue (billion), by Component 2025 & 2033
- Figure 72: Middle East Cloud Billing Industry Volume (K Unit), by Component 2025 & 2033
- Figure 73: Middle East Cloud Billing Industry Revenue Share (%), by Component 2025 & 2033
- Figure 74: Middle East Cloud Billing Industry Volume Share (%), by Component 2025 & 2033
- Figure 75: Middle East Cloud Billing Industry Revenue (billion), by End-user Industry 2025 & 2033
- Figure 76: Middle East Cloud Billing Industry Volume (K Unit), by End-user Industry 2025 & 2033
- Figure 77: Middle East Cloud Billing Industry Revenue Share (%), by End-user Industry 2025 & 2033
- Figure 78: Middle East Cloud Billing Industry Volume Share (%), by End-user Industry 2025 & 2033
- Figure 79: Middle East Cloud Billing Industry Revenue (billion), by Country 2025 & 2033
- Figure 80: Middle East Cloud Billing Industry Volume (K Unit), by Country 2025 & 2033
- Figure 81: Middle East Cloud Billing Industry Revenue Share (%), by Country 2025 & 2033
- Figure 82: Middle East Cloud Billing Industry Volume Share (%), by Country 2025 & 2033
- Figure 83: United Arab Emirates Cloud Billing Industry Revenue (billion), by Deployment 2025 & 2033
- Figure 84: United Arab Emirates Cloud Billing Industry Volume (K Unit), by Deployment 2025 & 2033
- Figure 85: United Arab Emirates Cloud Billing Industry Revenue Share (%), by Deployment 2025 & 2033
- Figure 86: United Arab Emirates Cloud Billing Industry Volume Share (%), by Deployment 2025 & 2033
- Figure 87: United Arab Emirates Cloud Billing Industry Revenue (billion), by Component 2025 & 2033
- Figure 88: United Arab Emirates Cloud Billing Industry Volume (K Unit), by Component 2025 & 2033
- Figure 89: United Arab Emirates Cloud Billing Industry Revenue Share (%), by Component 2025 & 2033
- Figure 90: United Arab Emirates Cloud Billing Industry Volume Share (%), by Component 2025 & 2033
- Figure 91: United Arab Emirates Cloud Billing Industry Revenue (billion), by End-user Industry 2025 & 2033
- Figure 92: United Arab Emirates Cloud Billing Industry Volume (K Unit), by End-user Industry 2025 & 2033
- Figure 93: United Arab Emirates Cloud Billing Industry Revenue Share (%), by End-user Industry 2025 & 2033
- Figure 94: United Arab Emirates Cloud Billing Industry Volume Share (%), by End-user Industry 2025 & 2033
- Figure 95: United Arab Emirates Cloud Billing Industry Revenue (billion), by Country 2025 & 2033
- Figure 96: United Arab Emirates Cloud Billing Industry Volume (K Unit), by Country 2025 & 2033
- Figure 97: United Arab Emirates Cloud Billing Industry Revenue Share (%), by Country 2025 & 2033
- Figure 98: United Arab Emirates Cloud Billing Industry Volume Share (%), by Country 2025 & 2033
List of Tables
- Table 1: Global Cloud Billing Industry Revenue billion Forecast, by Deployment 2020 & 2033
- Table 2: Global Cloud Billing Industry Volume K Unit Forecast, by Deployment 2020 & 2033
- Table 3: Global Cloud Billing Industry Revenue billion Forecast, by Component 2020 & 2033
- Table 4: Global Cloud Billing Industry Volume K Unit Forecast, by Component 2020 & 2033
- Table 5: Global Cloud Billing Industry Revenue billion Forecast, by End-user Industry 2020 & 2033
- Table 6: Global Cloud Billing Industry Volume K Unit Forecast, by End-user Industry 2020 & 2033
- Table 7: Global Cloud Billing Industry Revenue billion Forecast, by Region 2020 & 2033
- Table 8: Global Cloud Billing Industry Volume K Unit Forecast, by Region 2020 & 2033
- Table 9: Global Cloud Billing Industry Revenue billion Forecast, by Deployment 2020 & 2033
- Table 10: Global Cloud Billing Industry Volume K Unit Forecast, by Deployment 2020 & 2033
- Table 11: Global Cloud Billing Industry Revenue billion Forecast, by Component 2020 & 2033
- Table 12: Global Cloud Billing Industry Volume K Unit Forecast, by Component 2020 & 2033
- Table 13: Global Cloud Billing Industry Revenue billion Forecast, by End-user Industry 2020 & 2033
- Table 14: Global Cloud Billing Industry Volume K Unit Forecast, by End-user Industry 2020 & 2033
- Table 15: Global Cloud Billing Industry Revenue billion Forecast, by Country 2020 & 2033
- Table 16: Global Cloud Billing Industry Volume K Unit Forecast, by Country 2020 & 2033
- Table 17: United States Cloud Billing Industry Revenue (billion) Forecast, by Application 2020 & 2033
- Table 18: United States Cloud Billing Industry Volume (K Unit) Forecast, by Application 2020 & 2033
- Table 19: Canada Cloud Billing Industry Revenue (billion) Forecast, by Application 2020 & 2033
- Table 20: Canada Cloud Billing Industry Volume (K Unit) Forecast, by Application 2020 & 2033
- Table 21: Global Cloud Billing Industry Revenue billion Forecast, by Deployment 2020 & 2033
- Table 22: Global Cloud Billing Industry Volume K Unit Forecast, by Deployment 2020 & 2033
- Table 23: Global Cloud Billing Industry Revenue billion Forecast, by Component 2020 & 2033
- Table 24: Global Cloud Billing Industry Volume K Unit Forecast, by Component 2020 & 2033
- Table 25: Global Cloud Billing Industry Revenue billion Forecast, by End-user Industry 2020 & 2033
- Table 26: Global Cloud Billing Industry Volume K Unit Forecast, by End-user Industry 2020 & 2033
- Table 27: Global Cloud Billing Industry Revenue billion Forecast, by Country 2020 & 2033
- Table 28: Global Cloud Billing Industry Volume K Unit Forecast, by Country 2020 & 2033
- Table 29: United Kingdom Cloud Billing Industry Revenue (billion) Forecast, by Application 2020 & 2033
- Table 30: United Kingdom Cloud Billing Industry Volume (K Unit) Forecast, by Application 2020 & 2033
- Table 31: Germany Cloud Billing Industry Revenue (billion) Forecast, by Application 2020 & 2033
- Table 32: Germany Cloud Billing Industry Volume (K Unit) Forecast, by Application 2020 & 2033
- Table 33: France Cloud Billing Industry Revenue (billion) Forecast, by Application 2020 & 2033
- Table 34: France Cloud Billing Industry Volume (K Unit) Forecast, by Application 2020 & 2033
- Table 35: Rest of Europe Cloud Billing Industry Revenue (billion) Forecast, by Application 2020 & 2033
- Table 36: Rest of Europe Cloud Billing Industry Volume (K Unit) Forecast, by Application 2020 & 2033
- Table 37: Global Cloud Billing Industry Revenue billion Forecast, by Deployment 2020 & 2033
- Table 38: Global Cloud Billing Industry Volume K Unit Forecast, by Deployment 2020 & 2033
- Table 39: Global Cloud Billing Industry Revenue billion Forecast, by Component 2020 & 2033
- Table 40: Global Cloud Billing Industry Volume K Unit Forecast, by Component 2020 & 2033
- Table 41: Global Cloud Billing Industry Revenue billion Forecast, by End-user Industry 2020 & 2033
- Table 42: Global Cloud Billing Industry Volume K Unit Forecast, by End-user Industry 2020 & 2033
- Table 43: Global Cloud Billing Industry Revenue billion Forecast, by Country 2020 & 2033
- Table 44: Global Cloud Billing Industry Volume K Unit Forecast, by Country 2020 & 2033
- Table 45: China Cloud Billing Industry Revenue (billion) Forecast, by Application 2020 & 2033
- Table 46: China Cloud Billing Industry Volume (K Unit) Forecast, by Application 2020 & 2033
- Table 47: India Cloud Billing Industry Revenue (billion) Forecast, by Application 2020 & 2033
- Table 48: India Cloud Billing Industry Volume (K Unit) Forecast, by Application 2020 & 2033
- Table 49: South Korea Cloud Billing Industry Revenue (billion) Forecast, by Application 2020 & 2033
- Table 50: South Korea Cloud Billing Industry Volume (K Unit) Forecast, by Application 2020 & 2033
- Table 51: Rest of Asia Pacific Cloud Billing Industry Revenue (billion) Forecast, by Application 2020 & 2033
- Table 52: Rest of Asia Pacific Cloud Billing Industry Volume (K Unit) Forecast, by Application 2020 & 2033
- Table 53: Global Cloud Billing Industry Revenue billion Forecast, by Deployment 2020 & 2033
- Table 54: Global Cloud Billing Industry Volume K Unit Forecast, by Deployment 2020 & 2033
- Table 55: Global Cloud Billing Industry Revenue billion Forecast, by Component 2020 & 2033
- Table 56: Global Cloud Billing Industry Volume K Unit Forecast, by Component 2020 & 2033
- Table 57: Global Cloud Billing Industry Revenue billion Forecast, by End-user Industry 2020 & 2033
- Table 58: Global Cloud Billing Industry Volume K Unit Forecast, by End-user Industry 2020 & 2033
- Table 59: Global Cloud Billing Industry Revenue billion Forecast, by Country 2020 & 2033
- Table 60: Global Cloud Billing Industry Volume K Unit Forecast, by Country 2020 & 2033
- Table 61: Brazil Cloud Billing Industry Revenue (billion) Forecast, by Application 2020 & 2033
- Table 62: Brazil Cloud Billing Industry Volume (K Unit) Forecast, by Application 2020 & 2033
- Table 63: Mexico Cloud Billing Industry Revenue (billion) Forecast, by Application 2020 & 2033
- Table 64: Mexico Cloud Billing Industry Volume (K Unit) Forecast, by Application 2020 & 2033
- Table 65: Rest of Latin America Cloud Billing Industry Revenue (billion) Forecast, by Application 2020 & 2033
- Table 66: Rest of Latin America Cloud Billing Industry Volume (K Unit) Forecast, by Application 2020 & 2033
- Table 67: Global Cloud Billing Industry Revenue billion Forecast, by Deployment 2020 & 2033
- Table 68: Global Cloud Billing Industry Volume K Unit Forecast, by Deployment 2020 & 2033
- Table 69: Global Cloud Billing Industry Revenue billion Forecast, by Component 2020 & 2033
- Table 70: Global Cloud Billing Industry Volume K Unit Forecast, by Component 2020 & 2033
- Table 71: Global Cloud Billing Industry Revenue billion Forecast, by End-user Industry 2020 & 2033
- Table 72: Global Cloud Billing Industry Volume K Unit Forecast, by End-user Industry 2020 & 2033
- Table 73: Global Cloud Billing Industry Revenue billion Forecast, by Country 2020 & 2033
- Table 74: Global Cloud Billing Industry Volume K Unit Forecast, by Country 2020 & 2033
- Table 75: Global Cloud Billing Industry Revenue billion Forecast, by Deployment 2020 & 2033
- Table 76: Global Cloud Billing Industry Volume K Unit Forecast, by Deployment 2020 & 2033
- Table 77: Global Cloud Billing Industry Revenue billion Forecast, by Component 2020 & 2033
- Table 78: Global Cloud Billing Industry Volume K Unit Forecast, by Component 2020 & 2033
- Table 79: Global Cloud Billing Industry Revenue billion Forecast, by End-user Industry 2020 & 2033
- Table 80: Global Cloud Billing Industry Volume K Unit Forecast, by End-user Industry 2020 & 2033
- Table 81: Global Cloud Billing Industry Revenue billion Forecast, by Country 2020 & 2033
- Table 82: Global Cloud Billing Industry Volume K Unit Forecast, by Country 2020 & 2033
- Table 83: South Africa Cloud Billing Industry Revenue (billion) Forecast, by Application 2020 & 2033
- Table 84: South Africa Cloud Billing Industry Volume (K Unit) Forecast, by Application 2020 & 2033
- Table 85: Saudi Arabia Cloud Billing Industry Revenue (billion) Forecast, by Application 2020 & 2033
- Table 86: Saudi Arabia Cloud Billing Industry Volume (K Unit) Forecast, by Application 2020 & 2033
- Table 87: Rest of Middle East Cloud Billing Industry Revenue (billion) Forecast, by Application 2020 & 2033
- Table 88: Rest of Middle East Cloud Billing Industry Volume (K Unit) Forecast, by Application 2020 & 2033
Frequently Asked Questions
1. What is the projected Compound Annual Growth Rate (CAGR) of the Cloud Billing Industry?
The projected CAGR is approximately 14.4%.
2. Which companies are prominent players in the Cloud Billing Industry?
Key companies in the market include Zuora Inc , ARIA Systems INC, Telefonaktiebolaget LM Ericsson, FinancialForce, Microsoft Corporation, Amazon Web Services Inc, Oracle Corporation, BillingPlatform, Orbitera Inc, SAP SE.
3. What are the main segments of the Cloud Billing Industry?
The market segments include Deployment, Component, End-user Industry.
4. Can you provide details about the market size?
The market size is estimated to be USD 13.87 billion as of 2022.
5. What are some drivers contributing to market growth?
Increasing Adoption of Cloud Computing; Growth in E-commerce Platforms.
6. What are the notable trends driving market growth?
Retail Sector Expected to Show Maximum Application.
7. Are there any restraints impacting market growth?
Transition From On-Premise to Cloud-Based Solutions; High Costs Involved and Data Privacy Issues.
8. Can you provide examples of recent developments in the market?
January 2023: Input 1 is a pioneer in payments, digital billing, and premium financing solutions. HawkSoft, a supplier of insurance technologies for agency management systems, announced a strategic agreement to allow premium collecting capability for HawkSoft agencies. For more than 30 years, Input 1 has improved its comprehensive payments and billing platform, which reduces the complexity of the full lifecycle of premium collecting. Input 1 services are used by more than 125 carriers, financial organizations, managing general agents, and thousands of insurance agents to collect and bill premiums from their clients.
9. What pricing options are available for accessing the report?
Pricing options include single-user, multi-user, and enterprise licenses priced at USD 4750, USD 5250, and USD 8750 respectively.
10. Is the market size provided in terms of value or volume?
The market size is provided in terms of value, measured in billion and volume, measured in K Unit.
11. Are there any specific market keywords associated with the report?
Yes, the market keyword associated with the report is "Cloud Billing Industry," which aids in identifying and referencing the specific market segment covered.
12. How do I determine which pricing option suits my needs best?
The pricing options vary based on user requirements and access needs. Individual users may opt for single-user licenses, while businesses requiring broader access may choose multi-user or enterprise licenses for cost-effective access to the report.
13. Are there any additional resources or data provided in the Cloud Billing Industry report?
While the report offers comprehensive insights, it's advisable to review the specific contents or supplementary materials provided to ascertain if additional resources or data are available.
14. How can I stay updated on further developments or reports in the Cloud Billing Industry?
To stay informed about further developments, trends, and reports in the Cloud Billing Industry, consider subscribing to industry newsletters, following relevant companies and organizations, or regularly checking reputable industry news sources and publications.
Methodology
Step 1 - Identification of Relevant Samples Size from Population Database


Step 2 - Approaches for Defining Global Market Size (Value, Volume* & Price*)

Note*: In applicable scenarios
Step 3 - Data Sources
Primary Research
- Web Analytics
- Survey Reports
- Research Institute
- Latest Research Reports
- Opinion Leaders
Secondary Research
- Annual Reports
- White Paper
- Latest Press Release
- Industry Association
- Paid Database
- Investor Presentations

Step 4 - Data Triangulation
Involves using different sources of information in order to increase the validity of a study
These sources are likely to be stakeholders in a program - participants, other researchers, program staff, other community members, and so on.
Then we put all data in single framework & apply various statistical tools to find out the dynamic on the market.
During the analysis stage, feedback from the stakeholder groups would be compared to determine areas of agreement as well as areas of divergence