

Key Insights
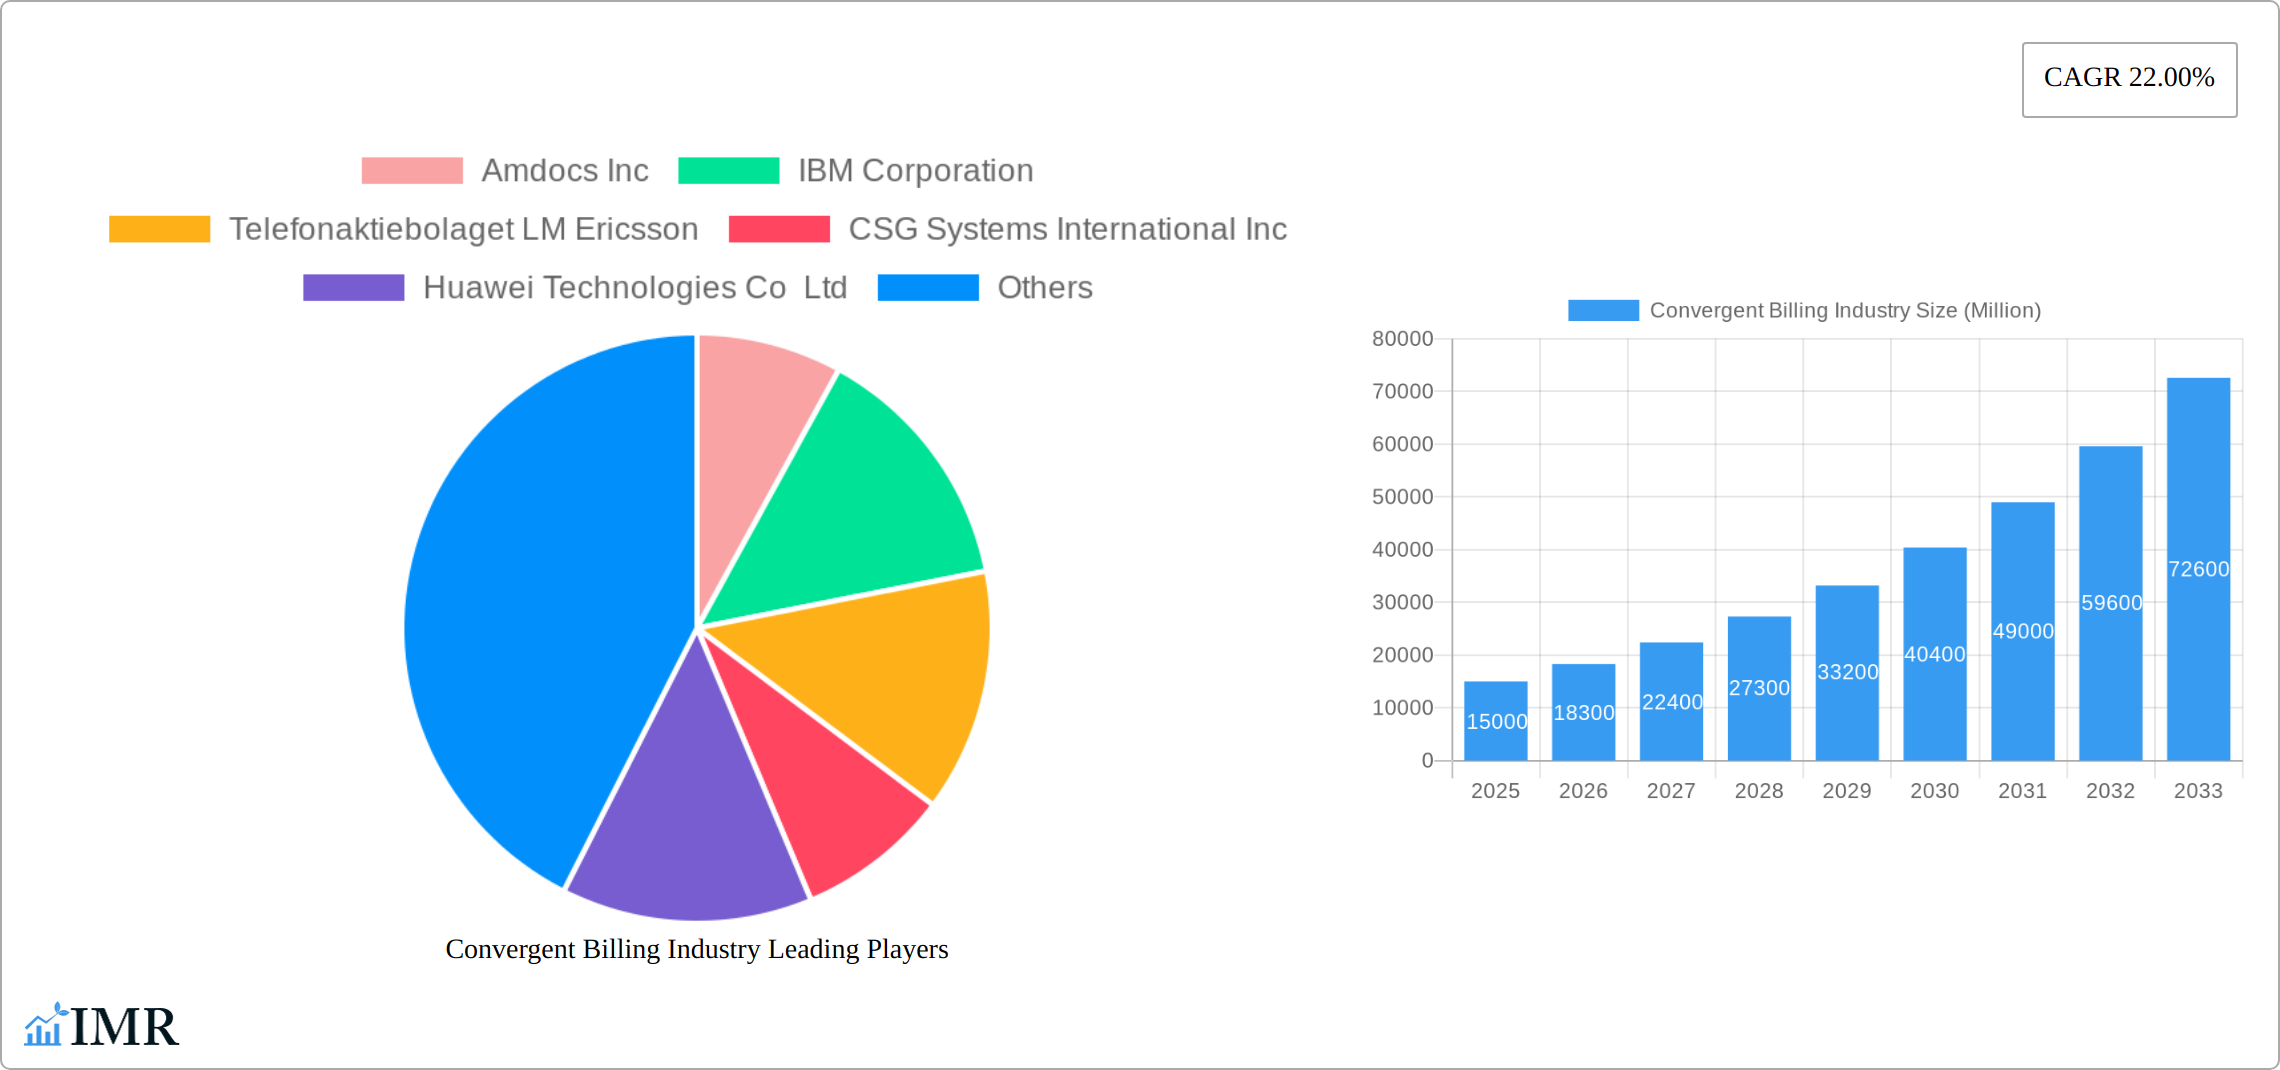
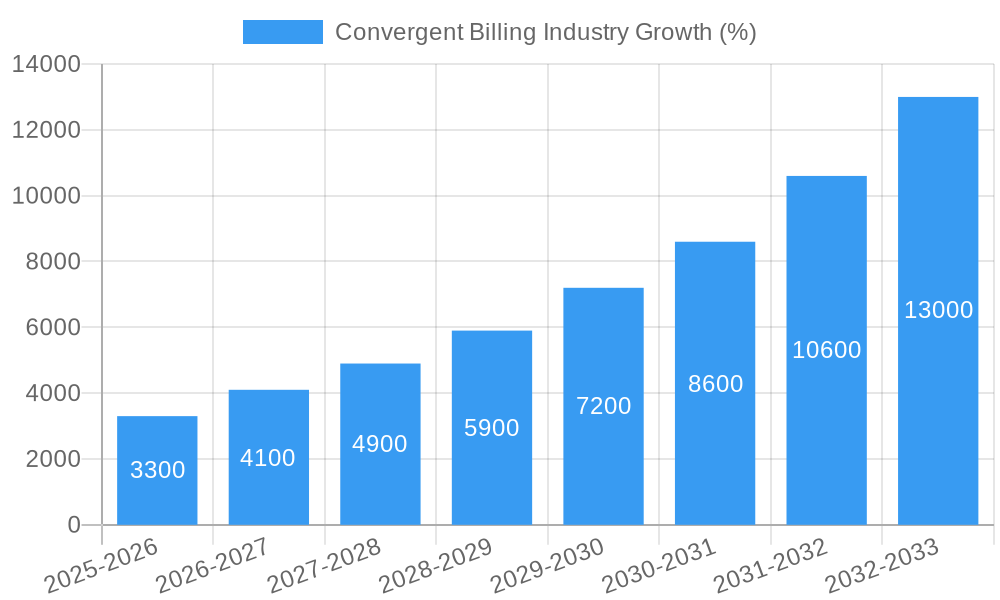
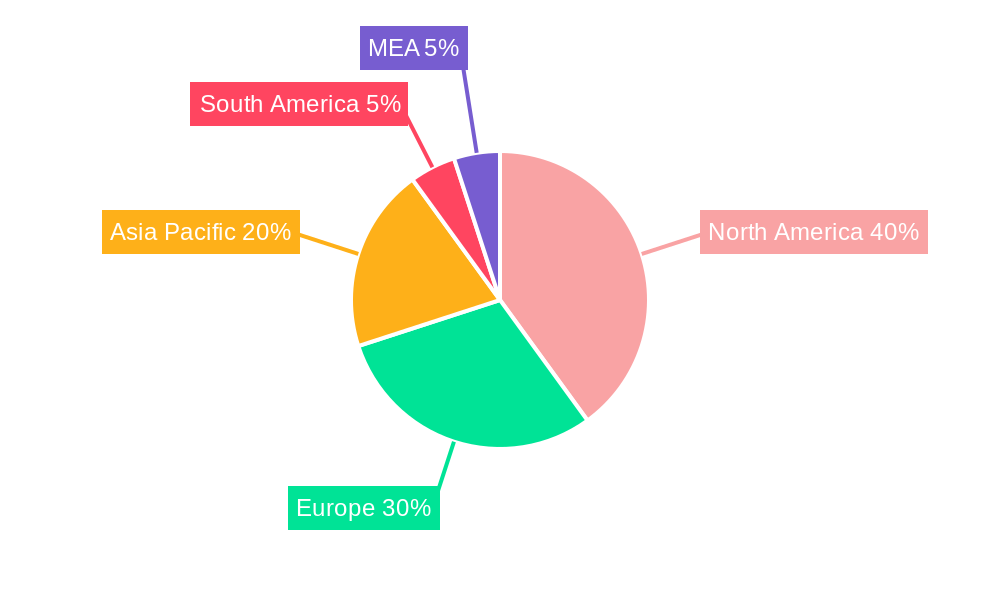
The Convergent Billing market is experiencing robust growth, projected to reach a substantial size within the forecast period (2025-2033). A 22% CAGR indicates significant market expansion driven by several key factors. The increasing adoption of cloud-based solutions simplifies billing processes, reduces infrastructure costs, and enhances scalability for businesses of all sizes. The rising demand for automated invoice and bill generation systems streamlines operations, minimizes errors, and improves efficiency. Furthermore, the integration of advanced analytics with billing systems allows for better customer relationship management (CRM), leading to personalized service and increased customer retention. Companies are increasingly investing in bill cycle optimization solutions to minimize operational expenses and enhance revenue generation. This trend is particularly evident in the North American and European markets, which are expected to retain significant market share, due to their advanced technological infrastructure and high adoption rates of new technologies. However, challenges remain, including the complexities associated with integrating legacy systems and ensuring data security across multiple platforms. Regulatory compliance and the need for robust cybersecurity measures also pose restraints on market growth. The market is segmented by component (solution, services), deployment (on-cloud, on-premise), and solution type (bill cycle optimization, billing account management, automated invoice and bill generation, payment and collection, CRM). Leading players such as Amdocs, IBM, Ericsson, CSG Systems, Huawei, Oracle, Comarch, Nexign, and Formula Telecom are actively shaping the market landscape through strategic partnerships, acquisitions, and technological innovations.
The competitive landscape is characterized by both established players and emerging innovative companies. This dynamic environment fuels continuous improvement in the functionalities and capabilities of convergent billing solutions, fostering broader adoption. The Asia-Pacific region is poised for significant growth, driven by increasing digitization and expanding telecommunications infrastructure. While the North American and European markets currently dominate, the potential for growth in regions like Asia-Pacific and South America presents lucrative opportunities for market participants. Strategic partnerships and mergers & acquisitions are likely to further consolidate the market, leading to the emergence of stronger players in the years to come. The focus on advanced analytics and AI-powered solutions will play a crucial role in defining future growth trajectories.
Convergent Billing Industry Market Report: 2019-2033
This comprehensive report provides an in-depth analysis of the Convergent Billing market, encompassing its dynamics, growth trends, regional performance, and key players. With a focus on the parent market of Telecom Billing and the child market of Convergent Billing, this report offers invaluable insights for industry professionals, investors, and strategic decision-makers. The study period covers 2019-2033, with a base year of 2025 and a forecast period of 2025-2033. The market size is presented in millions of units.
Convergent Billing Industry Market Dynamics & Structure
The Convergent Billing market is characterized by moderate concentration, with key players like Amdocs Inc, IBM Corporation, and Ericsson holding significant market share (Amdocs: xx%, IBM: xx%, Ericsson: xx% - 2025 estimates). Technological innovation, particularly in areas like AI-powered billing and cloud-based solutions, is a major driver. Regulatory frameworks impacting data privacy and security significantly influence market dynamics. The emergence of cloud-based solutions presents a competitive substitute to on-premise systems. The end-user demographic is primarily comprised of telecommunication providers, media companies, and utility providers. M&A activity within the sector has been moderate in recent years, with approximately xx deals closed annually during the historical period (2019-2024).
- Market Concentration: Moderately concentrated, with top 3 players holding xx% combined market share in 2025.
- Technological Innovation: AI, cloud computing, and automation are key drivers.
- Regulatory Landscape: Data privacy and security regulations shape market strategies.
- Competitive Substitutes: Cloud-based solutions pose a challenge to traditional on-premise systems.
- End-User Demographics: Telecom providers, media companies, and utilities are primary users.
- M&A Activity: Approximately xx deals per year (2019-2024).
Convergent Billing Industry Growth Trends & Insights
The global Convergent Billing market exhibited a CAGR of xx% during the historical period (2019-2024), reaching a market size of $xx million in 2024. The market is expected to grow at a CAGR of xx% during the forecast period (2025-2033), reaching $xx million by 2033. This growth is driven by increasing adoption of cloud-based solutions, rising demand for efficient billing processes, and the proliferation of digital services. Market penetration increased from xx% in 2019 to xx% in 2024 and is projected to reach xx% by 2033. Technological disruptions such as 5G deployment and the rise of IoT are further fueling market expansion. Consumer behavior shifts toward digital payment methods and self-service options are also impacting growth.
Dominant Regions, Countries, or Segments in Convergent Billing Industry
North America currently holds the largest market share, driven by early adoption of advanced technologies and a robust telecommunications infrastructure. However, the Asia-Pacific region is expected to exhibit the highest growth rate during the forecast period due to increasing investments in digital infrastructure and rising mobile penetration.
Leading Segment: Cloud-based deployment is the fastest-growing segment, fuelled by scalability and cost-effectiveness. Within solutions, Bill Cycle Optimization and Billing Account Management are witnessing significant traction.
- North America: High market share, driven by technological advancement and infrastructure.
- Asia-Pacific: Fastest growth potential, due to increasing digitalization and mobile penetration.
- Europe: Steady growth, driven by regulatory compliance and digital transformation.
- Leading Segment (Deployment): Cloud-based solutions.
- Leading Segment (Solution): Bill Cycle Optimization and Billing Account Management.
Convergent Billing Industry Product Landscape
Convergent billing solutions are increasingly incorporating AI-powered features for improved accuracy, automation, and fraud detection. These solutions offer real-time billing, enhanced customer self-service capabilities, and integrated payment gateways, optimizing the overall billing process. Key performance indicators include reduced operational costs, improved billing accuracy, and enhanced customer satisfaction. The unique selling proposition lies in the convergence of different billing systems into a unified platform, enhancing efficiency and scalability.
Key Drivers, Barriers & Challenges in Convergent Billing Industry
Key Drivers:
- Increasing demand for efficient and accurate billing systems.
- Growing adoption of cloud-based solutions.
- Rise of digital services and the need for integrated billing platforms.
- Technological advancements in AI and automation.
Challenges & Restraints:
- High initial investment costs for implementing new systems.
- Complexity in integrating legacy systems with new technologies.
- Security concerns related to data privacy and protection.
- Regulatory compliance requirements. (estimated impact: xx% reduction in market growth by 2030)
Emerging Opportunities in Convergent Billing Industry
- Expansion into untapped markets, particularly in developing economies.
- Development of solutions for specific industry verticals (e.g., healthcare, finance).
- Integration of blockchain technology for enhanced security and transparency.
- Personalized billing experiences tailored to individual customer preferences.
Growth Accelerators in the Convergent Billing Industry
Strategic partnerships between technology providers and telecommunication companies are accelerating market growth. Technological advancements in AI and machine learning are improving the efficiency and accuracy of billing processes. Expanding into new geographical markets, particularly in emerging economies, presents significant growth potential.
Key Players Shaping the Convergent Billing Industry Market
- Amdocs Inc
- IBM Corporation
- Telefonaktiebolaget LM Ericsson
- CSG Systems International Inc
- Huawei Technologies Co Ltd
- Oracle Corporation
- Comarch SA
- Nexign JSC
- Formula Telecom Solutions Ltd
Notable Milestones in Convergent Billing Industry Sector
- 2020: Amdocs launched its next-generation convergent billing platform.
- 2022: IBM acquired a smaller convergent billing solutions provider, enhancing its portfolio.
- 2023: Significant industry regulations impacting data privacy are enacted.
- 2024: Major telecommunication company adopts a fully cloud-based billing system.
In-Depth Convergent Billing Industry Market Outlook
The Convergent Billing market is poised for sustained growth, driven by ongoing technological advancements, increasing demand for efficient billing solutions, and expansion into new markets. Strategic partnerships, innovative product development, and effective marketing strategies will be key for companies seeking to capitalize on this market's long-term potential. The market is expected to witness substantial growth, surpassing $xx million by 2033, offering lucrative opportunities for key players and new entrants alike.
Convergent Billing Industry Segmentation
-
1. Component
- 1.1. Solution
- 1.2. Services
-
2. Deployment
- 2.1. On-Cloud
- 2.2. On-Premise
-
3. Solutions
- 3.1. Bill Cycle Optimization
- 3.2. Billing Account Management
- 3.3. Automated Invoice and Bill Generation
- 3.4. Payment and Collection
- 3.5. Customer Relationship Management
Convergent Billing Industry Segmentation By Geography
- 1. North America
- 2. Europe
- 3. Asia Pacific
- 4. Latin America
- 5. Middle East and Africa
Convergent Billing Industry REPORT HIGHLIGHTS
| Aspects | Details |
|---|---|
| Study Period | 2019-2033 |
| Base Year | 2024 |
| Estimated Year | 2025 |
| Forecast Period | 2025-2033 |
| Historical Period | 2019-2024 |
| Growth Rate | CAGR of 22.00% from 2019-2033 |
| Segmentation |
|
Table of Contents
- 1. Introduction
- 1.1. Research Scope
- 1.2. Market Segmentation
- 1.3. Research Methodology
- 1.4. Definitions and Assumptions
- 2. Executive Summary
- 2.1. Introduction
- 3. Market Dynamics
- 3.1. Introduction
- 3.2. Market Drivers
- 3.2.1. ; Digitization of the Telecom Sector; Increasing Complexity of New Service Architecture and Increasing Demand for Unified Services; Increasing Focus on Customer Satisfaction
- 3.3. Market Restrains
- 3.3.1. ; The Inclination Towards Traditional Billing Systems
- 3.4. Market Trends
- 3.4.1. Cloud-Based Deployment is Expected to Spur Growth
- 4. Market Factor Analysis
- 4.1. Porters Five Forces
- 4.2. Supply/Value Chain
- 4.3. PESTEL analysis
- 4.4. Market Entropy
- 4.5. Patent/Trademark Analysis
- 5. Global Convergent Billing Industry Analysis, Insights and Forecast, 2019-2031
- 5.1. Market Analysis, Insights and Forecast - by Component
- 5.1.1. Solution
- 5.1.2. Services
- 5.2. Market Analysis, Insights and Forecast - by Deployment
- 5.2.1. On-Cloud
- 5.2.2. On-Premise
- 5.3. Market Analysis, Insights and Forecast - by Solutions
- 5.3.1. Bill Cycle Optimization
- 5.3.2. Billing Account Management
- 5.3.3. Automated Invoice and Bill Generation
- 5.3.4. Payment and Collection
- 5.3.5. Customer Relationship Management
- 5.4. Market Analysis, Insights and Forecast - by Region
- 5.4.1. North America
- 5.4.2. Europe
- 5.4.3. Asia Pacific
- 5.4.4. Latin America
- 5.4.5. Middle East and Africa
- 5.1. Market Analysis, Insights and Forecast - by Component
- 6. North America Convergent Billing Industry Analysis, Insights and Forecast, 2019-2031
- 6.1. Market Analysis, Insights and Forecast - by Component
- 6.1.1. Solution
- 6.1.2. Services
- 6.2. Market Analysis, Insights and Forecast - by Deployment
- 6.2.1. On-Cloud
- 6.2.2. On-Premise
- 6.3. Market Analysis, Insights and Forecast - by Solutions
- 6.3.1. Bill Cycle Optimization
- 6.3.2. Billing Account Management
- 6.3.3. Automated Invoice and Bill Generation
- 6.3.4. Payment and Collection
- 6.3.5. Customer Relationship Management
- 6.1. Market Analysis, Insights and Forecast - by Component
- 7. Europe Convergent Billing Industry Analysis, Insights and Forecast, 2019-2031
- 7.1. Market Analysis, Insights and Forecast - by Component
- 7.1.1. Solution
- 7.1.2. Services
- 7.2. Market Analysis, Insights and Forecast - by Deployment
- 7.2.1. On-Cloud
- 7.2.2. On-Premise
- 7.3. Market Analysis, Insights and Forecast - by Solutions
- 7.3.1. Bill Cycle Optimization
- 7.3.2. Billing Account Management
- 7.3.3. Automated Invoice and Bill Generation
- 7.3.4. Payment and Collection
- 7.3.5. Customer Relationship Management
- 7.1. Market Analysis, Insights and Forecast - by Component
- 8. Asia Pacific Convergent Billing Industry Analysis, Insights and Forecast, 2019-2031
- 8.1. Market Analysis, Insights and Forecast - by Component
- 8.1.1. Solution
- 8.1.2. Services
- 8.2. Market Analysis, Insights and Forecast - by Deployment
- 8.2.1. On-Cloud
- 8.2.2. On-Premise
- 8.3. Market Analysis, Insights and Forecast - by Solutions
- 8.3.1. Bill Cycle Optimization
- 8.3.2. Billing Account Management
- 8.3.3. Automated Invoice and Bill Generation
- 8.3.4. Payment and Collection
- 8.3.5. Customer Relationship Management
- 8.1. Market Analysis, Insights and Forecast - by Component
- 9. Latin America Convergent Billing Industry Analysis, Insights and Forecast, 2019-2031
- 9.1. Market Analysis, Insights and Forecast - by Component
- 9.1.1. Solution
- 9.1.2. Services
- 9.2. Market Analysis, Insights and Forecast - by Deployment
- 9.2.1. On-Cloud
- 9.2.2. On-Premise
- 9.3. Market Analysis, Insights and Forecast - by Solutions
- 9.3.1. Bill Cycle Optimization
- 9.3.2. Billing Account Management
- 9.3.3. Automated Invoice and Bill Generation
- 9.3.4. Payment and Collection
- 9.3.5. Customer Relationship Management
- 9.1. Market Analysis, Insights and Forecast - by Component
- 10. Middle East and Africa Convergent Billing Industry Analysis, Insights and Forecast, 2019-2031
- 10.1. Market Analysis, Insights and Forecast - by Component
- 10.1.1. Solution
- 10.1.2. Services
- 10.2. Market Analysis, Insights and Forecast - by Deployment
- 10.2.1. On-Cloud
- 10.2.2. On-Premise
- 10.3. Market Analysis, Insights and Forecast - by Solutions
- 10.3.1. Bill Cycle Optimization
- 10.3.2. Billing Account Management
- 10.3.3. Automated Invoice and Bill Generation
- 10.3.4. Payment and Collection
- 10.3.5. Customer Relationship Management
- 10.1. Market Analysis, Insights and Forecast - by Component
- 11. North America Convergent Billing Industry Analysis, Insights and Forecast, 2019-2031
- 11.1. Market Analysis, Insights and Forecast - By Country/Sub-region
- 11.1.1 United States
- 11.1.2 Canada
- 11.1.3 Mexico
- 12. Europe Convergent Billing Industry Analysis, Insights and Forecast, 2019-2031
- 12.1. Market Analysis, Insights and Forecast - By Country/Sub-region
- 12.1.1 Germany
- 12.1.2 United Kingdom
- 12.1.3 France
- 12.1.4 Spain
- 12.1.5 Italy
- 12.1.6 Spain
- 12.1.7 Belgium
- 12.1.8 Netherland
- 12.1.9 Nordics
- 12.1.10 Rest of Europe
- 13. Asia Pacific Convergent Billing Industry Analysis, Insights and Forecast, 2019-2031
- 13.1. Market Analysis, Insights and Forecast - By Country/Sub-region
- 13.1.1 China
- 13.1.2 Japan
- 13.1.3 India
- 13.1.4 South Korea
- 13.1.5 Southeast Asia
- 13.1.6 Australia
- 13.1.7 Indonesia
- 13.1.8 Phillipes
- 13.1.9 Singapore
- 13.1.10 Thailandc
- 13.1.11 Rest of Asia Pacific
- 14. South America Convergent Billing Industry Analysis, Insights and Forecast, 2019-2031
- 14.1. Market Analysis, Insights and Forecast - By Country/Sub-region
- 14.1.1 Brazil
- 14.1.2 Argentina
- 14.1.3 Peru
- 14.1.4 Chile
- 14.1.5 Colombia
- 14.1.6 Ecuador
- 14.1.7 Venezuela
- 14.1.8 Rest of South America
- 15. North America Convergent Billing Industry Analysis, Insights and Forecast, 2019-2031
- 15.1. Market Analysis, Insights and Forecast - By Country/Sub-region
- 15.1.1 United States
- 15.1.2 Canada
- 15.1.3 Mexico
- 16. MEA Convergent Billing Industry Analysis, Insights and Forecast, 2019-2031
- 16.1. Market Analysis, Insights and Forecast - By Country/Sub-region
- 16.1.1 United Arab Emirates
- 16.1.2 Saudi Arabia
- 16.1.3 South Africa
- 16.1.4 Rest of Middle East and Africa
- 17. Competitive Analysis
- 17.1. Global Market Share Analysis 2024
- 17.2. Company Profiles
- 17.2.1 Amdocs Inc
- 17.2.1.1. Overview
- 17.2.1.2. Products
- 17.2.1.3. SWOT Analysis
- 17.2.1.4. Recent Developments
- 17.2.1.5. Financials (Based on Availability)
- 17.2.2 IBM Corporation
- 17.2.2.1. Overview
- 17.2.2.2. Products
- 17.2.2.3. SWOT Analysis
- 17.2.2.4. Recent Developments
- 17.2.2.5. Financials (Based on Availability)
- 17.2.3 Telefonaktiebolaget LM Ericsson
- 17.2.3.1. Overview
- 17.2.3.2. Products
- 17.2.3.3. SWOT Analysis
- 17.2.3.4. Recent Developments
- 17.2.3.5. Financials (Based on Availability)
- 17.2.4 CSG Systems International Inc
- 17.2.4.1. Overview
- 17.2.4.2. Products
- 17.2.4.3. SWOT Analysis
- 17.2.4.4. Recent Developments
- 17.2.4.5. Financials (Based on Availability)
- 17.2.5 Huawei Technologies Co Ltd
- 17.2.5.1. Overview
- 17.2.5.2. Products
- 17.2.5.3. SWOT Analysis
- 17.2.5.4. Recent Developments
- 17.2.5.5. Financials (Based on Availability)
- 17.2.6 Oracle Corporation
- 17.2.6.1. Overview
- 17.2.6.2. Products
- 17.2.6.3. SWOT Analysis
- 17.2.6.4. Recent Developments
- 17.2.6.5. Financials (Based on Availability)
- 17.2.7 Comarch SA
- 17.2.7.1. Overview
- 17.2.7.2. Products
- 17.2.7.3. SWOT Analysis
- 17.2.7.4. Recent Developments
- 17.2.7.5. Financials (Based on Availability)
- 17.2.8 Nexign JSC
- 17.2.8.1. Overview
- 17.2.8.2. Products
- 17.2.8.3. SWOT Analysis
- 17.2.8.4. Recent Developments
- 17.2.8.5. Financials (Based on Availability)
- 17.2.9 Formula Telecom Solutions Ltd
- 17.2.9.1. Overview
- 17.2.9.2. Products
- 17.2.9.3. SWOT Analysis
- 17.2.9.4. Recent Developments
- 17.2.9.5. Financials (Based on Availability)
- 17.2.1 Amdocs Inc
List of Figures
- Figure 1: Global Convergent Billing Industry Revenue Breakdown (Million, %) by Region 2024 & 2032
- Figure 2: North America Convergent Billing Industry Revenue (Million), by Country 2024 & 2032
- Figure 3: North America Convergent Billing Industry Revenue Share (%), by Country 2024 & 2032
- Figure 4: Europe Convergent Billing Industry Revenue (Million), by Country 2024 & 2032
- Figure 5: Europe Convergent Billing Industry Revenue Share (%), by Country 2024 & 2032
- Figure 6: Asia Pacific Convergent Billing Industry Revenue (Million), by Country 2024 & 2032
- Figure 7: Asia Pacific Convergent Billing Industry Revenue Share (%), by Country 2024 & 2032
- Figure 8: South America Convergent Billing Industry Revenue (Million), by Country 2024 & 2032
- Figure 9: South America Convergent Billing Industry Revenue Share (%), by Country 2024 & 2032
- Figure 10: North America Convergent Billing Industry Revenue (Million), by Country 2024 & 2032
- Figure 11: North America Convergent Billing Industry Revenue Share (%), by Country 2024 & 2032
- Figure 12: MEA Convergent Billing Industry Revenue (Million), by Country 2024 & 2032
- Figure 13: MEA Convergent Billing Industry Revenue Share (%), by Country 2024 & 2032
- Figure 14: North America Convergent Billing Industry Revenue (Million), by Component 2024 & 2032
- Figure 15: North America Convergent Billing Industry Revenue Share (%), by Component 2024 & 2032
- Figure 16: North America Convergent Billing Industry Revenue (Million), by Deployment 2024 & 2032
- Figure 17: North America Convergent Billing Industry Revenue Share (%), by Deployment 2024 & 2032
- Figure 18: North America Convergent Billing Industry Revenue (Million), by Solutions 2024 & 2032
- Figure 19: North America Convergent Billing Industry Revenue Share (%), by Solutions 2024 & 2032
- Figure 20: North America Convergent Billing Industry Revenue (Million), by Country 2024 & 2032
- Figure 21: North America Convergent Billing Industry Revenue Share (%), by Country 2024 & 2032
- Figure 22: Europe Convergent Billing Industry Revenue (Million), by Component 2024 & 2032
- Figure 23: Europe Convergent Billing Industry Revenue Share (%), by Component 2024 & 2032
- Figure 24: Europe Convergent Billing Industry Revenue (Million), by Deployment 2024 & 2032
- Figure 25: Europe Convergent Billing Industry Revenue Share (%), by Deployment 2024 & 2032
- Figure 26: Europe Convergent Billing Industry Revenue (Million), by Solutions 2024 & 2032
- Figure 27: Europe Convergent Billing Industry Revenue Share (%), by Solutions 2024 & 2032
- Figure 28: Europe Convergent Billing Industry Revenue (Million), by Country 2024 & 2032
- Figure 29: Europe Convergent Billing Industry Revenue Share (%), by Country 2024 & 2032
- Figure 30: Asia Pacific Convergent Billing Industry Revenue (Million), by Component 2024 & 2032
- Figure 31: Asia Pacific Convergent Billing Industry Revenue Share (%), by Component 2024 & 2032
- Figure 32: Asia Pacific Convergent Billing Industry Revenue (Million), by Deployment 2024 & 2032
- Figure 33: Asia Pacific Convergent Billing Industry Revenue Share (%), by Deployment 2024 & 2032
- Figure 34: Asia Pacific Convergent Billing Industry Revenue (Million), by Solutions 2024 & 2032
- Figure 35: Asia Pacific Convergent Billing Industry Revenue Share (%), by Solutions 2024 & 2032
- Figure 36: Asia Pacific Convergent Billing Industry Revenue (Million), by Country 2024 & 2032
- Figure 37: Asia Pacific Convergent Billing Industry Revenue Share (%), by Country 2024 & 2032
- Figure 38: Latin America Convergent Billing Industry Revenue (Million), by Component 2024 & 2032
- Figure 39: Latin America Convergent Billing Industry Revenue Share (%), by Component 2024 & 2032
- Figure 40: Latin America Convergent Billing Industry Revenue (Million), by Deployment 2024 & 2032
- Figure 41: Latin America Convergent Billing Industry Revenue Share (%), by Deployment 2024 & 2032
- Figure 42: Latin America Convergent Billing Industry Revenue (Million), by Solutions 2024 & 2032
- Figure 43: Latin America Convergent Billing Industry Revenue Share (%), by Solutions 2024 & 2032
- Figure 44: Latin America Convergent Billing Industry Revenue (Million), by Country 2024 & 2032
- Figure 45: Latin America Convergent Billing Industry Revenue Share (%), by Country 2024 & 2032
- Figure 46: Middle East and Africa Convergent Billing Industry Revenue (Million), by Component 2024 & 2032
- Figure 47: Middle East and Africa Convergent Billing Industry Revenue Share (%), by Component 2024 & 2032
- Figure 48: Middle East and Africa Convergent Billing Industry Revenue (Million), by Deployment 2024 & 2032
- Figure 49: Middle East and Africa Convergent Billing Industry Revenue Share (%), by Deployment 2024 & 2032
- Figure 50: Middle East and Africa Convergent Billing Industry Revenue (Million), by Solutions 2024 & 2032
- Figure 51: Middle East and Africa Convergent Billing Industry Revenue Share (%), by Solutions 2024 & 2032
- Figure 52: Middle East and Africa Convergent Billing Industry Revenue (Million), by Country 2024 & 2032
- Figure 53: Middle East and Africa Convergent Billing Industry Revenue Share (%), by Country 2024 & 2032
List of Tables
- Table 1: Global Convergent Billing Industry Revenue Million Forecast, by Region 2019 & 2032
- Table 2: Global Convergent Billing Industry Revenue Million Forecast, by Component 2019 & 2032
- Table 3: Global Convergent Billing Industry Revenue Million Forecast, by Deployment 2019 & 2032
- Table 4: Global Convergent Billing Industry Revenue Million Forecast, by Solutions 2019 & 2032
- Table 5: Global Convergent Billing Industry Revenue Million Forecast, by Region 2019 & 2032
- Table 6: Global Convergent Billing Industry Revenue Million Forecast, by Country 2019 & 2032
- Table 7: United States Convergent Billing Industry Revenue (Million) Forecast, by Application 2019 & 2032
- Table 8: Canada Convergent Billing Industry Revenue (Million) Forecast, by Application 2019 & 2032
- Table 9: Mexico Convergent Billing Industry Revenue (Million) Forecast, by Application 2019 & 2032
- Table 10: Global Convergent Billing Industry Revenue Million Forecast, by Country 2019 & 2032
- Table 11: Germany Convergent Billing Industry Revenue (Million) Forecast, by Application 2019 & 2032
- Table 12: United Kingdom Convergent Billing Industry Revenue (Million) Forecast, by Application 2019 & 2032
- Table 13: France Convergent Billing Industry Revenue (Million) Forecast, by Application 2019 & 2032
- Table 14: Spain Convergent Billing Industry Revenue (Million) Forecast, by Application 2019 & 2032
- Table 15: Italy Convergent Billing Industry Revenue (Million) Forecast, by Application 2019 & 2032
- Table 16: Spain Convergent Billing Industry Revenue (Million) Forecast, by Application 2019 & 2032
- Table 17: Belgium Convergent Billing Industry Revenue (Million) Forecast, by Application 2019 & 2032
- Table 18: Netherland Convergent Billing Industry Revenue (Million) Forecast, by Application 2019 & 2032
- Table 19: Nordics Convergent Billing Industry Revenue (Million) Forecast, by Application 2019 & 2032
- Table 20: Rest of Europe Convergent Billing Industry Revenue (Million) Forecast, by Application 2019 & 2032
- Table 21: Global Convergent Billing Industry Revenue Million Forecast, by Country 2019 & 2032
- Table 22: China Convergent Billing Industry Revenue (Million) Forecast, by Application 2019 & 2032
- Table 23: Japan Convergent Billing Industry Revenue (Million) Forecast, by Application 2019 & 2032
- Table 24: India Convergent Billing Industry Revenue (Million) Forecast, by Application 2019 & 2032
- Table 25: South Korea Convergent Billing Industry Revenue (Million) Forecast, by Application 2019 & 2032
- Table 26: Southeast Asia Convergent Billing Industry Revenue (Million) Forecast, by Application 2019 & 2032
- Table 27: Australia Convergent Billing Industry Revenue (Million) Forecast, by Application 2019 & 2032
- Table 28: Indonesia Convergent Billing Industry Revenue (Million) Forecast, by Application 2019 & 2032
- Table 29: Phillipes Convergent Billing Industry Revenue (Million) Forecast, by Application 2019 & 2032
- Table 30: Singapore Convergent Billing Industry Revenue (Million) Forecast, by Application 2019 & 2032
- Table 31: Thailandc Convergent Billing Industry Revenue (Million) Forecast, by Application 2019 & 2032
- Table 32: Rest of Asia Pacific Convergent Billing Industry Revenue (Million) Forecast, by Application 2019 & 2032
- Table 33: Global Convergent Billing Industry Revenue Million Forecast, by Country 2019 & 2032
- Table 34: Brazil Convergent Billing Industry Revenue (Million) Forecast, by Application 2019 & 2032
- Table 35: Argentina Convergent Billing Industry Revenue (Million) Forecast, by Application 2019 & 2032
- Table 36: Peru Convergent Billing Industry Revenue (Million) Forecast, by Application 2019 & 2032
- Table 37: Chile Convergent Billing Industry Revenue (Million) Forecast, by Application 2019 & 2032
- Table 38: Colombia Convergent Billing Industry Revenue (Million) Forecast, by Application 2019 & 2032
- Table 39: Ecuador Convergent Billing Industry Revenue (Million) Forecast, by Application 2019 & 2032
- Table 40: Venezuela Convergent Billing Industry Revenue (Million) Forecast, by Application 2019 & 2032
- Table 41: Rest of South America Convergent Billing Industry Revenue (Million) Forecast, by Application 2019 & 2032
- Table 42: Global Convergent Billing Industry Revenue Million Forecast, by Country 2019 & 2032
- Table 43: United States Convergent Billing Industry Revenue (Million) Forecast, by Application 2019 & 2032
- Table 44: Canada Convergent Billing Industry Revenue (Million) Forecast, by Application 2019 & 2032
- Table 45: Mexico Convergent Billing Industry Revenue (Million) Forecast, by Application 2019 & 2032
- Table 46: Global Convergent Billing Industry Revenue Million Forecast, by Country 2019 & 2032
- Table 47: United Arab Emirates Convergent Billing Industry Revenue (Million) Forecast, by Application 2019 & 2032
- Table 48: Saudi Arabia Convergent Billing Industry Revenue (Million) Forecast, by Application 2019 & 2032
- Table 49: South Africa Convergent Billing Industry Revenue (Million) Forecast, by Application 2019 & 2032
- Table 50: Rest of Middle East and Africa Convergent Billing Industry Revenue (Million) Forecast, by Application 2019 & 2032
- Table 51: Global Convergent Billing Industry Revenue Million Forecast, by Component 2019 & 2032
- Table 52: Global Convergent Billing Industry Revenue Million Forecast, by Deployment 2019 & 2032
- Table 53: Global Convergent Billing Industry Revenue Million Forecast, by Solutions 2019 & 2032
- Table 54: Global Convergent Billing Industry Revenue Million Forecast, by Country 2019 & 2032
- Table 55: Global Convergent Billing Industry Revenue Million Forecast, by Component 2019 & 2032
- Table 56: Global Convergent Billing Industry Revenue Million Forecast, by Deployment 2019 & 2032
- Table 57: Global Convergent Billing Industry Revenue Million Forecast, by Solutions 2019 & 2032
- Table 58: Global Convergent Billing Industry Revenue Million Forecast, by Country 2019 & 2032
- Table 59: Global Convergent Billing Industry Revenue Million Forecast, by Component 2019 & 2032
- Table 60: Global Convergent Billing Industry Revenue Million Forecast, by Deployment 2019 & 2032
- Table 61: Global Convergent Billing Industry Revenue Million Forecast, by Solutions 2019 & 2032
- Table 62: Global Convergent Billing Industry Revenue Million Forecast, by Country 2019 & 2032
- Table 63: Global Convergent Billing Industry Revenue Million Forecast, by Component 2019 & 2032
- Table 64: Global Convergent Billing Industry Revenue Million Forecast, by Deployment 2019 & 2032
- Table 65: Global Convergent Billing Industry Revenue Million Forecast, by Solutions 2019 & 2032
- Table 66: Global Convergent Billing Industry Revenue Million Forecast, by Country 2019 & 2032
- Table 67: Global Convergent Billing Industry Revenue Million Forecast, by Component 2019 & 2032
- Table 68: Global Convergent Billing Industry Revenue Million Forecast, by Deployment 2019 & 2032
- Table 69: Global Convergent Billing Industry Revenue Million Forecast, by Solutions 2019 & 2032
- Table 70: Global Convergent Billing Industry Revenue Million Forecast, by Country 2019 & 2032
Frequently Asked Questions
1. What is the projected Compound Annual Growth Rate (CAGR) of the Convergent Billing Industry?
The projected CAGR is approximately 22.00%.
2. Which companies are prominent players in the Convergent Billing Industry?
Key companies in the market include Amdocs Inc, IBM Corporation, Telefonaktiebolaget LM Ericsson, CSG Systems International Inc, Huawei Technologies Co Ltd, Oracle Corporation, Comarch SA, Nexign JSC, Formula Telecom Solutions Ltd.
3. What are the main segments of the Convergent Billing Industry?
The market segments include Component, Deployment, Solutions.
4. Can you provide details about the market size?
The market size is estimated to be USD XX Million as of 2022.
5. What are some drivers contributing to market growth?
; Digitization of the Telecom Sector; Increasing Complexity of New Service Architecture and Increasing Demand for Unified Services; Increasing Focus on Customer Satisfaction.
6. What are the notable trends driving market growth?
Cloud-Based Deployment is Expected to Spur Growth.
7. Are there any restraints impacting market growth?
; The Inclination Towards Traditional Billing Systems.
8. Can you provide examples of recent developments in the market?
N/A
9. What pricing options are available for accessing the report?
Pricing options include single-user, multi-user, and enterprise licenses priced at USD 4750, USD 5250, and USD 8750 respectively.
10. Is the market size provided in terms of value or volume?
The market size is provided in terms of value, measured in Million.
11. Are there any specific market keywords associated with the report?
Yes, the market keyword associated with the report is "Convergent Billing Industry," which aids in identifying and referencing the specific market segment covered.
12. How do I determine which pricing option suits my needs best?
The pricing options vary based on user requirements and access needs. Individual users may opt for single-user licenses, while businesses requiring broader access may choose multi-user or enterprise licenses for cost-effective access to the report.
13. Are there any additional resources or data provided in the Convergent Billing Industry report?
While the report offers comprehensive insights, it's advisable to review the specific contents or supplementary materials provided to ascertain if additional resources or data are available.
14. How can I stay updated on further developments or reports in the Convergent Billing Industry?
To stay informed about further developments, trends, and reports in the Convergent Billing Industry, consider subscribing to industry newsletters, following relevant companies and organizations, or regularly checking reputable industry news sources and publications.
Methodology
Step 1 - Identification of Relevant Samples Size from Population Database


Step 2 - Approaches for Defining Global Market Size (Value, Volume* & Price*)

Note*: In applicable scenarios
Step 3 - Data Sources
Primary Research
- Web Analytics
- Survey Reports
- Research Institute
- Latest Research Reports
- Opinion Leaders
Secondary Research
- Annual Reports
- White Paper
- Latest Press Release
- Industry Association
- Paid Database
- Investor Presentations

Step 4 - Data Triangulation
Involves using different sources of information in order to increase the validity of a study
These sources are likely to be stakeholders in a program - participants, other researchers, program staff, other community members, and so on.
Then we put all data in single framework & apply various statistical tools to find out the dynamic on the market.
During the analysis stage, feedback from the stakeholder groups would be compared to determine areas of agreement as well as areas of divergence
