

Key Insights
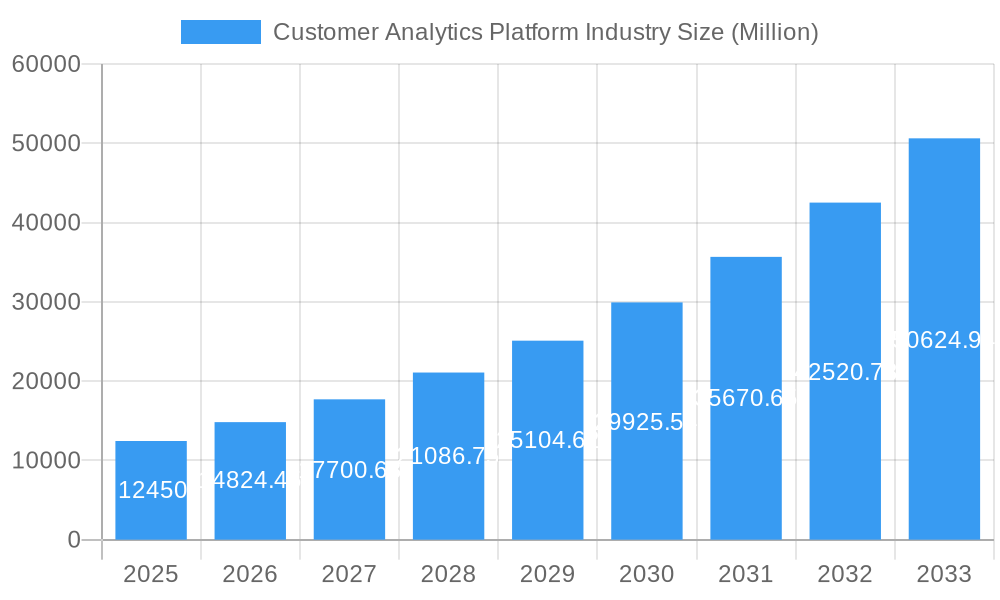
The Customer Analytics Platform (CAP) market is experiencing robust growth, projected to reach a value of $12.45 billion in 2025, with a Compound Annual Growth Rate (CAGR) of 19.01% from 2025 to 2033. This expansion is driven by several key factors. Firstly, the increasing need for businesses across all sectors – from telecommunications and IT to retail, BFSI, and healthcare – to understand customer behavior, preferences, and needs is fueling demand for sophisticated analytical tools. Secondly, the rise of big data and advancements in artificial intelligence (AI) and machine learning (ML) are empowering CAPs with enhanced capabilities for predictive analytics, personalized marketing, and improved customer relationship management (CRM). The shift towards cloud-based deployments offers scalability, cost-effectiveness, and accessibility, further boosting market growth. Finally, the growing adoption of social media analytics and voice-of-customer (VOC) tools provides valuable insights for businesses to tailor their strategies and enhance customer experience.
Customer Analytics Platform Industry Market Size (In Billion)
While the market shows significant promise, certain restraints are present. Data security and privacy concerns are paramount, demanding robust solutions to protect sensitive customer information. The complexity of implementing and integrating CAPs into existing IT infrastructures can present challenges, especially for smaller businesses. Furthermore, the need for skilled professionals to manage and interpret the vast amounts of data generated requires investment in training and development. Despite these challenges, the continued expansion of e-commerce, the growing importance of data-driven decision-making, and the increasing adoption of advanced analytics techniques across various industries are expected to overcome these hurdles, ensuring the long-term growth and evolution of the CAP market. The diverse range of solutions, including social media analytics tools, web analytics tools, and dashboard and reporting tools, caters to a broad spectrum of business needs, contributing to the market's sustained expansion.
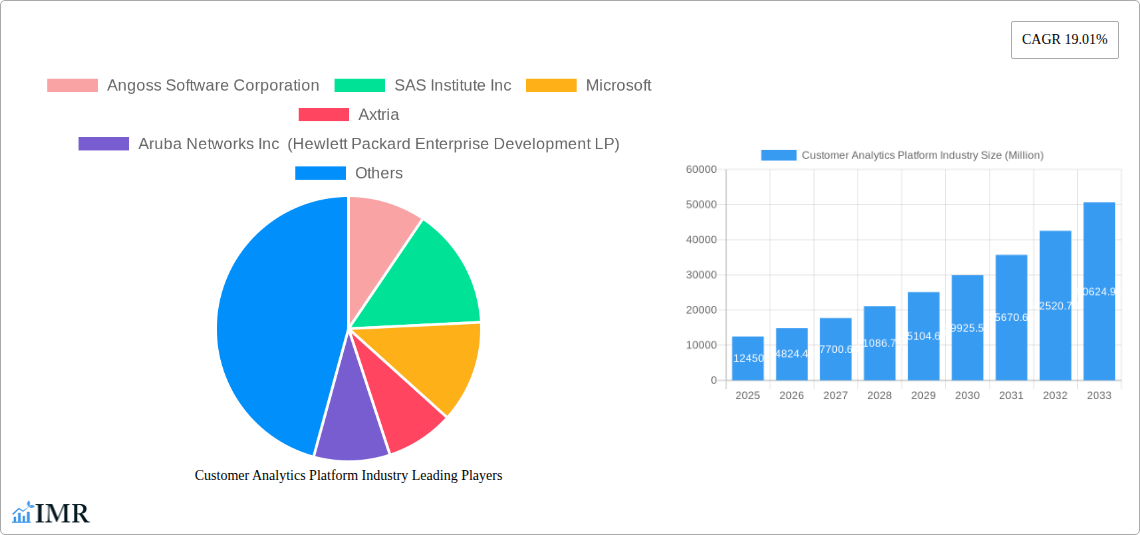
Customer Analytics Platform Industry Company Market Share
This comprehensive report provides a detailed analysis of the Customer Analytics Platform market, encompassing market size, growth trends, key players, and future outlook. The study period spans from 2019 to 2033, with 2025 serving as the base and estimated year. This report is crucial for businesses, investors, and analysts seeking to understand and capitalize on the opportunities within this rapidly evolving sector. The report delves into parent and child market segments, providing granular insights for strategic decision-making.
Customer Analytics Platform Industry Market Dynamics & Structure
The Customer Analytics Platform market, valued at xx Million in 2025, is characterized by a moderately concentrated landscape with key players holding significant market share. Technological innovation, particularly in AI and machine learning, is a primary growth driver, enabling more sophisticated customer insights and predictive analytics. Regulatory frameworks, such as data privacy regulations (GDPR, CCPA), significantly influence market dynamics, pushing for enhanced data security and transparency. The market experiences competition from substitute solutions, such as traditional business intelligence tools, however, the increasing demand for real-time insights and personalized customer experiences favors the adoption of advanced customer analytics platforms. End-user demographics are diverse, spanning various industries with varying levels of digital maturity. The historical period (2019-2024) witnessed a significant number of mergers and acquisitions (M&A), consolidating market share and accelerating innovation.
- Market Concentration: Moderately concentrated, with top 5 players holding approximately xx% market share in 2025.
- Technological Innovation: AI, machine learning, and big data analytics are key innovation drivers.
- Regulatory Framework: GDPR, CCPA, and similar regulations impact data handling and security.
- Competitive Substitutes: Traditional BI tools and reporting software.
- M&A Activity: xx M&A deals recorded between 2019-2024, with an estimated xx Million in total deal value.
- Innovation Barriers: High initial investment costs, data integration complexities, and skilled talent scarcity.
Customer Analytics Platform Industry Growth Trends & Insights
The Customer Analytics Platform market exhibits robust growth, driven by the increasing adoption of cloud-based solutions, the expanding need for personalized customer experiences, and the growing volume of customer data. The market size is projected to reach xx Million by 2033, registering a Compound Annual Growth Rate (CAGR) of xx% during the forecast period (2025-2033). Market penetration is expected to increase significantly, particularly in emerging economies. Technological disruptions, such as the rise of real-time analytics and the integration of IoT data, are reshaping the market landscape. Consumer behavior shifts, with increasing expectations for personalized interactions and seamless omnichannel experiences, further fuel market growth. The historical period saw a significant shift towards cloud-based deployments.
Dominant Regions, Countries, or Segments in Customer Analytics Platform Industry
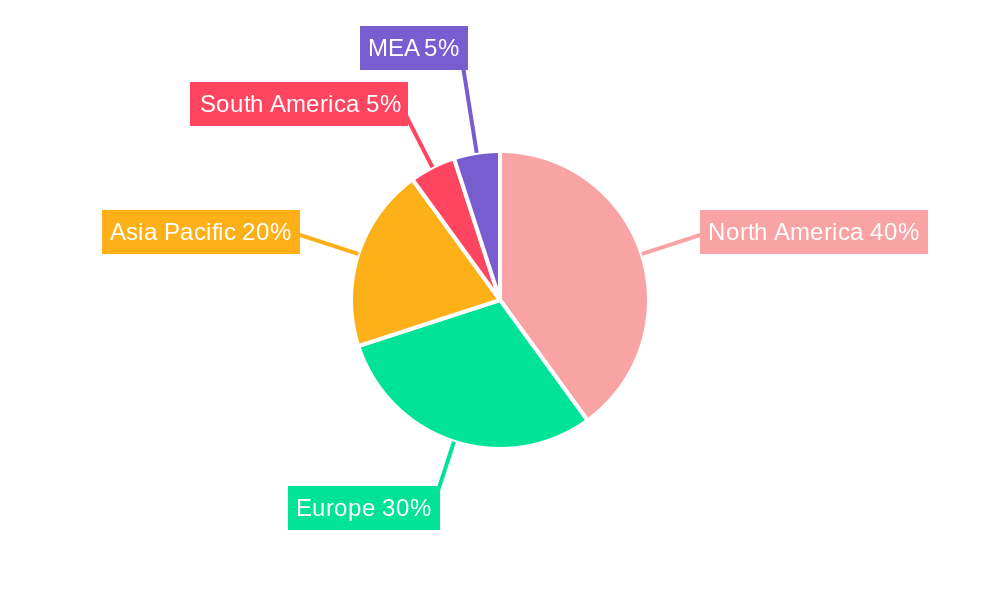
North America currently dominates the Customer Analytics Platform market, driven by high technological adoption, robust IT infrastructure, and a large number of enterprises. However, the Asia-Pacific region is projected to witness the fastest growth during the forecast period due to increasing digitalization, rising disposable incomes, and expanding e-commerce. Within segments, the BFSI (Banking, Financial Services, and Insurance) and Telecommunications and IT end-user industries demonstrate strong growth due to their significant reliance on customer data for risk management and personalized service. Cloud-based deployment models are rapidly gaining traction, surpassing on-premise solutions in terms of market share. Dashboard and reporting tools, as well as Voice of Customer (VOC) solutions, constitute significant market segments. Large Enterprises drive the majority of the market revenue. Managed services are witnessing strong demand for their scalability and cost-effectiveness.
- Leading Region: North America
- Fastest Growing Region: Asia-Pacific
- Leading End-user Industry: BFSI & Telecommunications and IT
- Leading Deployment Type: Cloud-based
- Leading Solution: Dashboard and Reporting Tools, VOC
- Leading Organization Size: Large Enterprises
- Leading Service: Managed Service
Customer Analytics Platform Industry Product Landscape
Customer Analytics Platforms are evolving rapidly, incorporating AI, machine learning, and advanced analytics capabilities to offer more sophisticated customer insights. Products are increasingly focusing on user-friendly dashboards, real-time analytics, and seamless data integration with other enterprise systems. Unique selling propositions frequently include pre-built integrations, industry-specific solutions, and advanced predictive modeling capabilities. Recent technological advancements involve the incorporation of natural language processing (NLP) for sentiment analysis and improved data visualization techniques.
Key Drivers, Barriers & Challenges in Customer Analytics Platform Industry
Key Drivers:
- Increasing need for customer-centric strategies.
- Growing volume and variety of customer data.
- Rise of cloud computing and big data analytics.
- Adoption of AI and machine learning for advanced analytics.
Challenges:
- Data security and privacy concerns.
- High implementation costs.
- Lack of skilled professionals.
- Integrating disparate data sources. This leads to an estimated xx% reduction in project success rates.
Emerging Opportunities in Customer Analytics Platform Industry
- Growing demand for personalized experiences across multiple channels.
- Expansion into untapped markets, particularly in developing economies.
- Application of customer analytics in new industries (e.g., smart cities).
- Integration of customer analytics with other technologies (e.g., IoT).
Growth Accelerators in the Customer Analytics Platform Industry
The Customer Analytics Platform market is poised for sustained growth, driven by several key factors. Technological breakthroughs in AI and machine learning are continuously enhancing the capabilities of these platforms, making them more powerful and efficient. Strategic partnerships between technology providers and industry-specific businesses are expanding market reach and driving adoption. The expansion of cloud-based solutions increases accessibility, affordability, and scalability, further accelerating market growth.
Key Players Shaping the Customer Analytics Platform Industry Market
Notable Milestones in Customer Analytics Platform Industry Sector
- January 2022: SAS launched SAS Customer Intelligence 360, enhancing customer insights through AI and machine learning.
- June 2022: Acquia partnered with Workato, expanding access to Acquia Customer Data Platform (CDP).
In-Depth Customer Analytics Platform Industry Market Outlook
The Customer Analytics Platform market is projected to experience significant growth in the coming years, driven by ongoing technological advancements, increasing data volumes, and the growing demand for personalized customer experiences. Strategic opportunities exist for businesses to develop innovative solutions leveraging AI and machine learning, focusing on specific industry verticals, and expanding into untapped markets. Companies with strong data security and privacy protocols will be best positioned to capture market share and drive long-term growth.
Customer Analytics Platform Industry Segmentation
-
1. Deployment Type
- 1.1. On-premise
- 1.2. Cloud-based
-
2. Solution
- 2.1. Social Media Analytical Tools
- 2.2. Web Analytical Tools
- 2.3. Dashboard and Reporting Tools
- 2.4. Voice of Customer (VOC)
- 2.5. ETL (Extract, Transform, and Load)
- 2.6. Analytical Modules/Tools
-
3. Organization Size
- 3.1. Small and Medium Enterprises
- 3.2. Large Enterprises
-
4. Service
- 4.1. Managed Service
- 4.2. Professional Service
-
5. End-user Industry
- 5.1. Telecommunications and IT
- 5.2. Travel and Hospitality
- 5.3. Retail
- 5.4. BFSI
- 5.5. Media and Entertainment
- 5.6. Healthcare
- 5.7. Transportation and Logistics
- 5.8. Manufacturing
- 5.9. Other End-user Industries
Customer Analytics Platform Industry Segmentation By Geography
- 1. North America
- 2. Europe
- 3. Asia
- 4. Australia and New Zealand
- 5. Latin America
- 6. Middle East and Africa
Customer Analytics Platform Industry Regional Market Share
Geographic Coverage of Customer Analytics Platform Industry
Customer Analytics Platform Industry REPORT HIGHLIGHTS
| Aspects | Details |
|---|---|
| Study Period | 2020-2034 |
| Base Year | 2025 |
| Estimated Year | 2026 |
| Forecast Period | 2026-2034 |
| Historical Period | 2020-2025 |
| Growth Rate | CAGR of 19.01% from 2020-2034 |
| Segmentation |
|
Table of Contents
- 1. Introduction
- 1.1. Research Scope
- 1.2. Market Segmentation
- 1.3. Research Methodology
- 1.4. Definitions and Assumptions
- 2. Executive Summary
- 2.1. Introduction
- 3. Market Dynamics
- 3.1. Introduction
- 3.2. Market Drivers
- 3.2.1. Rising Demand for Improved Customer Satisfaction; Increase in Social Media Concern to Address Customer Behavior
- 3.3. Market Restrains
- 3.3.1. Data Security and Privacy Concerns
- 3.4. Market Trends
- 3.4.1. Growing Retail Sector to Drive Market Growth
- 4. Market Factor Analysis
- 4.1. Porters Five Forces
- 4.2. Supply/Value Chain
- 4.3. PESTEL analysis
- 4.4. Market Entropy
- 4.5. Patent/Trademark Analysis
- 5. Global Customer Analytics Platform Industry Analysis, Insights and Forecast, 2020-2032
- 5.1. Market Analysis, Insights and Forecast - by Deployment Type
- 5.1.1. On-premise
- 5.1.2. Cloud-based
- 5.2. Market Analysis, Insights and Forecast - by Solution
- 5.2.1. Social Media Analytical Tools
- 5.2.2. Web Analytical Tools
- 5.2.3. Dashboard and Reporting Tools
- 5.2.4. Voice of Customer (VOC)
- 5.2.5. ETL (Extract, Transform, and Load)
- 5.2.6. Analytical Modules/Tools
- 5.3. Market Analysis, Insights and Forecast - by Organization Size
- 5.3.1. Small and Medium Enterprises
- 5.3.2. Large Enterprises
- 5.4. Market Analysis, Insights and Forecast - by Service
- 5.4.1. Managed Service
- 5.4.2. Professional Service
- 5.5. Market Analysis, Insights and Forecast - by End-user Industry
- 5.5.1. Telecommunications and IT
- 5.5.2. Travel and Hospitality
- 5.5.3. Retail
- 5.5.4. BFSI
- 5.5.5. Media and Entertainment
- 5.5.6. Healthcare
- 5.5.7. Transportation and Logistics
- 5.5.8. Manufacturing
- 5.5.9. Other End-user Industries
- 5.6. Market Analysis, Insights and Forecast - by Region
- 5.6.1. North America
- 5.6.2. Europe
- 5.6.3. Asia
- 5.6.4. Australia and New Zealand
- 5.6.5. Latin America
- 5.6.6. Middle East and Africa
- 5.1. Market Analysis, Insights and Forecast - by Deployment Type
- 6. North America Customer Analytics Platform Industry Analysis, Insights and Forecast, 2020-2032
- 6.1. Market Analysis, Insights and Forecast - by Deployment Type
- 6.1.1. On-premise
- 6.1.2. Cloud-based
- 6.2. Market Analysis, Insights and Forecast - by Solution
- 6.2.1. Social Media Analytical Tools
- 6.2.2. Web Analytical Tools
- 6.2.3. Dashboard and Reporting Tools
- 6.2.4. Voice of Customer (VOC)
- 6.2.5. ETL (Extract, Transform, and Load)
- 6.2.6. Analytical Modules/Tools
- 6.3. Market Analysis, Insights and Forecast - by Organization Size
- 6.3.1. Small and Medium Enterprises
- 6.3.2. Large Enterprises
- 6.4. Market Analysis, Insights and Forecast - by Service
- 6.4.1. Managed Service
- 6.4.2. Professional Service
- 6.5. Market Analysis, Insights and Forecast - by End-user Industry
- 6.5.1. Telecommunications and IT
- 6.5.2. Travel and Hospitality
- 6.5.3. Retail
- 6.5.4. BFSI
- 6.5.5. Media and Entertainment
- 6.5.6. Healthcare
- 6.5.7. Transportation and Logistics
- 6.5.8. Manufacturing
- 6.5.9. Other End-user Industries
- 6.1. Market Analysis, Insights and Forecast - by Deployment Type
- 7. Europe Customer Analytics Platform Industry Analysis, Insights and Forecast, 2020-2032
- 7.1. Market Analysis, Insights and Forecast - by Deployment Type
- 7.1.1. On-premise
- 7.1.2. Cloud-based
- 7.2. Market Analysis, Insights and Forecast - by Solution
- 7.2.1. Social Media Analytical Tools
- 7.2.2. Web Analytical Tools
- 7.2.3. Dashboard and Reporting Tools
- 7.2.4. Voice of Customer (VOC)
- 7.2.5. ETL (Extract, Transform, and Load)
- 7.2.6. Analytical Modules/Tools
- 7.3. Market Analysis, Insights and Forecast - by Organization Size
- 7.3.1. Small and Medium Enterprises
- 7.3.2. Large Enterprises
- 7.4. Market Analysis, Insights and Forecast - by Service
- 7.4.1. Managed Service
- 7.4.2. Professional Service
- 7.5. Market Analysis, Insights and Forecast - by End-user Industry
- 7.5.1. Telecommunications and IT
- 7.5.2. Travel and Hospitality
- 7.5.3. Retail
- 7.5.4. BFSI
- 7.5.5. Media and Entertainment
- 7.5.6. Healthcare
- 7.5.7. Transportation and Logistics
- 7.5.8. Manufacturing
- 7.5.9. Other End-user Industries
- 7.1. Market Analysis, Insights and Forecast - by Deployment Type
- 8. Asia Customer Analytics Platform Industry Analysis, Insights and Forecast, 2020-2032
- 8.1. Market Analysis, Insights and Forecast - by Deployment Type
- 8.1.1. On-premise
- 8.1.2. Cloud-based
- 8.2. Market Analysis, Insights and Forecast - by Solution
- 8.2.1. Social Media Analytical Tools
- 8.2.2. Web Analytical Tools
- 8.2.3. Dashboard and Reporting Tools
- 8.2.4. Voice of Customer (VOC)
- 8.2.5. ETL (Extract, Transform, and Load)
- 8.2.6. Analytical Modules/Tools
- 8.3. Market Analysis, Insights and Forecast - by Organization Size
- 8.3.1. Small and Medium Enterprises
- 8.3.2. Large Enterprises
- 8.4. Market Analysis, Insights and Forecast - by Service
- 8.4.1. Managed Service
- 8.4.2. Professional Service
- 8.5. Market Analysis, Insights and Forecast - by End-user Industry
- 8.5.1. Telecommunications and IT
- 8.5.2. Travel and Hospitality
- 8.5.3. Retail
- 8.5.4. BFSI
- 8.5.5. Media and Entertainment
- 8.5.6. Healthcare
- 8.5.7. Transportation and Logistics
- 8.5.8. Manufacturing
- 8.5.9. Other End-user Industries
- 8.1. Market Analysis, Insights and Forecast - by Deployment Type
- 9. Australia and New Zealand Customer Analytics Platform Industry Analysis, Insights and Forecast, 2020-2032
- 9.1. Market Analysis, Insights and Forecast - by Deployment Type
- 9.1.1. On-premise
- 9.1.2. Cloud-based
- 9.2. Market Analysis, Insights and Forecast - by Solution
- 9.2.1. Social Media Analytical Tools
- 9.2.2. Web Analytical Tools
- 9.2.3. Dashboard and Reporting Tools
- 9.2.4. Voice of Customer (VOC)
- 9.2.5. ETL (Extract, Transform, and Load)
- 9.2.6. Analytical Modules/Tools
- 9.3. Market Analysis, Insights and Forecast - by Organization Size
- 9.3.1. Small and Medium Enterprises
- 9.3.2. Large Enterprises
- 9.4. Market Analysis, Insights and Forecast - by Service
- 9.4.1. Managed Service
- 9.4.2. Professional Service
- 9.5. Market Analysis, Insights and Forecast - by End-user Industry
- 9.5.1. Telecommunications and IT
- 9.5.2. Travel and Hospitality
- 9.5.3. Retail
- 9.5.4. BFSI
- 9.5.5. Media and Entertainment
- 9.5.6. Healthcare
- 9.5.7. Transportation and Logistics
- 9.5.8. Manufacturing
- 9.5.9. Other End-user Industries
- 9.1. Market Analysis, Insights and Forecast - by Deployment Type
- 10. Latin America Customer Analytics Platform Industry Analysis, Insights and Forecast, 2020-2032
- 10.1. Market Analysis, Insights and Forecast - by Deployment Type
- 10.1.1. On-premise
- 10.1.2. Cloud-based
- 10.2. Market Analysis, Insights and Forecast - by Solution
- 10.2.1. Social Media Analytical Tools
- 10.2.2. Web Analytical Tools
- 10.2.3. Dashboard and Reporting Tools
- 10.2.4. Voice of Customer (VOC)
- 10.2.5. ETL (Extract, Transform, and Load)
- 10.2.6. Analytical Modules/Tools
- 10.3. Market Analysis, Insights and Forecast - by Organization Size
- 10.3.1. Small and Medium Enterprises
- 10.3.2. Large Enterprises
- 10.4. Market Analysis, Insights and Forecast - by Service
- 10.4.1. Managed Service
- 10.4.2. Professional Service
- 10.5. Market Analysis, Insights and Forecast - by End-user Industry
- 10.5.1. Telecommunications and IT
- 10.5.2. Travel and Hospitality
- 10.5.3. Retail
- 10.5.4. BFSI
- 10.5.5. Media and Entertainment
- 10.5.6. Healthcare
- 10.5.7. Transportation and Logistics
- 10.5.8. Manufacturing
- 10.5.9. Other End-user Industries
- 10.1. Market Analysis, Insights and Forecast - by Deployment Type
- 11. Middle East and Africa Customer Analytics Platform Industry Analysis, Insights and Forecast, 2020-2032
- 11.1. Market Analysis, Insights and Forecast - by Deployment Type
- 11.1.1. On-premise
- 11.1.2. Cloud-based
- 11.2. Market Analysis, Insights and Forecast - by Solution
- 11.2.1. Social Media Analytical Tools
- 11.2.2. Web Analytical Tools
- 11.2.3. Dashboard and Reporting Tools
- 11.2.4. Voice of Customer (VOC)
- 11.2.5. ETL (Extract, Transform, and Load)
- 11.2.6. Analytical Modules/Tools
- 11.3. Market Analysis, Insights and Forecast - by Organization Size
- 11.3.1. Small and Medium Enterprises
- 11.3.2. Large Enterprises
- 11.4. Market Analysis, Insights and Forecast - by Service
- 11.4.1. Managed Service
- 11.4.2. Professional Service
- 11.5. Market Analysis, Insights and Forecast - by End-user Industry
- 11.5.1. Telecommunications and IT
- 11.5.2. Travel and Hospitality
- 11.5.3. Retail
- 11.5.4. BFSI
- 11.5.5. Media and Entertainment
- 11.5.6. Healthcare
- 11.5.7. Transportation and Logistics
- 11.5.8. Manufacturing
- 11.5.9. Other End-user Industries
- 11.1. Market Analysis, Insights and Forecast - by Deployment Type
- 12. Competitive Analysis
- 12.1. Global Market Share Analysis 2025
- 12.2. Company Profiles
- 12.2.1 Angoss Software Corporation
- 12.2.1.1. Overview
- 12.2.1.2. Products
- 12.2.1.3. SWOT Analysis
- 12.2.1.4. Recent Developments
- 12.2.1.5. Financials (Based on Availability)
- 12.2.2 SAS Institute Inc
- 12.2.2.1. Overview
- 12.2.2.2. Products
- 12.2.2.3. SWOT Analysis
- 12.2.2.4. Recent Developments
- 12.2.2.5. Financials (Based on Availability)
- 12.2.3 Microsoft
- 12.2.3.1. Overview
- 12.2.3.2. Products
- 12.2.3.3. SWOT Analysis
- 12.2.3.4. Recent Developments
- 12.2.3.5. Financials (Based on Availability)
- 12.2.4 Axtria
- 12.2.4.1. Overview
- 12.2.4.2. Products
- 12.2.4.3. SWOT Analysis
- 12.2.4.4. Recent Developments
- 12.2.4.5. Financials (Based on Availability)
- 12.2.5 Aruba Networks Inc (Hewlett Packard Enterprise Development LP)
- 12.2.5.1. Overview
- 12.2.5.2. Products
- 12.2.5.3. SWOT Analysis
- 12.2.5.4. Recent Developments
- 12.2.5.5. Financials (Based on Availability)
- 12.2.6 NGDATA NV
- 12.2.6.1. Overview
- 12.2.6.2. Products
- 12.2.6.3. SWOT Analysis
- 12.2.6.4. Recent Developments
- 12.2.6.5. Financials (Based on Availability)
- 12.2.7 Teoco Corporation
- 12.2.7.1. Overview
- 12.2.7.2. Products
- 12.2.7.3. SWOT Analysis
- 12.2.7.4. Recent Developments
- 12.2.7.5. Financials (Based on Availability)
- 12.2.8 Salesforce Inc
- 12.2.8.1. Overview
- 12.2.8.2. Products
- 12.2.8.3. SWOT Analysis
- 12.2.8.4. Recent Developments
- 12.2.8.5. Financials (Based on Availability)
- 12.2.9 Bridgei2i Analytics Solution (Accenture)
- 12.2.9.1. Overview
- 12.2.9.2. Products
- 12.2.9.3. SWOT Analysis
- 12.2.9.4. Recent Developments
- 12.2.9.5. Financials (Based on Availability)
- 12.2.10 Manthan Software Services Pvt Ltd
- 12.2.10.1. Overview
- 12.2.10.2. Products
- 12.2.10.3. SWOT Analysis
- 12.2.10.4. Recent Developments
- 12.2.10.5. Financials (Based on Availability)
- 12.2.11 Pitney Bowes Inc
- 12.2.11.1. Overview
- 12.2.11.2. Products
- 12.2.11.3. SWOT Analysis
- 12.2.11.4. Recent Developments
- 12.2.11.5. Financials (Based on Availability)
- 12.2.12 Adobe
- 12.2.12.1. Overview
- 12.2.12.2. Products
- 12.2.12.3. SWOT Analysis
- 12.2.12.4. Recent Developments
- 12.2.12.5. Financials (Based on Availability)
- 12.2.13 Alteryx
- 12.2.13.1. Overview
- 12.2.13.2. Products
- 12.2.13.3. SWOT Analysis
- 12.2.13.4. Recent Developments
- 12.2.13.5. Financials (Based on Availability)
- 12.2.14 Oracle
- 12.2.14.1. Overview
- 12.2.14.2. Products
- 12.2.14.3. SWOT Analysis
- 12.2.14.4. Recent Developments
- 12.2.14.5. Financials (Based on Availability)
- 12.2.15 IBM
- 12.2.15.1. Overview
- 12.2.15.2. Products
- 12.2.15.3. SWOT Analysis
- 12.2.15.4. Recent Developments
- 12.2.15.5. Financials (Based on Availability)
- 12.2.1 Angoss Software Corporation
List of Figures
- Figure 1: Global Customer Analytics Platform Industry Revenue Breakdown (Million, %) by Region 2025 & 2033
- Figure 2: Global Customer Analytics Platform Industry Volume Breakdown (K Unit, %) by Region 2025 & 2033
- Figure 3: North America Customer Analytics Platform Industry Revenue (Million), by Deployment Type 2025 & 2033
- Figure 4: North America Customer Analytics Platform Industry Volume (K Unit), by Deployment Type 2025 & 2033
- Figure 5: North America Customer Analytics Platform Industry Revenue Share (%), by Deployment Type 2025 & 2033
- Figure 6: North America Customer Analytics Platform Industry Volume Share (%), by Deployment Type 2025 & 2033
- Figure 7: North America Customer Analytics Platform Industry Revenue (Million), by Solution 2025 & 2033
- Figure 8: North America Customer Analytics Platform Industry Volume (K Unit), by Solution 2025 & 2033
- Figure 9: North America Customer Analytics Platform Industry Revenue Share (%), by Solution 2025 & 2033
- Figure 10: North America Customer Analytics Platform Industry Volume Share (%), by Solution 2025 & 2033
- Figure 11: North America Customer Analytics Platform Industry Revenue (Million), by Organization Size 2025 & 2033
- Figure 12: North America Customer Analytics Platform Industry Volume (K Unit), by Organization Size 2025 & 2033
- Figure 13: North America Customer Analytics Platform Industry Revenue Share (%), by Organization Size 2025 & 2033
- Figure 14: North America Customer Analytics Platform Industry Volume Share (%), by Organization Size 2025 & 2033
- Figure 15: North America Customer Analytics Platform Industry Revenue (Million), by Service 2025 & 2033
- Figure 16: North America Customer Analytics Platform Industry Volume (K Unit), by Service 2025 & 2033
- Figure 17: North America Customer Analytics Platform Industry Revenue Share (%), by Service 2025 & 2033
- Figure 18: North America Customer Analytics Platform Industry Volume Share (%), by Service 2025 & 2033
- Figure 19: North America Customer Analytics Platform Industry Revenue (Million), by End-user Industry 2025 & 2033
- Figure 20: North America Customer Analytics Platform Industry Volume (K Unit), by End-user Industry 2025 & 2033
- Figure 21: North America Customer Analytics Platform Industry Revenue Share (%), by End-user Industry 2025 & 2033
- Figure 22: North America Customer Analytics Platform Industry Volume Share (%), by End-user Industry 2025 & 2033
- Figure 23: North America Customer Analytics Platform Industry Revenue (Million), by Country 2025 & 2033
- Figure 24: North America Customer Analytics Platform Industry Volume (K Unit), by Country 2025 & 2033
- Figure 25: North America Customer Analytics Platform Industry Revenue Share (%), by Country 2025 & 2033
- Figure 26: North America Customer Analytics Platform Industry Volume Share (%), by Country 2025 & 2033
- Figure 27: Europe Customer Analytics Platform Industry Revenue (Million), by Deployment Type 2025 & 2033
- Figure 28: Europe Customer Analytics Platform Industry Volume (K Unit), by Deployment Type 2025 & 2033
- Figure 29: Europe Customer Analytics Platform Industry Revenue Share (%), by Deployment Type 2025 & 2033
- Figure 30: Europe Customer Analytics Platform Industry Volume Share (%), by Deployment Type 2025 & 2033
- Figure 31: Europe Customer Analytics Platform Industry Revenue (Million), by Solution 2025 & 2033
- Figure 32: Europe Customer Analytics Platform Industry Volume (K Unit), by Solution 2025 & 2033
- Figure 33: Europe Customer Analytics Platform Industry Revenue Share (%), by Solution 2025 & 2033
- Figure 34: Europe Customer Analytics Platform Industry Volume Share (%), by Solution 2025 & 2033
- Figure 35: Europe Customer Analytics Platform Industry Revenue (Million), by Organization Size 2025 & 2033
- Figure 36: Europe Customer Analytics Platform Industry Volume (K Unit), by Organization Size 2025 & 2033
- Figure 37: Europe Customer Analytics Platform Industry Revenue Share (%), by Organization Size 2025 & 2033
- Figure 38: Europe Customer Analytics Platform Industry Volume Share (%), by Organization Size 2025 & 2033
- Figure 39: Europe Customer Analytics Platform Industry Revenue (Million), by Service 2025 & 2033
- Figure 40: Europe Customer Analytics Platform Industry Volume (K Unit), by Service 2025 & 2033
- Figure 41: Europe Customer Analytics Platform Industry Revenue Share (%), by Service 2025 & 2033
- Figure 42: Europe Customer Analytics Platform Industry Volume Share (%), by Service 2025 & 2033
- Figure 43: Europe Customer Analytics Platform Industry Revenue (Million), by End-user Industry 2025 & 2033
- Figure 44: Europe Customer Analytics Platform Industry Volume (K Unit), by End-user Industry 2025 & 2033
- Figure 45: Europe Customer Analytics Platform Industry Revenue Share (%), by End-user Industry 2025 & 2033
- Figure 46: Europe Customer Analytics Platform Industry Volume Share (%), by End-user Industry 2025 & 2033
- Figure 47: Europe Customer Analytics Platform Industry Revenue (Million), by Country 2025 & 2033
- Figure 48: Europe Customer Analytics Platform Industry Volume (K Unit), by Country 2025 & 2033
- Figure 49: Europe Customer Analytics Platform Industry Revenue Share (%), by Country 2025 & 2033
- Figure 50: Europe Customer Analytics Platform Industry Volume Share (%), by Country 2025 & 2033
- Figure 51: Asia Customer Analytics Platform Industry Revenue (Million), by Deployment Type 2025 & 2033
- Figure 52: Asia Customer Analytics Platform Industry Volume (K Unit), by Deployment Type 2025 & 2033
- Figure 53: Asia Customer Analytics Platform Industry Revenue Share (%), by Deployment Type 2025 & 2033
- Figure 54: Asia Customer Analytics Platform Industry Volume Share (%), by Deployment Type 2025 & 2033
- Figure 55: Asia Customer Analytics Platform Industry Revenue (Million), by Solution 2025 & 2033
- Figure 56: Asia Customer Analytics Platform Industry Volume (K Unit), by Solution 2025 & 2033
- Figure 57: Asia Customer Analytics Platform Industry Revenue Share (%), by Solution 2025 & 2033
- Figure 58: Asia Customer Analytics Platform Industry Volume Share (%), by Solution 2025 & 2033
- Figure 59: Asia Customer Analytics Platform Industry Revenue (Million), by Organization Size 2025 & 2033
- Figure 60: Asia Customer Analytics Platform Industry Volume (K Unit), by Organization Size 2025 & 2033
- Figure 61: Asia Customer Analytics Platform Industry Revenue Share (%), by Organization Size 2025 & 2033
- Figure 62: Asia Customer Analytics Platform Industry Volume Share (%), by Organization Size 2025 & 2033
- Figure 63: Asia Customer Analytics Platform Industry Revenue (Million), by Service 2025 & 2033
- Figure 64: Asia Customer Analytics Platform Industry Volume (K Unit), by Service 2025 & 2033
- Figure 65: Asia Customer Analytics Platform Industry Revenue Share (%), by Service 2025 & 2033
- Figure 66: Asia Customer Analytics Platform Industry Volume Share (%), by Service 2025 & 2033
- Figure 67: Asia Customer Analytics Platform Industry Revenue (Million), by End-user Industry 2025 & 2033
- Figure 68: Asia Customer Analytics Platform Industry Volume (K Unit), by End-user Industry 2025 & 2033
- Figure 69: Asia Customer Analytics Platform Industry Revenue Share (%), by End-user Industry 2025 & 2033
- Figure 70: Asia Customer Analytics Platform Industry Volume Share (%), by End-user Industry 2025 & 2033
- Figure 71: Asia Customer Analytics Platform Industry Revenue (Million), by Country 2025 & 2033
- Figure 72: Asia Customer Analytics Platform Industry Volume (K Unit), by Country 2025 & 2033
- Figure 73: Asia Customer Analytics Platform Industry Revenue Share (%), by Country 2025 & 2033
- Figure 74: Asia Customer Analytics Platform Industry Volume Share (%), by Country 2025 & 2033
- Figure 75: Australia and New Zealand Customer Analytics Platform Industry Revenue (Million), by Deployment Type 2025 & 2033
- Figure 76: Australia and New Zealand Customer Analytics Platform Industry Volume (K Unit), by Deployment Type 2025 & 2033
- Figure 77: Australia and New Zealand Customer Analytics Platform Industry Revenue Share (%), by Deployment Type 2025 & 2033
- Figure 78: Australia and New Zealand Customer Analytics Platform Industry Volume Share (%), by Deployment Type 2025 & 2033
- Figure 79: Australia and New Zealand Customer Analytics Platform Industry Revenue (Million), by Solution 2025 & 2033
- Figure 80: Australia and New Zealand Customer Analytics Platform Industry Volume (K Unit), by Solution 2025 & 2033
- Figure 81: Australia and New Zealand Customer Analytics Platform Industry Revenue Share (%), by Solution 2025 & 2033
- Figure 82: Australia and New Zealand Customer Analytics Platform Industry Volume Share (%), by Solution 2025 & 2033
- Figure 83: Australia and New Zealand Customer Analytics Platform Industry Revenue (Million), by Organization Size 2025 & 2033
- Figure 84: Australia and New Zealand Customer Analytics Platform Industry Volume (K Unit), by Organization Size 2025 & 2033
- Figure 85: Australia and New Zealand Customer Analytics Platform Industry Revenue Share (%), by Organization Size 2025 & 2033
- Figure 86: Australia and New Zealand Customer Analytics Platform Industry Volume Share (%), by Organization Size 2025 & 2033
- Figure 87: Australia and New Zealand Customer Analytics Platform Industry Revenue (Million), by Service 2025 & 2033
- Figure 88: Australia and New Zealand Customer Analytics Platform Industry Volume (K Unit), by Service 2025 & 2033
- Figure 89: Australia and New Zealand Customer Analytics Platform Industry Revenue Share (%), by Service 2025 & 2033
- Figure 90: Australia and New Zealand Customer Analytics Platform Industry Volume Share (%), by Service 2025 & 2033
- Figure 91: Australia and New Zealand Customer Analytics Platform Industry Revenue (Million), by End-user Industry 2025 & 2033
- Figure 92: Australia and New Zealand Customer Analytics Platform Industry Volume (K Unit), by End-user Industry 2025 & 2033
- Figure 93: Australia and New Zealand Customer Analytics Platform Industry Revenue Share (%), by End-user Industry 2025 & 2033
- Figure 94: Australia and New Zealand Customer Analytics Platform Industry Volume Share (%), by End-user Industry 2025 & 2033
- Figure 95: Australia and New Zealand Customer Analytics Platform Industry Revenue (Million), by Country 2025 & 2033
- Figure 96: Australia and New Zealand Customer Analytics Platform Industry Volume (K Unit), by Country 2025 & 2033
- Figure 97: Australia and New Zealand Customer Analytics Platform Industry Revenue Share (%), by Country 2025 & 2033
- Figure 98: Australia and New Zealand Customer Analytics Platform Industry Volume Share (%), by Country 2025 & 2033
- Figure 99: Latin America Customer Analytics Platform Industry Revenue (Million), by Deployment Type 2025 & 2033
- Figure 100: Latin America Customer Analytics Platform Industry Volume (K Unit), by Deployment Type 2025 & 2033
- Figure 101: Latin America Customer Analytics Platform Industry Revenue Share (%), by Deployment Type 2025 & 2033
- Figure 102: Latin America Customer Analytics Platform Industry Volume Share (%), by Deployment Type 2025 & 2033
- Figure 103: Latin America Customer Analytics Platform Industry Revenue (Million), by Solution 2025 & 2033
- Figure 104: Latin America Customer Analytics Platform Industry Volume (K Unit), by Solution 2025 & 2033
- Figure 105: Latin America Customer Analytics Platform Industry Revenue Share (%), by Solution 2025 & 2033
- Figure 106: Latin America Customer Analytics Platform Industry Volume Share (%), by Solution 2025 & 2033
- Figure 107: Latin America Customer Analytics Platform Industry Revenue (Million), by Organization Size 2025 & 2033
- Figure 108: Latin America Customer Analytics Platform Industry Volume (K Unit), by Organization Size 2025 & 2033
- Figure 109: Latin America Customer Analytics Platform Industry Revenue Share (%), by Organization Size 2025 & 2033
- Figure 110: Latin America Customer Analytics Platform Industry Volume Share (%), by Organization Size 2025 & 2033
- Figure 111: Latin America Customer Analytics Platform Industry Revenue (Million), by Service 2025 & 2033
- Figure 112: Latin America Customer Analytics Platform Industry Volume (K Unit), by Service 2025 & 2033
- Figure 113: Latin America Customer Analytics Platform Industry Revenue Share (%), by Service 2025 & 2033
- Figure 114: Latin America Customer Analytics Platform Industry Volume Share (%), by Service 2025 & 2033
- Figure 115: Latin America Customer Analytics Platform Industry Revenue (Million), by End-user Industry 2025 & 2033
- Figure 116: Latin America Customer Analytics Platform Industry Volume (K Unit), by End-user Industry 2025 & 2033
- Figure 117: Latin America Customer Analytics Platform Industry Revenue Share (%), by End-user Industry 2025 & 2033
- Figure 118: Latin America Customer Analytics Platform Industry Volume Share (%), by End-user Industry 2025 & 2033
- Figure 119: Latin America Customer Analytics Platform Industry Revenue (Million), by Country 2025 & 2033
- Figure 120: Latin America Customer Analytics Platform Industry Volume (K Unit), by Country 2025 & 2033
- Figure 121: Latin America Customer Analytics Platform Industry Revenue Share (%), by Country 2025 & 2033
- Figure 122: Latin America Customer Analytics Platform Industry Volume Share (%), by Country 2025 & 2033
- Figure 123: Middle East and Africa Customer Analytics Platform Industry Revenue (Million), by Deployment Type 2025 & 2033
- Figure 124: Middle East and Africa Customer Analytics Platform Industry Volume (K Unit), by Deployment Type 2025 & 2033
- Figure 125: Middle East and Africa Customer Analytics Platform Industry Revenue Share (%), by Deployment Type 2025 & 2033
- Figure 126: Middle East and Africa Customer Analytics Platform Industry Volume Share (%), by Deployment Type 2025 & 2033
- Figure 127: Middle East and Africa Customer Analytics Platform Industry Revenue (Million), by Solution 2025 & 2033
- Figure 128: Middle East and Africa Customer Analytics Platform Industry Volume (K Unit), by Solution 2025 & 2033
- Figure 129: Middle East and Africa Customer Analytics Platform Industry Revenue Share (%), by Solution 2025 & 2033
- Figure 130: Middle East and Africa Customer Analytics Platform Industry Volume Share (%), by Solution 2025 & 2033
- Figure 131: Middle East and Africa Customer Analytics Platform Industry Revenue (Million), by Organization Size 2025 & 2033
- Figure 132: Middle East and Africa Customer Analytics Platform Industry Volume (K Unit), by Organization Size 2025 & 2033
- Figure 133: Middle East and Africa Customer Analytics Platform Industry Revenue Share (%), by Organization Size 2025 & 2033
- Figure 134: Middle East and Africa Customer Analytics Platform Industry Volume Share (%), by Organization Size 2025 & 2033
- Figure 135: Middle East and Africa Customer Analytics Platform Industry Revenue (Million), by Service 2025 & 2033
- Figure 136: Middle East and Africa Customer Analytics Platform Industry Volume (K Unit), by Service 2025 & 2033
- Figure 137: Middle East and Africa Customer Analytics Platform Industry Revenue Share (%), by Service 2025 & 2033
- Figure 138: Middle East and Africa Customer Analytics Platform Industry Volume Share (%), by Service 2025 & 2033
- Figure 139: Middle East and Africa Customer Analytics Platform Industry Revenue (Million), by End-user Industry 2025 & 2033
- Figure 140: Middle East and Africa Customer Analytics Platform Industry Volume (K Unit), by End-user Industry 2025 & 2033
- Figure 141: Middle East and Africa Customer Analytics Platform Industry Revenue Share (%), by End-user Industry 2025 & 2033
- Figure 142: Middle East and Africa Customer Analytics Platform Industry Volume Share (%), by End-user Industry 2025 & 2033
- Figure 143: Middle East and Africa Customer Analytics Platform Industry Revenue (Million), by Country 2025 & 2033
- Figure 144: Middle East and Africa Customer Analytics Platform Industry Volume (K Unit), by Country 2025 & 2033
- Figure 145: Middle East and Africa Customer Analytics Platform Industry Revenue Share (%), by Country 2025 & 2033
- Figure 146: Middle East and Africa Customer Analytics Platform Industry Volume Share (%), by Country 2025 & 2033
List of Tables
- Table 1: Global Customer Analytics Platform Industry Revenue Million Forecast, by Deployment Type 2020 & 2033
- Table 2: Global Customer Analytics Platform Industry Volume K Unit Forecast, by Deployment Type 2020 & 2033
- Table 3: Global Customer Analytics Platform Industry Revenue Million Forecast, by Solution 2020 & 2033
- Table 4: Global Customer Analytics Platform Industry Volume K Unit Forecast, by Solution 2020 & 2033
- Table 5: Global Customer Analytics Platform Industry Revenue Million Forecast, by Organization Size 2020 & 2033
- Table 6: Global Customer Analytics Platform Industry Volume K Unit Forecast, by Organization Size 2020 & 2033
- Table 7: Global Customer Analytics Platform Industry Revenue Million Forecast, by Service 2020 & 2033
- Table 8: Global Customer Analytics Platform Industry Volume K Unit Forecast, by Service 2020 & 2033
- Table 9: Global Customer Analytics Platform Industry Revenue Million Forecast, by End-user Industry 2020 & 2033
- Table 10: Global Customer Analytics Platform Industry Volume K Unit Forecast, by End-user Industry 2020 & 2033
- Table 11: Global Customer Analytics Platform Industry Revenue Million Forecast, by Region 2020 & 2033
- Table 12: Global Customer Analytics Platform Industry Volume K Unit Forecast, by Region 2020 & 2033
- Table 13: Global Customer Analytics Platform Industry Revenue Million Forecast, by Deployment Type 2020 & 2033
- Table 14: Global Customer Analytics Platform Industry Volume K Unit Forecast, by Deployment Type 2020 & 2033
- Table 15: Global Customer Analytics Platform Industry Revenue Million Forecast, by Solution 2020 & 2033
- Table 16: Global Customer Analytics Platform Industry Volume K Unit Forecast, by Solution 2020 & 2033
- Table 17: Global Customer Analytics Platform Industry Revenue Million Forecast, by Organization Size 2020 & 2033
- Table 18: Global Customer Analytics Platform Industry Volume K Unit Forecast, by Organization Size 2020 & 2033
- Table 19: Global Customer Analytics Platform Industry Revenue Million Forecast, by Service 2020 & 2033
- Table 20: Global Customer Analytics Platform Industry Volume K Unit Forecast, by Service 2020 & 2033
- Table 21: Global Customer Analytics Platform Industry Revenue Million Forecast, by End-user Industry 2020 & 2033
- Table 22: Global Customer Analytics Platform Industry Volume K Unit Forecast, by End-user Industry 2020 & 2033
- Table 23: Global Customer Analytics Platform Industry Revenue Million Forecast, by Country 2020 & 2033
- Table 24: Global Customer Analytics Platform Industry Volume K Unit Forecast, by Country 2020 & 2033
- Table 25: Global Customer Analytics Platform Industry Revenue Million Forecast, by Deployment Type 2020 & 2033
- Table 26: Global Customer Analytics Platform Industry Volume K Unit Forecast, by Deployment Type 2020 & 2033
- Table 27: Global Customer Analytics Platform Industry Revenue Million Forecast, by Solution 2020 & 2033
- Table 28: Global Customer Analytics Platform Industry Volume K Unit Forecast, by Solution 2020 & 2033
- Table 29: Global Customer Analytics Platform Industry Revenue Million Forecast, by Organization Size 2020 & 2033
- Table 30: Global Customer Analytics Platform Industry Volume K Unit Forecast, by Organization Size 2020 & 2033
- Table 31: Global Customer Analytics Platform Industry Revenue Million Forecast, by Service 2020 & 2033
- Table 32: Global Customer Analytics Platform Industry Volume K Unit Forecast, by Service 2020 & 2033
- Table 33: Global Customer Analytics Platform Industry Revenue Million Forecast, by End-user Industry 2020 & 2033
- Table 34: Global Customer Analytics Platform Industry Volume K Unit Forecast, by End-user Industry 2020 & 2033
- Table 35: Global Customer Analytics Platform Industry Revenue Million Forecast, by Country 2020 & 2033
- Table 36: Global Customer Analytics Platform Industry Volume K Unit Forecast, by Country 2020 & 2033
- Table 37: Global Customer Analytics Platform Industry Revenue Million Forecast, by Deployment Type 2020 & 2033
- Table 38: Global Customer Analytics Platform Industry Volume K Unit Forecast, by Deployment Type 2020 & 2033
- Table 39: Global Customer Analytics Platform Industry Revenue Million Forecast, by Solution 2020 & 2033
- Table 40: Global Customer Analytics Platform Industry Volume K Unit Forecast, by Solution 2020 & 2033
- Table 41: Global Customer Analytics Platform Industry Revenue Million Forecast, by Organization Size 2020 & 2033
- Table 42: Global Customer Analytics Platform Industry Volume K Unit Forecast, by Organization Size 2020 & 2033
- Table 43: Global Customer Analytics Platform Industry Revenue Million Forecast, by Service 2020 & 2033
- Table 44: Global Customer Analytics Platform Industry Volume K Unit Forecast, by Service 2020 & 2033
- Table 45: Global Customer Analytics Platform Industry Revenue Million Forecast, by End-user Industry 2020 & 2033
- Table 46: Global Customer Analytics Platform Industry Volume K Unit Forecast, by End-user Industry 2020 & 2033
- Table 47: Global Customer Analytics Platform Industry Revenue Million Forecast, by Country 2020 & 2033
- Table 48: Global Customer Analytics Platform Industry Volume K Unit Forecast, by Country 2020 & 2033
- Table 49: Global Customer Analytics Platform Industry Revenue Million Forecast, by Deployment Type 2020 & 2033
- Table 50: Global Customer Analytics Platform Industry Volume K Unit Forecast, by Deployment Type 2020 & 2033
- Table 51: Global Customer Analytics Platform Industry Revenue Million Forecast, by Solution 2020 & 2033
- Table 52: Global Customer Analytics Platform Industry Volume K Unit Forecast, by Solution 2020 & 2033
- Table 53: Global Customer Analytics Platform Industry Revenue Million Forecast, by Organization Size 2020 & 2033
- Table 54: Global Customer Analytics Platform Industry Volume K Unit Forecast, by Organization Size 2020 & 2033
- Table 55: Global Customer Analytics Platform Industry Revenue Million Forecast, by Service 2020 & 2033
- Table 56: Global Customer Analytics Platform Industry Volume K Unit Forecast, by Service 2020 & 2033
- Table 57: Global Customer Analytics Platform Industry Revenue Million Forecast, by End-user Industry 2020 & 2033
- Table 58: Global Customer Analytics Platform Industry Volume K Unit Forecast, by End-user Industry 2020 & 2033
- Table 59: Global Customer Analytics Platform Industry Revenue Million Forecast, by Country 2020 & 2033
- Table 60: Global Customer Analytics Platform Industry Volume K Unit Forecast, by Country 2020 & 2033
- Table 61: Global Customer Analytics Platform Industry Revenue Million Forecast, by Deployment Type 2020 & 2033
- Table 62: Global Customer Analytics Platform Industry Volume K Unit Forecast, by Deployment Type 2020 & 2033
- Table 63: Global Customer Analytics Platform Industry Revenue Million Forecast, by Solution 2020 & 2033
- Table 64: Global Customer Analytics Platform Industry Volume K Unit Forecast, by Solution 2020 & 2033
- Table 65: Global Customer Analytics Platform Industry Revenue Million Forecast, by Organization Size 2020 & 2033
- Table 66: Global Customer Analytics Platform Industry Volume K Unit Forecast, by Organization Size 2020 & 2033
- Table 67: Global Customer Analytics Platform Industry Revenue Million Forecast, by Service 2020 & 2033
- Table 68: Global Customer Analytics Platform Industry Volume K Unit Forecast, by Service 2020 & 2033
- Table 69: Global Customer Analytics Platform Industry Revenue Million Forecast, by End-user Industry 2020 & 2033
- Table 70: Global Customer Analytics Platform Industry Volume K Unit Forecast, by End-user Industry 2020 & 2033
- Table 71: Global Customer Analytics Platform Industry Revenue Million Forecast, by Country 2020 & 2033
- Table 72: Global Customer Analytics Platform Industry Volume K Unit Forecast, by Country 2020 & 2033
- Table 73: Global Customer Analytics Platform Industry Revenue Million Forecast, by Deployment Type 2020 & 2033
- Table 74: Global Customer Analytics Platform Industry Volume K Unit Forecast, by Deployment Type 2020 & 2033
- Table 75: Global Customer Analytics Platform Industry Revenue Million Forecast, by Solution 2020 & 2033
- Table 76: Global Customer Analytics Platform Industry Volume K Unit Forecast, by Solution 2020 & 2033
- Table 77: Global Customer Analytics Platform Industry Revenue Million Forecast, by Organization Size 2020 & 2033
- Table 78: Global Customer Analytics Platform Industry Volume K Unit Forecast, by Organization Size 2020 & 2033
- Table 79: Global Customer Analytics Platform Industry Revenue Million Forecast, by Service 2020 & 2033
- Table 80: Global Customer Analytics Platform Industry Volume K Unit Forecast, by Service 2020 & 2033
- Table 81: Global Customer Analytics Platform Industry Revenue Million Forecast, by End-user Industry 2020 & 2033
- Table 82: Global Customer Analytics Platform Industry Volume K Unit Forecast, by End-user Industry 2020 & 2033
- Table 83: Global Customer Analytics Platform Industry Revenue Million Forecast, by Country 2020 & 2033
- Table 84: Global Customer Analytics Platform Industry Volume K Unit Forecast, by Country 2020 & 2033
Frequently Asked Questions
1. What is the projected Compound Annual Growth Rate (CAGR) of the Customer Analytics Platform Industry?
The projected CAGR is approximately 19.01%.
2. Which companies are prominent players in the Customer Analytics Platform Industry?
Key companies in the market include Angoss Software Corporation, SAS Institute Inc, Microsoft, Axtria, Aruba Networks Inc (Hewlett Packard Enterprise Development LP), NGDATA NV, Teoco Corporation, Salesforce Inc, Bridgei2i Analytics Solution (Accenture), Manthan Software Services Pvt Ltd, Pitney Bowes Inc, Adobe, Alteryx, Oracle, IBM.
3. What are the main segments of the Customer Analytics Platform Industry?
The market segments include Deployment Type, Solution, Organization Size, Service, End-user Industry.
4. Can you provide details about the market size?
The market size is estimated to be USD 12.45 Million as of 2022.
5. What are some drivers contributing to market growth?
Rising Demand for Improved Customer Satisfaction; Increase in Social Media Concern to Address Customer Behavior.
6. What are the notable trends driving market growth?
Growing Retail Sector to Drive Market Growth.
7. Are there any restraints impacting market growth?
Data Security and Privacy Concerns.
8. Can you provide examples of recent developments in the market?
January 2022 - SAS launched SAS Customer Intelligence 360, a new tool that automatically identifies better solutions for searching for common qualities in customer data. Using AI and machine learning, this integrated customer analytics enhances customer insights. It also offers out-of-the-box analytical automation support to help clients make better decisions, respond faster, and create income more quickly.
9. What pricing options are available for accessing the report?
Pricing options include single-user, multi-user, and enterprise licenses priced at USD 4750, USD 5250, and USD 8750 respectively.
10. Is the market size provided in terms of value or volume?
The market size is provided in terms of value, measured in Million and volume, measured in K Unit.
11. Are there any specific market keywords associated with the report?
Yes, the market keyword associated with the report is "Customer Analytics Platform Industry," which aids in identifying and referencing the specific market segment covered.
12. How do I determine which pricing option suits my needs best?
The pricing options vary based on user requirements and access needs. Individual users may opt for single-user licenses, while businesses requiring broader access may choose multi-user or enterprise licenses for cost-effective access to the report.
13. Are there any additional resources or data provided in the Customer Analytics Platform Industry report?
While the report offers comprehensive insights, it's advisable to review the specific contents or supplementary materials provided to ascertain if additional resources or data are available.
14. How can I stay updated on further developments or reports in the Customer Analytics Platform Industry?
To stay informed about further developments, trends, and reports in the Customer Analytics Platform Industry, consider subscribing to industry newsletters, following relevant companies and organizations, or regularly checking reputable industry news sources and publications.
Methodology
Step 1 - Identification of Relevant Samples Size from Population Database


Step 2 - Approaches for Defining Global Market Size (Value, Volume* & Price*)

Note*: In applicable scenarios
Step 3 - Data Sources
Primary Research
- Web Analytics
- Survey Reports
- Research Institute
- Latest Research Reports
- Opinion Leaders
Secondary Research
- Annual Reports
- White Paper
- Latest Press Release
- Industry Association
- Paid Database
- Investor Presentations

Step 4 - Data Triangulation
Involves using different sources of information in order to increase the validity of a study
These sources are likely to be stakeholders in a program - participants, other researchers, program staff, other community members, and so on.
Then we put all data in single framework & apply various statistical tools to find out the dynamic on the market.
During the analysis stage, feedback from the stakeholder groups would be compared to determine areas of agreement as well as areas of divergence