

Key Insights
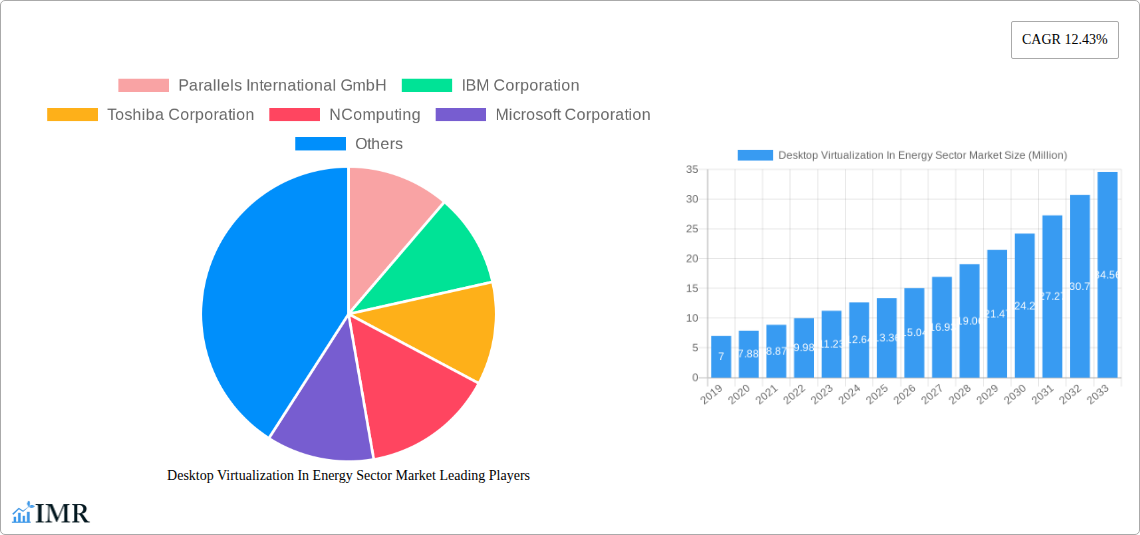
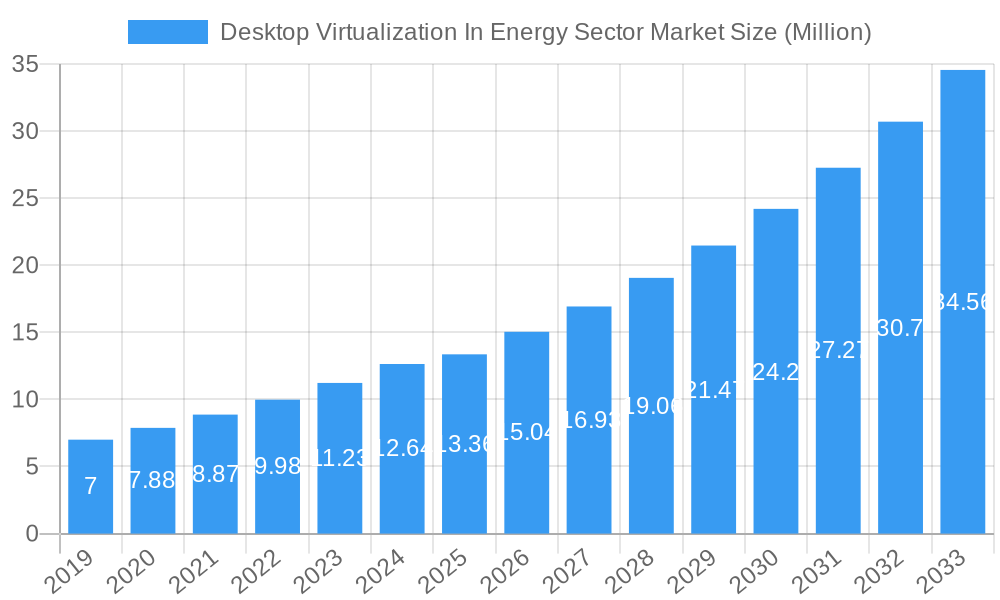
The Desktop Virtualization in the Energy Sector market is poised for significant expansion, projected to reach a substantial USD 13.36 billion by 2025. This robust growth is fueled by a compelling CAGR of 12.43%, indicating a dynamic and rapidly evolving landscape. The energy sector, increasingly reliant on digital infrastructure and remote operational capabilities, is a prime beneficiary of desktop virtualization solutions. Key drivers for this adoption include the imperative for enhanced cybersecurity in protecting critical infrastructure, the growing need for operational efficiency through centralized management and remote access, and the flexibility offered by cloud-based deployments to scale resources dynamically. Furthermore, the sector's commitment to sustainability aligns well with the energy-saving potential of virtualized desktops, which can reduce hardware redundancy and power consumption. The market is witnessing a strong inclination towards Hosted Virtual Desktops (HVDs) due to their superior performance and user experience, though Hosted Shared Desktops (HSDs) continue to cater to specific cost-sensitive use cases. The shift towards cloud deployment models is particularly pronounced, offering scalability, accessibility, and reduced capital expenditure for energy companies.
Desktop Virtualization In Energy Sector Market Market Size (In Million)
The competitive landscape is characterized by the presence of major technology giants and specialized virtualization providers, including Microsoft Corporation, Citrix Systems Inc., Vmware Inc., IBM Corporation, and Dell Inc., alongside innovative players like Parallels International GmbH and Huawei Technologies Co Ltd. These companies are actively developing advanced solutions to meet the unique demands of the energy sector, such as secure remote access for field technicians, compliance with stringent regulatory requirements, and seamless integration with operational technology (OT) systems. Emerging trends point towards an increased adoption of VDI for managing complex industrial control systems (ICS), supporting remote collaboration among geographically dispersed teams, and enabling disaster recovery and business continuity plans. While the market is experiencing strong tailwinds, potential restraints could include the initial investment costs associated with implementing comprehensive VDI solutions, the need for specialized IT expertise to manage and maintain these environments, and potential concerns regarding latency and performance in extremely remote or bandwidth-constrained locations. However, ongoing technological advancements are steadily mitigating these challenges, paving the way for widespread adoption.
Desktop Virtualization In Energy Sector Market Company Market Share
This comprehensive report delves into the rapidly evolving Desktop Virtualization in the Energy Sector Market, offering an in-depth analysis of market dynamics, growth trends, regional dominance, and key player strategies from 2019 to 2033. With a base year of 2025 and a forecast period extending to 2033, this study provides critical insights for stakeholders navigating the complexities of modernizing IT infrastructure within the energy industry. We analyze the strategic adoption of virtual desktop infrastructure (VDI), hosted virtual desktops (HVD), and hosted shared desktops (HSD) solutions, encompassing both on-premise and cloud deployment modes.
The energy sector's increasing reliance on digital transformation, cybersecurity, and remote workforce enablement fuels the demand for robust and scalable desktop virtualization solutions. This report is essential for IT managers, cybersecurity professionals, infrastructure architects, and decision-makers in oil and gas, utilities, renewables, and related energy sub-sectors seeking to optimize operational efficiency, enhance data security, and reduce IT operational costs.
Desktop Virtualization In Energy Sector Market Market Dynamics & Structure
The Desktop Virtualization in the Energy Sector Market is characterized by a moderately concentrated landscape, with key players like VMware Inc., Citrix Systems Inc., Microsoft Corporation, and Dell Inc. holding significant market shares. Technological innovation is a primary driver, with advancements in cloud computing, VDI security, and high-definition user experience (HDX) technology continuously shaping the market. Regulatory frameworks, particularly those concerning data privacy and cybersecurity in critical infrastructure, also play a crucial role in dictating adoption strategies. Competitive product substitutes, such as traditional physical desktops and basic remote access tools, are steadily being challenged by the enhanced security and flexibility offered by VDI. End-user demographics are shifting towards a more geographically dispersed and mobile workforce, necessitating flexible and secure access to corporate resources. Merger and acquisition (M&A) trends are observed as larger players seek to consolidate their offerings and expand their market reach within the energy sector. The market anticipates approximately 15-20 M&A deals annually within the broader VDI landscape, with a growing focus on specialized energy sector solutions. Innovation barriers include the high initial implementation costs and the need for specialized IT expertise to manage complex VDI environments.
Desktop Virtualization In Energy Sector Market Growth Trends & Insights
The Desktop Virtualization in the Energy Sector Market is poised for substantial growth, projected to expand from an estimated $XX million in 2025 to $XX million by 2033, exhibiting a Compound Annual Growth Rate (CAGR) of approximately XX% during the forecast period (2025–2033). This robust expansion is driven by the energy sector's imperative to enhance cybersecurity postures, enable agile remote workforces, and streamline IT operations in an increasingly complex and geographically dispersed operational environment. Adoption rates for desktop virtualization solutions are accelerating as companies recognize the tangible benefits in terms of reduced hardware costs, centralized management, and improved data security. Technological disruptions, including the maturation of cloud-based VDI offerings and the integration of artificial intelligence for performance optimization, are further stimulating market penetration. Consumer behavior shifts are evident, with energy sector professionals demanding seamless, secure, and reliable access to critical applications and data, regardless of their location. The market penetration of VDI solutions within the energy sector is expected to increase from XX% in 2025 to XX% by 2033. Key insights reveal that companies are increasingly prioritizing VDI solutions that offer enhanced disaster recovery capabilities and support for specialized industrial applications prevalent in the energy industry. The growing trend towards hybrid cloud environments also necessitates VDI solutions that can seamlessly operate across on-premise and cloud infrastructures, providing organizations with the flexibility to adapt to evolving business needs.
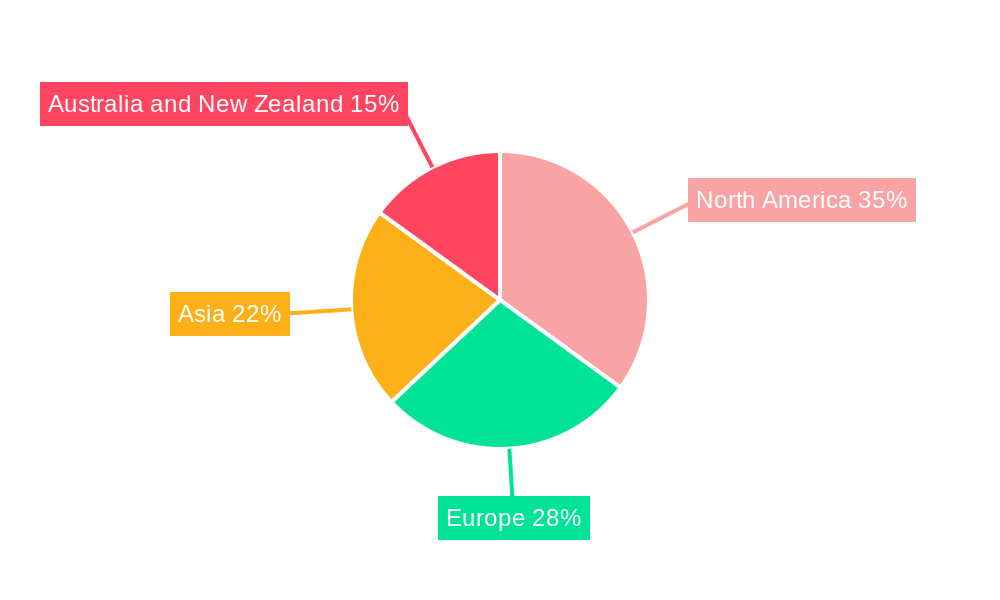
Dominant Regions, Countries, or Segments in Desktop Virtualization In Energy Sector Market
North America currently leads the Desktop Virtualization in the Energy Sector Market, driven by a strong presence of major energy corporations, significant investments in advanced IT infrastructure, and stringent cybersecurity regulations. The United States, in particular, accounts for a substantial portion of market share, estimated at XX% in 2025. Key drivers in this region include robust economic policies supporting technological adoption, well-established IT infrastructure, and a proactive approach to digital transformation initiatives within the oil and gas, and utility sectors. Europe follows closely, with countries like the United Kingdom, Germany, and Norway showing increasing adoption due to their commitment to renewable energy expansion and the need for secure remote access for their distributed workforce.
Within the Desktop Delivery Platform segment, Hosted Virtual Desktop (HVD) is expected to witness the highest growth, driven by its enhanced security features and dedicated resource allocation, crucial for handling sensitive energy-related data. However, Hosted Shared Desktop (HSD) will continue to hold a significant market share due to its cost-effectiveness, particularly for general office use cases.
In terms of Deployment Mode, the Cloud segment is experiencing rapid expansion, projected to grow at a CAGR of XX% during the forecast period. This surge is attributed to the scalability, flexibility, and reduced upfront capital expenditure associated with cloud-based VDI solutions. Energy companies are increasingly leveraging public and hybrid cloud environments to support their dynamic operational needs. The market share of cloud deployment is anticipated to grow from XX% in 2025 to XX% by 2033. On-premise deployments, while still relevant for organizations with specific data sovereignty requirements or existing substantial infrastructure investments, will see a slower growth trajectory.
Desktop Virtualization In Energy Sector Market Product Landscape
The Desktop Virtualization in the Energy Sector Market product landscape is defined by continuous innovation aimed at enhancing performance, security, and user experience. Solutions from Parallels International GmbH, IBM Corporation, and NComputing offer diverse deployment options and management capabilities tailored for industrial environments. Key product advancements include the integration of AI-powered performance optimization, enhanced multi-factor authentication, and robust endpoint security features designed to protect against cyber threats prevalent in the energy sector. Unique selling propositions often revolve around simplified deployment, compatibility with specialized industrial software, and significant cost savings compared to traditional desktop infrastructure. Huawei Technologies Co Ltd is also making strides with integrated solutions that emphasize network performance and scalability.
Key Drivers, Barriers & Challenges in Desktop Virtualization In Energy Sector Market
Key Drivers:
- Enhanced Cybersecurity: Desktop virtualization centralizes data and applications, significantly reducing the attack surface and improving protection against cyber threats targeting critical energy infrastructure.
- Remote Work Enablement: The growing need for flexible and remote work arrangements in the energy sector necessitates secure and reliable access to company resources, a core benefit of VDI.
- Operational Efficiency & Cost Reduction: Centralized management, reduced hardware lifecycle costs, and lower energy consumption contribute to significant operational efficiencies and cost savings.
- Regulatory Compliance: Strict data protection and compliance mandates in the energy sector are driving the adoption of VDI solutions that offer robust security and audit trails.
Key Challenges & Restraints:
- High Initial Implementation Costs: The upfront investment in VDI infrastructure, licensing, and expertise can be a significant barrier for some energy companies.
- Network Bandwidth Requirements: High-definition graphics and real-time data streaming, common in energy sector applications, can place substantial demands on network bandwidth, potentially impacting performance.
- Complexity of Management: Managing large-scale VDI deployments requires specialized IT skills and robust management tools, which may be a challenge for organizations with limited IT resources.
- Vendor Lock-in Concerns: Reliance on specific VDI vendors can lead to concerns about long-term costs and limited flexibility in future technology choices.
Emerging Opportunities in Desktop Virtualization In Energy Sector Market
Emerging opportunities in the Desktop Virtualization in the Energy Sector Market lie in the integration of VDI with advanced technologies like the Internet of Things (IoT) and edge computing. This convergence can enable real-time data processing and analysis at remote operational sites, enhancing efficiency and safety. The growing focus on digital twins and sophisticated simulation software within the energy sector presents a significant opportunity for VDI solutions that can support demanding graphical workloads. Furthermore, the expansion of renewable energy projects in remote locations creates a demand for secure and flexible remote access solutions that VDI can readily provide. The increasing adoption of AI and machine learning for predictive maintenance and operational optimization within energy firms also opens avenues for VDI to deliver the necessary computing power and data accessibility.
Growth Accelerators in the Desktop Virtualization In Energy Sector Market Industry
Catalysts driving long-term growth in the Desktop Virtualization in the Energy Sector Market include the ongoing digital transformation initiatives across the global energy landscape, which necessitate modernized and secure IT infrastructures. Technological breakthroughs in cloud computing, hyper-converged infrastructure (HCI), and advanced endpoint security are making VDI solutions more accessible, scalable, and cost-effective. Strategic partnerships between VDI providers and energy sector IT service providers are crucial for tailoring solutions to the unique needs of the industry. Market expansion strategies focusing on emerging economies with rapidly developing energy sectors also represent significant growth potential. The continuous drive for operational resilience and business continuity in the face of geopolitical and environmental uncertainties further fuels the demand for robust VDI solutions.
Key Players Shaping the Desktop Virtualization In Energy Sector Market Market
- Parallels International GmbH
- IBM Corporation
- Toshiba Corporation
- NComputing
- Microsoft Corporation
- Dell Inc
- Huawei Technologies Co Ltd
- Ericom Software Inc
- Citrix Systems Inc
- Vmware Inc
Notable Milestones in Desktop Virtualization In Energy Sector Market Sector
- September 2022: Amazon Web Services Inc. updated Amazon Workspaces, a desktop virtualization suite, with new features that enable customers to use Workspaces Core along with an upgrade that would make it feasible to host virtual desktops powered by the Ubuntu operating system on its cloud platform.
- May 2022: Citrix Systems, Inc. announced it is working with Microsoft on an upcoming offering that combines Citrix's market-leading high-definition user experience (HDX) technology, ecosystem flexibility with Windows 365, robust IT policy control, the global first Cloud PC, providing IT administrators streamlined Citrix employees, a seamless switch to Citrix users through Microsoft Endpoint Manager and windows365.microsoft.com.
In-Depth Desktop Virtualization In Energy Sector Market Market Outlook
The future outlook for the Desktop Virtualization in the Energy Sector Market is exceptionally promising, fueled by the industry's relentless pursuit of enhanced security, operational agility, and cost optimization. Growth accelerators such as the increasing adoption of hybrid and multi-cloud strategies, coupled with the demand for sophisticated remote collaboration tools, will continue to propel market expansion. Strategic opportunities lie in the development of specialized VDI solutions tailored for niche applications within the energy sector, such as operational technology (OT) environments, and the integration of VDI with emerging technologies like augmented reality for field service operations. The market is expected to witness continued innovation in areas like AI-driven security and performance management, ensuring VDI remains a cornerstone of IT modernization in the energy industry for years to come.
Desktop Virtualization In Energy Sector Market Segmentation
-
1. Desktop Delivery Platform
- 1.1. Hosted Virtual Desktop (HVD)
- 1.2. Hosted Shared Desktop (HSD)
-
2. Deployment Mode
- 2.1. On-Premise
- 2.2. Cloud
Desktop Virtualization In Energy Sector Market Segmentation By Geography
- 1. North America
- 2. Europe
- 3. Asia
- 4. Australia and New Zealand
Desktop Virtualization In Energy Sector Market Regional Market Share
Geographic Coverage of Desktop Virtualization In Energy Sector Market
Desktop Virtualization In Energy Sector Market REPORT HIGHLIGHTS
| Aspects | Details |
|---|---|
| Study Period | 2020-2034 |
| Base Year | 2025 |
| Estimated Year | 2026 |
| Forecast Period | 2026-2034 |
| Historical Period | 2020-2025 |
| Growth Rate | CAGR of 12.43% from 2020-2034 |
| Segmentation |
|
Table of Contents
- 1. Introduction
- 1.1. Research Scope
- 1.2. Market Segmentation
- 1.3. Research Methodology
- 1.4. Definitions and Assumptions
- 2. Executive Summary
- 2.1. Introduction
- 3. Market Dynamics
- 3.1. Introduction
- 3.2. Market Drivers
- 3.2.1. Growing Adoption of Cloud and Need for Remote Accessibility is Driving the Market Growth
- 3.3. Market Restrains
- 3.3.1. Infrastructural Constraints is Discouraging the Market Expansion
- 3.4. Market Trends
- 3.4.1. Cloud Deployment Mode Segment is Expected to Hold Significant Market Share
- 4. Market Factor Analysis
- 4.1. Porters Five Forces
- 4.2. Supply/Value Chain
- 4.3. PESTEL analysis
- 4.4. Market Entropy
- 4.5. Patent/Trademark Analysis
- 5. Global Desktop Virtualization In Energy Sector Market Analysis, Insights and Forecast, 2020-2032
- 5.1. Market Analysis, Insights and Forecast - by Desktop Delivery Platform
- 5.1.1. Hosted Virtual Desktop (HVD)
- 5.1.2. Hosted Shared Desktop (HSD)
- 5.2. Market Analysis, Insights and Forecast - by Deployment Mode
- 5.2.1. On-Premise
- 5.2.2. Cloud
- 5.3. Market Analysis, Insights and Forecast - by Region
- 5.3.1. North America
- 5.3.2. Europe
- 5.3.3. Asia
- 5.3.4. Australia and New Zealand
- 5.1. Market Analysis, Insights and Forecast - by Desktop Delivery Platform
- 6. North America Desktop Virtualization In Energy Sector Market Analysis, Insights and Forecast, 2020-2032
- 6.1. Market Analysis, Insights and Forecast - by Desktop Delivery Platform
- 6.1.1. Hosted Virtual Desktop (HVD)
- 6.1.2. Hosted Shared Desktop (HSD)
- 6.2. Market Analysis, Insights and Forecast - by Deployment Mode
- 6.2.1. On-Premise
- 6.2.2. Cloud
- 6.1. Market Analysis, Insights and Forecast - by Desktop Delivery Platform
- 7. Europe Desktop Virtualization In Energy Sector Market Analysis, Insights and Forecast, 2020-2032
- 7.1. Market Analysis, Insights and Forecast - by Desktop Delivery Platform
- 7.1.1. Hosted Virtual Desktop (HVD)
- 7.1.2. Hosted Shared Desktop (HSD)
- 7.2. Market Analysis, Insights and Forecast - by Deployment Mode
- 7.2.1. On-Premise
- 7.2.2. Cloud
- 7.1. Market Analysis, Insights and Forecast - by Desktop Delivery Platform
- 8. Asia Desktop Virtualization In Energy Sector Market Analysis, Insights and Forecast, 2020-2032
- 8.1. Market Analysis, Insights and Forecast - by Desktop Delivery Platform
- 8.1.1. Hosted Virtual Desktop (HVD)
- 8.1.2. Hosted Shared Desktop (HSD)
- 8.2. Market Analysis, Insights and Forecast - by Deployment Mode
- 8.2.1. On-Premise
- 8.2.2. Cloud
- 8.1. Market Analysis, Insights and Forecast - by Desktop Delivery Platform
- 9. Australia and New Zealand Desktop Virtualization In Energy Sector Market Analysis, Insights and Forecast, 2020-2032
- 9.1. Market Analysis, Insights and Forecast - by Desktop Delivery Platform
- 9.1.1. Hosted Virtual Desktop (HVD)
- 9.1.2. Hosted Shared Desktop (HSD)
- 9.2. Market Analysis, Insights and Forecast - by Deployment Mode
- 9.2.1. On-Premise
- 9.2.2. Cloud
- 9.1. Market Analysis, Insights and Forecast - by Desktop Delivery Platform
- 10. Competitive Analysis
- 10.1. Global Market Share Analysis 2025
- 10.2. Company Profiles
- 10.2.1 Parallels International GmbH
- 10.2.1.1. Overview
- 10.2.1.2. Products
- 10.2.1.3. SWOT Analysis
- 10.2.1.4. Recent Developments
- 10.2.1.5. Financials (Based on Availability)
- 10.2.2 IBM Corporation
- 10.2.2.1. Overview
- 10.2.2.2. Products
- 10.2.2.3. SWOT Analysis
- 10.2.2.4. Recent Developments
- 10.2.2.5. Financials (Based on Availability)
- 10.2.3 Toshiba Corporation
- 10.2.3.1. Overview
- 10.2.3.2. Products
- 10.2.3.3. SWOT Analysis
- 10.2.3.4. Recent Developments
- 10.2.3.5. Financials (Based on Availability)
- 10.2.4 NComputing
- 10.2.4.1. Overview
- 10.2.4.2. Products
- 10.2.4.3. SWOT Analysis
- 10.2.4.4. Recent Developments
- 10.2.4.5. Financials (Based on Availability)
- 10.2.5 Microsoft Corporation
- 10.2.5.1. Overview
- 10.2.5.2. Products
- 10.2.5.3. SWOT Analysis
- 10.2.5.4. Recent Developments
- 10.2.5.5. Financials (Based on Availability)
- 10.2.6 Dell Inc
- 10.2.6.1. Overview
- 10.2.6.2. Products
- 10.2.6.3. SWOT Analysis
- 10.2.6.4. Recent Developments
- 10.2.6.5. Financials (Based on Availability)
- 10.2.7 Huawei Technologies Co Ltd
- 10.2.7.1. Overview
- 10.2.7.2. Products
- 10.2.7.3. SWOT Analysis
- 10.2.7.4. Recent Developments
- 10.2.7.5. Financials (Based on Availability)
- 10.2.8 Ericom Software Inc
- 10.2.8.1. Overview
- 10.2.8.2. Products
- 10.2.8.3. SWOT Analysis
- 10.2.8.4. Recent Developments
- 10.2.8.5. Financials (Based on Availability)
- 10.2.9 Citrix Systems Inc
- 10.2.9.1. Overview
- 10.2.9.2. Products
- 10.2.9.3. SWOT Analysis
- 10.2.9.4. Recent Developments
- 10.2.9.5. Financials (Based on Availability)
- 10.2.10 Vmware Inc
- 10.2.10.1. Overview
- 10.2.10.2. Products
- 10.2.10.3. SWOT Analysis
- 10.2.10.4. Recent Developments
- 10.2.10.5. Financials (Based on Availability)
- 10.2.1 Parallels International GmbH
List of Figures
- Figure 1: Global Desktop Virtualization In Energy Sector Market Revenue Breakdown (Million, %) by Region 2025 & 2033
- Figure 2: North America Desktop Virtualization In Energy Sector Market Revenue (Million), by Desktop Delivery Platform 2025 & 2033
- Figure 3: North America Desktop Virtualization In Energy Sector Market Revenue Share (%), by Desktop Delivery Platform 2025 & 2033
- Figure 4: North America Desktop Virtualization In Energy Sector Market Revenue (Million), by Deployment Mode 2025 & 2033
- Figure 5: North America Desktop Virtualization In Energy Sector Market Revenue Share (%), by Deployment Mode 2025 & 2033
- Figure 6: North America Desktop Virtualization In Energy Sector Market Revenue (Million), by Country 2025 & 2033
- Figure 7: North America Desktop Virtualization In Energy Sector Market Revenue Share (%), by Country 2025 & 2033
- Figure 8: Europe Desktop Virtualization In Energy Sector Market Revenue (Million), by Desktop Delivery Platform 2025 & 2033
- Figure 9: Europe Desktop Virtualization In Energy Sector Market Revenue Share (%), by Desktop Delivery Platform 2025 & 2033
- Figure 10: Europe Desktop Virtualization In Energy Sector Market Revenue (Million), by Deployment Mode 2025 & 2033
- Figure 11: Europe Desktop Virtualization In Energy Sector Market Revenue Share (%), by Deployment Mode 2025 & 2033
- Figure 12: Europe Desktop Virtualization In Energy Sector Market Revenue (Million), by Country 2025 & 2033
- Figure 13: Europe Desktop Virtualization In Energy Sector Market Revenue Share (%), by Country 2025 & 2033
- Figure 14: Asia Desktop Virtualization In Energy Sector Market Revenue (Million), by Desktop Delivery Platform 2025 & 2033
- Figure 15: Asia Desktop Virtualization In Energy Sector Market Revenue Share (%), by Desktop Delivery Platform 2025 & 2033
- Figure 16: Asia Desktop Virtualization In Energy Sector Market Revenue (Million), by Deployment Mode 2025 & 2033
- Figure 17: Asia Desktop Virtualization In Energy Sector Market Revenue Share (%), by Deployment Mode 2025 & 2033
- Figure 18: Asia Desktop Virtualization In Energy Sector Market Revenue (Million), by Country 2025 & 2033
- Figure 19: Asia Desktop Virtualization In Energy Sector Market Revenue Share (%), by Country 2025 & 2033
- Figure 20: Australia and New Zealand Desktop Virtualization In Energy Sector Market Revenue (Million), by Desktop Delivery Platform 2025 & 2033
- Figure 21: Australia and New Zealand Desktop Virtualization In Energy Sector Market Revenue Share (%), by Desktop Delivery Platform 2025 & 2033
- Figure 22: Australia and New Zealand Desktop Virtualization In Energy Sector Market Revenue (Million), by Deployment Mode 2025 & 2033
- Figure 23: Australia and New Zealand Desktop Virtualization In Energy Sector Market Revenue Share (%), by Deployment Mode 2025 & 2033
- Figure 24: Australia and New Zealand Desktop Virtualization In Energy Sector Market Revenue (Million), by Country 2025 & 2033
- Figure 25: Australia and New Zealand Desktop Virtualization In Energy Sector Market Revenue Share (%), by Country 2025 & 2033
List of Tables
- Table 1: Global Desktop Virtualization In Energy Sector Market Revenue Million Forecast, by Desktop Delivery Platform 2020 & 2033
- Table 2: Global Desktop Virtualization In Energy Sector Market Revenue Million Forecast, by Deployment Mode 2020 & 2033
- Table 3: Global Desktop Virtualization In Energy Sector Market Revenue Million Forecast, by Region 2020 & 2033
- Table 4: Global Desktop Virtualization In Energy Sector Market Revenue Million Forecast, by Desktop Delivery Platform 2020 & 2033
- Table 5: Global Desktop Virtualization In Energy Sector Market Revenue Million Forecast, by Deployment Mode 2020 & 2033
- Table 6: Global Desktop Virtualization In Energy Sector Market Revenue Million Forecast, by Country 2020 & 2033
- Table 7: Global Desktop Virtualization In Energy Sector Market Revenue Million Forecast, by Desktop Delivery Platform 2020 & 2033
- Table 8: Global Desktop Virtualization In Energy Sector Market Revenue Million Forecast, by Deployment Mode 2020 & 2033
- Table 9: Global Desktop Virtualization In Energy Sector Market Revenue Million Forecast, by Country 2020 & 2033
- Table 10: Global Desktop Virtualization In Energy Sector Market Revenue Million Forecast, by Desktop Delivery Platform 2020 & 2033
- Table 11: Global Desktop Virtualization In Energy Sector Market Revenue Million Forecast, by Deployment Mode 2020 & 2033
- Table 12: Global Desktop Virtualization In Energy Sector Market Revenue Million Forecast, by Country 2020 & 2033
- Table 13: Global Desktop Virtualization In Energy Sector Market Revenue Million Forecast, by Desktop Delivery Platform 2020 & 2033
- Table 14: Global Desktop Virtualization In Energy Sector Market Revenue Million Forecast, by Deployment Mode 2020 & 2033
- Table 15: Global Desktop Virtualization In Energy Sector Market Revenue Million Forecast, by Country 2020 & 2033
Frequently Asked Questions
1. What is the projected Compound Annual Growth Rate (CAGR) of the Desktop Virtualization In Energy Sector Market?
The projected CAGR is approximately 12.43%.
2. Which companies are prominent players in the Desktop Virtualization In Energy Sector Market?
Key companies in the market include Parallels International GmbH, IBM Corporation, Toshiba Corporation, NComputing, Microsoft Corporation, Dell Inc, Huawei Technologies Co Ltd, Ericom Software Inc, Citrix Systems Inc, Vmware Inc .
3. What are the main segments of the Desktop Virtualization In Energy Sector Market?
The market segments include Desktop Delivery Platform, Deployment Mode.
4. Can you provide details about the market size?
The market size is estimated to be USD 13.36 Million as of 2022.
5. What are some drivers contributing to market growth?
Growing Adoption of Cloud and Need for Remote Accessibility is Driving the Market Growth.
6. What are the notable trends driving market growth?
Cloud Deployment Mode Segment is Expected to Hold Significant Market Share.
7. Are there any restraints impacting market growth?
Infrastructural Constraints is Discouraging the Market Expansion.
8. Can you provide examples of recent developments in the market?
September 2022: Amazon Web Services Inc. updated Amazon Workspaces, a desktop virtualization suite, with new features that enable customers to use Workspaces Core along with an upgrade that would make it feasible to host virtual desktops powered by the Ubuntu operating system on its cloud platform.
9. What pricing options are available for accessing the report?
Pricing options include single-user, multi-user, and enterprise licenses priced at USD 4750, USD 5250, and USD 8750 respectively.
10. Is the market size provided in terms of value or volume?
The market size is provided in terms of value, measured in Million.
11. Are there any specific market keywords associated with the report?
Yes, the market keyword associated with the report is "Desktop Virtualization In Energy Sector Market," which aids in identifying and referencing the specific market segment covered.
12. How do I determine which pricing option suits my needs best?
The pricing options vary based on user requirements and access needs. Individual users may opt for single-user licenses, while businesses requiring broader access may choose multi-user or enterprise licenses for cost-effective access to the report.
13. Are there any additional resources or data provided in the Desktop Virtualization In Energy Sector Market report?
While the report offers comprehensive insights, it's advisable to review the specific contents or supplementary materials provided to ascertain if additional resources or data are available.
14. How can I stay updated on further developments or reports in the Desktop Virtualization In Energy Sector Market?
To stay informed about further developments, trends, and reports in the Desktop Virtualization In Energy Sector Market, consider subscribing to industry newsletters, following relevant companies and organizations, or regularly checking reputable industry news sources and publications.
Methodology
Step 1 - Identification of Relevant Samples Size from Population Database


Step 2 - Approaches for Defining Global Market Size (Value, Volume* & Price*)

Note*: In applicable scenarios
Step 3 - Data Sources
Primary Research
- Web Analytics
- Survey Reports
- Research Institute
- Latest Research Reports
- Opinion Leaders
Secondary Research
- Annual Reports
- White Paper
- Latest Press Release
- Industry Association
- Paid Database
- Investor Presentations

Step 4 - Data Triangulation
Involves using different sources of information in order to increase the validity of a study
These sources are likely to be stakeholders in a program - participants, other researchers, program staff, other community members, and so on.
Then we put all data in single framework & apply various statistical tools to find out the dynamic on the market.
During the analysis stage, feedback from the stakeholder groups would be compared to determine areas of agreement as well as areas of divergence