

Key Insights
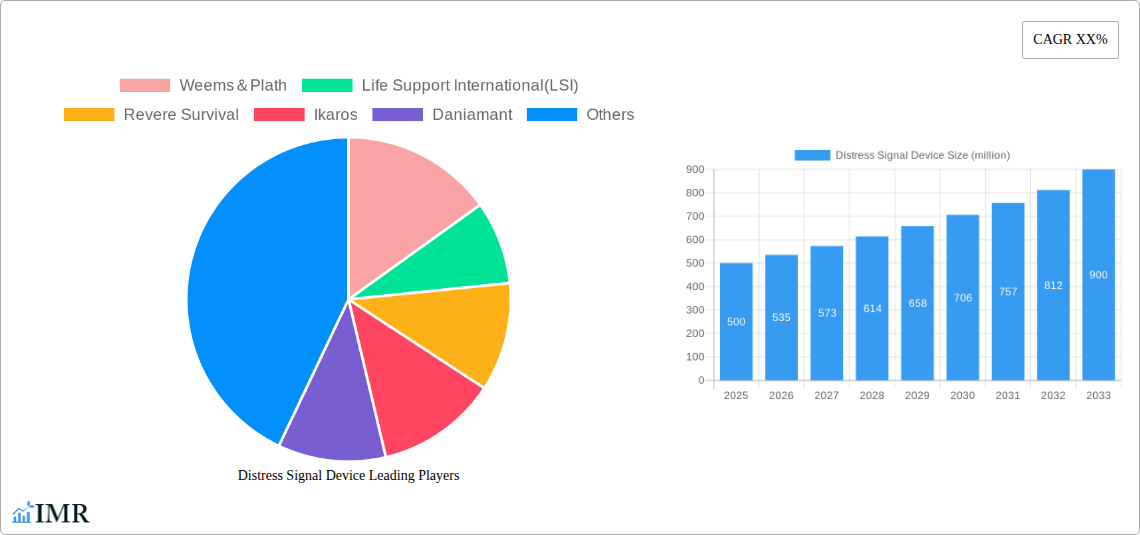
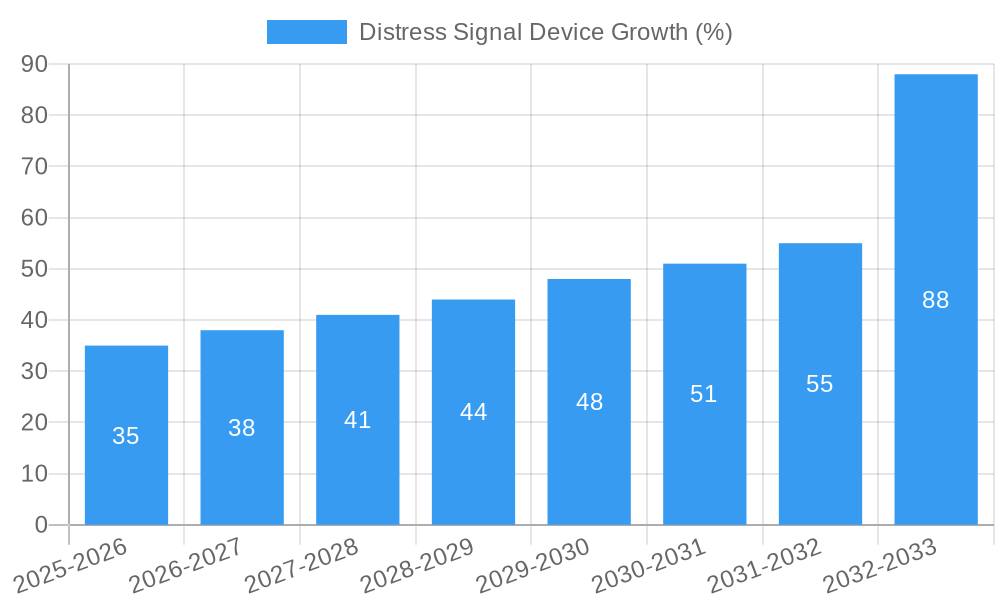
The global distress signal device market is experiencing robust growth, driven by increasing maritime activities, stringent safety regulations, and advancements in technology. The market, estimated at $500 million in 2025, is projected to expand at a Compound Annual Growth Rate (CAGR) of 7% from 2025 to 2033, reaching approximately $900 million by 2033. Key drivers include the rising demand for enhanced safety measures across various sectors, such as maritime, aviation, and outdoor recreation. Governments worldwide are implementing stricter regulations mandating the use of distress signal devices, further fueling market growth. Technological advancements, including the integration of GPS, satellite communication, and personal locator beacons (PLBs), are enhancing the effectiveness and reliability of these devices, attracting a wider user base. The market is segmented based on device type (EPIRB, PLB, AIS SART, etc.), application (maritime, aviation, outdoor recreation), and technology (satellite-based, radio-based). Companies like Weems & Plath, Life Support International (LSI), Revere Survival, Ikaros, Daniamant, and Pirotec are key players competing in this dynamic market, constantly innovating and developing new features to cater to the evolving needs of end-users.
The market's growth trajectory is influenced by several factors. While increasing adoption across diverse sectors contributes positively, certain restraints, such as high initial investment costs and the need for regular maintenance, could potentially hinder growth to some degree. However, the long-term benefits of enhanced safety and compliance with regulations outweigh these challenges. The regional distribution of the market is expected to vary depending on factors such as economic development, maritime activity, and regulatory frameworks. North America and Europe are likely to maintain significant market shares due to strong regulatory enforcement and high technological adoption. Emerging economies in Asia-Pacific are expected to witness considerable growth due to the increasing maritime trade and tourism activities in the region. The overall market outlook remains positive, with continuous innovation and growing awareness of safety protocols driving further expansion in the coming years.
Distress Signal Device Market Report: 2019-2033
This comprehensive report provides an in-depth analysis of the Distress Signal Device market, encompassing market dynamics, growth trends, regional dominance, product landscape, key players, and future outlook. The study period covers 2019-2033, with a base year of 2025 and a forecast period of 2025-2033. The report caters to industry professionals, investors, and strategic decision-makers seeking a clear understanding of this crucial safety and maritime technology sector. The parent market is safety and security equipment, and the child market is maritime safety equipment. The report projects xx million units in market size for 2025.
Distress Signal Device Market Dynamics & Structure
This section analyzes the competitive landscape of the Distress Signal Device market, focusing on market concentration, innovation drivers, regulatory frameworks, and market dynamics. The global market is characterized by a moderately concentrated structure, with key players like Weems & Plath, Life Support International (LSI), Revere Survival, Ikaros, Daniamant, and Pirotec holding significant market shares. However, the entry of new players with innovative technologies is expected to increase competition.
- Market Concentration: The top 6 players hold an estimated xx% market share in 2025.
- Technological Innovation: Ongoing R&D focuses on improving battery life, enhancing signal transmission, integrating GPS technology, and developing smaller, more robust devices.
- Regulatory Frameworks: International maritime organizations (IMO) regulations significantly influence product standards and adoption. Compliance requirements are a key driver of market growth.
- Competitive Substitutes: Alternative communication technologies, such as satellite phones, pose a competitive threat, but distress signal devices maintain their niche due to dedicated functionality and reliability in emergencies.
- End-User Demographics: The primary end-users include commercial shipping, fishing vessels, recreational boats, and military operations. Growth is driven by increasing regulatory mandates and heightened safety awareness across these segments.
- M&A Trends: Consolidation within the industry is expected to continue, with larger companies acquiring smaller firms to expand their product portfolios and market reach. An estimated xx M&A deals are projected between 2025 and 2033.
Distress Signal Device Growth Trends & Insights
The Distress Signal Device market is projected to experience robust growth over the forecast period, driven by increasing demand from various sectors and technological advancements. The market size is expected to reach xx million units by 2033, with a CAGR of xx% from 2025 to 2033. This growth is fueled by stringent safety regulations, rising awareness of maritime safety, technological innovations, and expanding applications across different industries. Adoption rates are particularly high in regions with significant maritime activities and strict regulatory enforcement. Consumer behavior shifts toward prioritizing safety and reliability are further bolstering demand. Technological disruptions, such as the integration of IoT and AI capabilities, are expected to further enhance the functionality and efficiency of distress signal devices.
Dominant Regions, Countries, or Segments in Distress Signal Device
North America and Europe currently hold the largest market share due to stringent safety regulations and a high concentration of maritime activities. However, the Asia-Pacific region is poised for significant growth due to rapid economic development, increasing maritime trade, and government initiatives focused on improving maritime safety.
- Key Drivers in North America: Strong regulatory frameworks, robust economies, and advanced technological infrastructure.
- Key Drivers in Europe: Similar to North America, stringent regulations and established maritime sectors drive demand.
- Key Drivers in Asia-Pacific: Rapid economic growth, increasing maritime trade, and government investments in maritime infrastructure.
- Market Share: North America holds an estimated xx% market share in 2025, followed by Europe (xx%) and Asia-Pacific (xx%).
Distress Signal Device Product Landscape
Distress signal devices encompass a range of technologies, including EPIRBs (Emergency Position Indicating Radio Beacons), PLBs (Personal Locator Beacons), and AIS (Automatic Identification System) transponders. Recent innovations focus on miniaturization, enhanced battery life, improved signal strength, and integration of GPS and other technologies for more precise location tracking and faster response times. These advancements provide unique selling propositions such as enhanced reliability, improved ease of use, and extended operational capabilities.
Key Drivers, Barriers & Challenges in Distress Signal Device
Key Drivers:
- Stringent maritime safety regulations globally.
- Increasing awareness of maritime safety among vessel operators and governments.
- Technological advancements leading to improved device capabilities.
- Growing demand from both commercial and recreational maritime sectors.
Key Challenges:
- High initial investment costs for advanced devices can deter some smaller operators.
- Maintaining device functionality and battery life in harsh maritime environments poses a challenge.
- Potential for interference and signal limitations in certain geographic locations.
- The complexity of regulatory compliance across different jurisdictions represents a significant hurdle for manufacturers.
Emerging Opportunities in Distress Signal Device
The market presents opportunities in integrating distress signal devices with other technologies, such as IoT sensors and AI-powered analytics, to provide real-time data and predictive maintenance capabilities. Untapped markets in developing economies with growing maritime sectors also offer considerable potential. Furthermore, the increasing demand for integrated safety systems on vessels creates opportunities for bundled solutions incorporating distress signal devices with other safety equipment.
Growth Accelerators in the Distress Signal Device Industry
Technological advancements, strategic partnerships among manufacturers and technology providers, and expansion into new geographic markets are significant catalysts for long-term growth. The development of more robust, cost-effective, and user-friendly devices will further expand market penetration. Strategic alliances with telecommunication providers and integration with existing vessel management systems will improve operational efficiency and user experience.
Key Players Shaping the Distress Signal Device Market
- Weems & Plath
- Life Support International (LSI)
- Revere Survival
- Ikaros
- Daniamant
- Pirotec
Notable Milestones in Distress Signal Device Sector
- 2020: Introduction of a new generation of EPIRBs with extended battery life and improved signal strength by Weems & Plath.
- 2022: Life Support International (LSI) launched a new PLB integrated with satellite communication.
- 2023: New IMO regulations regarding the mandatory use of certain distress signal devices came into effect. (Specific regulations would be detailed in the full report).
In-Depth Distress Signal Device Market Outlook
The Distress Signal Device market is poised for continued expansion, driven by the sustained growth in maritime activities and technological advancements leading to more robust and reliable devices. Strategic partnerships, technological integrations, and expansion into untapped markets will be crucial for achieving long-term success in this dynamic industry. The market’s future potential is significant, promising substantial opportunities for companies that can effectively innovate, adapt to evolving regulations, and cater to the diverse needs of their target markets.
Distress Signal Device Segmentation
-
1. Application
- 1.1. Ocean
- 1.2. Mountain Climbing
- 1.3. Ski
- 1.4. Canoeing
- 1.5. Adventure
- 1.6. Other
-
2. Types
- 2.1. Lithium Batteries
- 2.2. Alkaline Batteries
Distress Signal Device Segmentation By Geography
-
1. North America
- 1.1. United States
- 1.2. Canada
- 1.3. Mexico
-
2. South America
- 2.1. Brazil
- 2.2. Argentina
- 2.3. Rest of South America
-
3. Europe
- 3.1. United Kingdom
- 3.2. Germany
- 3.3. France
- 3.4. Italy
- 3.5. Spain
- 3.6. Russia
- 3.7. Benelux
- 3.8. Nordics
- 3.9. Rest of Europe
-
4. Middle East & Africa
- 4.1. Turkey
- 4.2. Israel
- 4.3. GCC
- 4.4. North Africa
- 4.5. South Africa
- 4.6. Rest of Middle East & Africa
-
5. Asia Pacific
- 5.1. China
- 5.2. India
- 5.3. Japan
- 5.4. South Korea
- 5.5. ASEAN
- 5.6. Oceania
- 5.7. Rest of Asia Pacific

Distress Signal Device REPORT HIGHLIGHTS
| Aspects | Details |
|---|---|
| Study Period | 2019-2033 |
| Base Year | 2024 |
| Estimated Year | 2025 |
| Forecast Period | 2025-2033 |
| Historical Period | 2019-2024 |
| Growth Rate | CAGR of XX% from 2019-2033 |
| Segmentation |
|
Table of Contents
- 1. Introduction
- 1.1. Research Scope
- 1.2. Market Segmentation
- 1.3. Research Methodology
- 1.4. Definitions and Assumptions
- 2. Executive Summary
- 2.1. Introduction
- 3. Market Dynamics
- 3.1. Introduction
- 3.2. Market Drivers
- 3.3. Market Restrains
- 3.4. Market Trends
- 4. Market Factor Analysis
- 4.1. Porters Five Forces
- 4.2. Supply/Value Chain
- 4.3. PESTEL analysis
- 4.4. Market Entropy
- 4.5. Patent/Trademark Analysis
- 5. Global Distress Signal Device Analysis, Insights and Forecast, 2019-2031
- 5.1. Market Analysis, Insights and Forecast - by Application
- 5.1.1. Ocean
- 5.1.2. Mountain Climbing
- 5.1.3. Ski
- 5.1.4. Canoeing
- 5.1.5. Adventure
- 5.1.6. Other
- 5.2. Market Analysis, Insights and Forecast - by Types
- 5.2.1. Lithium Batteries
- 5.2.2. Alkaline Batteries
- 5.3. Market Analysis, Insights and Forecast - by Region
- 5.3.1. North America
- 5.3.2. South America
- 5.3.3. Europe
- 5.3.4. Middle East & Africa
- 5.3.5. Asia Pacific
- 5.1. Market Analysis, Insights and Forecast - by Application
- 6. North America Distress Signal Device Analysis, Insights and Forecast, 2019-2031
- 6.1. Market Analysis, Insights and Forecast - by Application
- 6.1.1. Ocean
- 6.1.2. Mountain Climbing
- 6.1.3. Ski
- 6.1.4. Canoeing
- 6.1.5. Adventure
- 6.1.6. Other
- 6.2. Market Analysis, Insights and Forecast - by Types
- 6.2.1. Lithium Batteries
- 6.2.2. Alkaline Batteries
- 6.1. Market Analysis, Insights and Forecast - by Application
- 7. South America Distress Signal Device Analysis, Insights and Forecast, 2019-2031
- 7.1. Market Analysis, Insights and Forecast - by Application
- 7.1.1. Ocean
- 7.1.2. Mountain Climbing
- 7.1.3. Ski
- 7.1.4. Canoeing
- 7.1.5. Adventure
- 7.1.6. Other
- 7.2. Market Analysis, Insights and Forecast - by Types
- 7.2.1. Lithium Batteries
- 7.2.2. Alkaline Batteries
- 7.1. Market Analysis, Insights and Forecast - by Application
- 8. Europe Distress Signal Device Analysis, Insights and Forecast, 2019-2031
- 8.1. Market Analysis, Insights and Forecast - by Application
- 8.1.1. Ocean
- 8.1.2. Mountain Climbing
- 8.1.3. Ski
- 8.1.4. Canoeing
- 8.1.5. Adventure
- 8.1.6. Other
- 8.2. Market Analysis, Insights and Forecast - by Types
- 8.2.1. Lithium Batteries
- 8.2.2. Alkaline Batteries
- 8.1. Market Analysis, Insights and Forecast - by Application
- 9. Middle East & Africa Distress Signal Device Analysis, Insights and Forecast, 2019-2031
- 9.1. Market Analysis, Insights and Forecast - by Application
- 9.1.1. Ocean
- 9.1.2. Mountain Climbing
- 9.1.3. Ski
- 9.1.4. Canoeing
- 9.1.5. Adventure
- 9.1.6. Other
- 9.2. Market Analysis, Insights and Forecast - by Types
- 9.2.1. Lithium Batteries
- 9.2.2. Alkaline Batteries
- 9.1. Market Analysis, Insights and Forecast - by Application
- 10. Asia Pacific Distress Signal Device Analysis, Insights and Forecast, 2019-2031
- 10.1. Market Analysis, Insights and Forecast - by Application
- 10.1.1. Ocean
- 10.1.2. Mountain Climbing
- 10.1.3. Ski
- 10.1.4. Canoeing
- 10.1.5. Adventure
- 10.1.6. Other
- 10.2. Market Analysis, Insights and Forecast - by Types
- 10.2.1. Lithium Batteries
- 10.2.2. Alkaline Batteries
- 10.1. Market Analysis, Insights and Forecast - by Application
- 11. Competitive Analysis
- 11.1. Global Market Share Analysis 2024
- 11.2. Company Profiles
- 11.2.1 Weems&Plath
- 11.2.1.1. Overview
- 11.2.1.2. Products
- 11.2.1.3. SWOT Analysis
- 11.2.1.4. Recent Developments
- 11.2.1.5. Financials (Based on Availability)
- 11.2.2 Life Support International(LSI)
- 11.2.2.1. Overview
- 11.2.2.2. Products
- 11.2.2.3. SWOT Analysis
- 11.2.2.4. Recent Developments
- 11.2.2.5. Financials (Based on Availability)
- 11.2.3 Revere Survival
- 11.2.3.1. Overview
- 11.2.3.2. Products
- 11.2.3.3. SWOT Analysis
- 11.2.3.4. Recent Developments
- 11.2.3.5. Financials (Based on Availability)
- 11.2.4 Ikaros
- 11.2.4.1. Overview
- 11.2.4.2. Products
- 11.2.4.3. SWOT Analysis
- 11.2.4.4. Recent Developments
- 11.2.4.5. Financials (Based on Availability)
- 11.2.5 Daniamant
- 11.2.5.1. Overview
- 11.2.5.2. Products
- 11.2.5.3. SWOT Analysis
- 11.2.5.4. Recent Developments
- 11.2.5.5. Financials (Based on Availability)
- 11.2.6 Pirotec
- 11.2.6.1. Overview
- 11.2.6.2. Products
- 11.2.6.3. SWOT Analysis
- 11.2.6.4. Recent Developments
- 11.2.6.5. Financials (Based on Availability)
- 11.2.1 Weems&Plath
List of Figures
- Figure 1: Global Distress Signal Device Revenue Breakdown (million, %) by Region 2024 & 2032
- Figure 2: Global Distress Signal Device Volume Breakdown (K, %) by Region 2024 & 2032
- Figure 3: North America Distress Signal Device Revenue (million), by Application 2024 & 2032
- Figure 4: North America Distress Signal Device Volume (K), by Application 2024 & 2032
- Figure 5: North America Distress Signal Device Revenue Share (%), by Application 2024 & 2032
- Figure 6: North America Distress Signal Device Volume Share (%), by Application 2024 & 2032
- Figure 7: North America Distress Signal Device Revenue (million), by Types 2024 & 2032
- Figure 8: North America Distress Signal Device Volume (K), by Types 2024 & 2032
- Figure 9: North America Distress Signal Device Revenue Share (%), by Types 2024 & 2032
- Figure 10: North America Distress Signal Device Volume Share (%), by Types 2024 & 2032
- Figure 11: North America Distress Signal Device Revenue (million), by Country 2024 & 2032
- Figure 12: North America Distress Signal Device Volume (K), by Country 2024 & 2032
- Figure 13: North America Distress Signal Device Revenue Share (%), by Country 2024 & 2032
- Figure 14: North America Distress Signal Device Volume Share (%), by Country 2024 & 2032
- Figure 15: South America Distress Signal Device Revenue (million), by Application 2024 & 2032
- Figure 16: South America Distress Signal Device Volume (K), by Application 2024 & 2032
- Figure 17: South America Distress Signal Device Revenue Share (%), by Application 2024 & 2032
- Figure 18: South America Distress Signal Device Volume Share (%), by Application 2024 & 2032
- Figure 19: South America Distress Signal Device Revenue (million), by Types 2024 & 2032
- Figure 20: South America Distress Signal Device Volume (K), by Types 2024 & 2032
- Figure 21: South America Distress Signal Device Revenue Share (%), by Types 2024 & 2032
- Figure 22: South America Distress Signal Device Volume Share (%), by Types 2024 & 2032
- Figure 23: South America Distress Signal Device Revenue (million), by Country 2024 & 2032
- Figure 24: South America Distress Signal Device Volume (K), by Country 2024 & 2032
- Figure 25: South America Distress Signal Device Revenue Share (%), by Country 2024 & 2032
- Figure 26: South America Distress Signal Device Volume Share (%), by Country 2024 & 2032
- Figure 27: Europe Distress Signal Device Revenue (million), by Application 2024 & 2032
- Figure 28: Europe Distress Signal Device Volume (K), by Application 2024 & 2032
- Figure 29: Europe Distress Signal Device Revenue Share (%), by Application 2024 & 2032
- Figure 30: Europe Distress Signal Device Volume Share (%), by Application 2024 & 2032
- Figure 31: Europe Distress Signal Device Revenue (million), by Types 2024 & 2032
- Figure 32: Europe Distress Signal Device Volume (K), by Types 2024 & 2032
- Figure 33: Europe Distress Signal Device Revenue Share (%), by Types 2024 & 2032
- Figure 34: Europe Distress Signal Device Volume Share (%), by Types 2024 & 2032
- Figure 35: Europe Distress Signal Device Revenue (million), by Country 2024 & 2032
- Figure 36: Europe Distress Signal Device Volume (K), by Country 2024 & 2032
- Figure 37: Europe Distress Signal Device Revenue Share (%), by Country 2024 & 2032
- Figure 38: Europe Distress Signal Device Volume Share (%), by Country 2024 & 2032
- Figure 39: Middle East & Africa Distress Signal Device Revenue (million), by Application 2024 & 2032
- Figure 40: Middle East & Africa Distress Signal Device Volume (K), by Application 2024 & 2032
- Figure 41: Middle East & Africa Distress Signal Device Revenue Share (%), by Application 2024 & 2032
- Figure 42: Middle East & Africa Distress Signal Device Volume Share (%), by Application 2024 & 2032
- Figure 43: Middle East & Africa Distress Signal Device Revenue (million), by Types 2024 & 2032
- Figure 44: Middle East & Africa Distress Signal Device Volume (K), by Types 2024 & 2032
- Figure 45: Middle East & Africa Distress Signal Device Revenue Share (%), by Types 2024 & 2032
- Figure 46: Middle East & Africa Distress Signal Device Volume Share (%), by Types 2024 & 2032
- Figure 47: Middle East & Africa Distress Signal Device Revenue (million), by Country 2024 & 2032
- Figure 48: Middle East & Africa Distress Signal Device Volume (K), by Country 2024 & 2032
- Figure 49: Middle East & Africa Distress Signal Device Revenue Share (%), by Country 2024 & 2032
- Figure 50: Middle East & Africa Distress Signal Device Volume Share (%), by Country 2024 & 2032
- Figure 51: Asia Pacific Distress Signal Device Revenue (million), by Application 2024 & 2032
- Figure 52: Asia Pacific Distress Signal Device Volume (K), by Application 2024 & 2032
- Figure 53: Asia Pacific Distress Signal Device Revenue Share (%), by Application 2024 & 2032
- Figure 54: Asia Pacific Distress Signal Device Volume Share (%), by Application 2024 & 2032
- Figure 55: Asia Pacific Distress Signal Device Revenue (million), by Types 2024 & 2032
- Figure 56: Asia Pacific Distress Signal Device Volume (K), by Types 2024 & 2032
- Figure 57: Asia Pacific Distress Signal Device Revenue Share (%), by Types 2024 & 2032
- Figure 58: Asia Pacific Distress Signal Device Volume Share (%), by Types 2024 & 2032
- Figure 59: Asia Pacific Distress Signal Device Revenue (million), by Country 2024 & 2032
- Figure 60: Asia Pacific Distress Signal Device Volume (K), by Country 2024 & 2032
- Figure 61: Asia Pacific Distress Signal Device Revenue Share (%), by Country 2024 & 2032
- Figure 62: Asia Pacific Distress Signal Device Volume Share (%), by Country 2024 & 2032
List of Tables
- Table 1: Global Distress Signal Device Revenue million Forecast, by Region 2019 & 2032
- Table 2: Global Distress Signal Device Volume K Forecast, by Region 2019 & 2032
- Table 3: Global Distress Signal Device Revenue million Forecast, by Application 2019 & 2032
- Table 4: Global Distress Signal Device Volume K Forecast, by Application 2019 & 2032
- Table 5: Global Distress Signal Device Revenue million Forecast, by Types 2019 & 2032
- Table 6: Global Distress Signal Device Volume K Forecast, by Types 2019 & 2032
- Table 7: Global Distress Signal Device Revenue million Forecast, by Region 2019 & 2032
- Table 8: Global Distress Signal Device Volume K Forecast, by Region 2019 & 2032
- Table 9: Global Distress Signal Device Revenue million Forecast, by Application 2019 & 2032
- Table 10: Global Distress Signal Device Volume K Forecast, by Application 2019 & 2032
- Table 11: Global Distress Signal Device Revenue million Forecast, by Types 2019 & 2032
- Table 12: Global Distress Signal Device Volume K Forecast, by Types 2019 & 2032
- Table 13: Global Distress Signal Device Revenue million Forecast, by Country 2019 & 2032
- Table 14: Global Distress Signal Device Volume K Forecast, by Country 2019 & 2032
- Table 15: United States Distress Signal Device Revenue (million) Forecast, by Application 2019 & 2032
- Table 16: United States Distress Signal Device Volume (K) Forecast, by Application 2019 & 2032
- Table 17: Canada Distress Signal Device Revenue (million) Forecast, by Application 2019 & 2032
- Table 18: Canada Distress Signal Device Volume (K) Forecast, by Application 2019 & 2032
- Table 19: Mexico Distress Signal Device Revenue (million) Forecast, by Application 2019 & 2032
- Table 20: Mexico Distress Signal Device Volume (K) Forecast, by Application 2019 & 2032
- Table 21: Global Distress Signal Device Revenue million Forecast, by Application 2019 & 2032
- Table 22: Global Distress Signal Device Volume K Forecast, by Application 2019 & 2032
- Table 23: Global Distress Signal Device Revenue million Forecast, by Types 2019 & 2032
- Table 24: Global Distress Signal Device Volume K Forecast, by Types 2019 & 2032
- Table 25: Global Distress Signal Device Revenue million Forecast, by Country 2019 & 2032
- Table 26: Global Distress Signal Device Volume K Forecast, by Country 2019 & 2032
- Table 27: Brazil Distress Signal Device Revenue (million) Forecast, by Application 2019 & 2032
- Table 28: Brazil Distress Signal Device Volume (K) Forecast, by Application 2019 & 2032
- Table 29: Argentina Distress Signal Device Revenue (million) Forecast, by Application 2019 & 2032
- Table 30: Argentina Distress Signal Device Volume (K) Forecast, by Application 2019 & 2032
- Table 31: Rest of South America Distress Signal Device Revenue (million) Forecast, by Application 2019 & 2032
- Table 32: Rest of South America Distress Signal Device Volume (K) Forecast, by Application 2019 & 2032
- Table 33: Global Distress Signal Device Revenue million Forecast, by Application 2019 & 2032
- Table 34: Global Distress Signal Device Volume K Forecast, by Application 2019 & 2032
- Table 35: Global Distress Signal Device Revenue million Forecast, by Types 2019 & 2032
- Table 36: Global Distress Signal Device Volume K Forecast, by Types 2019 & 2032
- Table 37: Global Distress Signal Device Revenue million Forecast, by Country 2019 & 2032
- Table 38: Global Distress Signal Device Volume K Forecast, by Country 2019 & 2032
- Table 39: United Kingdom Distress Signal Device Revenue (million) Forecast, by Application 2019 & 2032
- Table 40: United Kingdom Distress Signal Device Volume (K) Forecast, by Application 2019 & 2032
- Table 41: Germany Distress Signal Device Revenue (million) Forecast, by Application 2019 & 2032
- Table 42: Germany Distress Signal Device Volume (K) Forecast, by Application 2019 & 2032
- Table 43: France Distress Signal Device Revenue (million) Forecast, by Application 2019 & 2032
- Table 44: France Distress Signal Device Volume (K) Forecast, by Application 2019 & 2032
- Table 45: Italy Distress Signal Device Revenue (million) Forecast, by Application 2019 & 2032
- Table 46: Italy Distress Signal Device Volume (K) Forecast, by Application 2019 & 2032
- Table 47: Spain Distress Signal Device Revenue (million) Forecast, by Application 2019 & 2032
- Table 48: Spain Distress Signal Device Volume (K) Forecast, by Application 2019 & 2032
- Table 49: Russia Distress Signal Device Revenue (million) Forecast, by Application 2019 & 2032
- Table 50: Russia Distress Signal Device Volume (K) Forecast, by Application 2019 & 2032
- Table 51: Benelux Distress Signal Device Revenue (million) Forecast, by Application 2019 & 2032
- Table 52: Benelux Distress Signal Device Volume (K) Forecast, by Application 2019 & 2032
- Table 53: Nordics Distress Signal Device Revenue (million) Forecast, by Application 2019 & 2032
- Table 54: Nordics Distress Signal Device Volume (K) Forecast, by Application 2019 & 2032
- Table 55: Rest of Europe Distress Signal Device Revenue (million) Forecast, by Application 2019 & 2032
- Table 56: Rest of Europe Distress Signal Device Volume (K) Forecast, by Application 2019 & 2032
- Table 57: Global Distress Signal Device Revenue million Forecast, by Application 2019 & 2032
- Table 58: Global Distress Signal Device Volume K Forecast, by Application 2019 & 2032
- Table 59: Global Distress Signal Device Revenue million Forecast, by Types 2019 & 2032
- Table 60: Global Distress Signal Device Volume K Forecast, by Types 2019 & 2032
- Table 61: Global Distress Signal Device Revenue million Forecast, by Country 2019 & 2032
- Table 62: Global Distress Signal Device Volume K Forecast, by Country 2019 & 2032
- Table 63: Turkey Distress Signal Device Revenue (million) Forecast, by Application 2019 & 2032
- Table 64: Turkey Distress Signal Device Volume (K) Forecast, by Application 2019 & 2032
- Table 65: Israel Distress Signal Device Revenue (million) Forecast, by Application 2019 & 2032
- Table 66: Israel Distress Signal Device Volume (K) Forecast, by Application 2019 & 2032
- Table 67: GCC Distress Signal Device Revenue (million) Forecast, by Application 2019 & 2032
- Table 68: GCC Distress Signal Device Volume (K) Forecast, by Application 2019 & 2032
- Table 69: North Africa Distress Signal Device Revenue (million) Forecast, by Application 2019 & 2032
- Table 70: North Africa Distress Signal Device Volume (K) Forecast, by Application 2019 & 2032
- Table 71: South Africa Distress Signal Device Revenue (million) Forecast, by Application 2019 & 2032
- Table 72: South Africa Distress Signal Device Volume (K) Forecast, by Application 2019 & 2032
- Table 73: Rest of Middle East & Africa Distress Signal Device Revenue (million) Forecast, by Application 2019 & 2032
- Table 74: Rest of Middle East & Africa Distress Signal Device Volume (K) Forecast, by Application 2019 & 2032
- Table 75: Global Distress Signal Device Revenue million Forecast, by Application 2019 & 2032
- Table 76: Global Distress Signal Device Volume K Forecast, by Application 2019 & 2032
- Table 77: Global Distress Signal Device Revenue million Forecast, by Types 2019 & 2032
- Table 78: Global Distress Signal Device Volume K Forecast, by Types 2019 & 2032
- Table 79: Global Distress Signal Device Revenue million Forecast, by Country 2019 & 2032
- Table 80: Global Distress Signal Device Volume K Forecast, by Country 2019 & 2032
- Table 81: China Distress Signal Device Revenue (million) Forecast, by Application 2019 & 2032
- Table 82: China Distress Signal Device Volume (K) Forecast, by Application 2019 & 2032
- Table 83: India Distress Signal Device Revenue (million) Forecast, by Application 2019 & 2032
- Table 84: India Distress Signal Device Volume (K) Forecast, by Application 2019 & 2032
- Table 85: Japan Distress Signal Device Revenue (million) Forecast, by Application 2019 & 2032
- Table 86: Japan Distress Signal Device Volume (K) Forecast, by Application 2019 & 2032
- Table 87: South Korea Distress Signal Device Revenue (million) Forecast, by Application 2019 & 2032
- Table 88: South Korea Distress Signal Device Volume (K) Forecast, by Application 2019 & 2032
- Table 89: ASEAN Distress Signal Device Revenue (million) Forecast, by Application 2019 & 2032
- Table 90: ASEAN Distress Signal Device Volume (K) Forecast, by Application 2019 & 2032
- Table 91: Oceania Distress Signal Device Revenue (million) Forecast, by Application 2019 & 2032
- Table 92: Oceania Distress Signal Device Volume (K) Forecast, by Application 2019 & 2032
- Table 93: Rest of Asia Pacific Distress Signal Device Revenue (million) Forecast, by Application 2019 & 2032
- Table 94: Rest of Asia Pacific Distress Signal Device Volume (K) Forecast, by Application 2019 & 2032
Frequently Asked Questions
1. What is the projected Compound Annual Growth Rate (CAGR) of the Distress Signal Device?
The projected CAGR is approximately XX%.
2. Which companies are prominent players in the Distress Signal Device?
Key companies in the market include Weems&Plath, Life Support International(LSI), Revere Survival, Ikaros, Daniamant, Pirotec.
3. What are the main segments of the Distress Signal Device?
The market segments include Application, Types.
4. Can you provide details about the market size?
The market size is estimated to be USD XXX million as of 2022.
5. What are some drivers contributing to market growth?
N/A
6. What are the notable trends driving market growth?
N/A
7. Are there any restraints impacting market growth?
N/A
8. Can you provide examples of recent developments in the market?
N/A
9. What pricing options are available for accessing the report?
Pricing options include single-user, multi-user, and enterprise licenses priced at USD 3350.00, USD 5025.00, and USD 6700.00 respectively.
10. Is the market size provided in terms of value or volume?
The market size is provided in terms of value, measured in million and volume, measured in K.
11. Are there any specific market keywords associated with the report?
Yes, the market keyword associated with the report is "Distress Signal Device," which aids in identifying and referencing the specific market segment covered.
12. How do I determine which pricing option suits my needs best?
The pricing options vary based on user requirements and access needs. Individual users may opt for single-user licenses, while businesses requiring broader access may choose multi-user or enterprise licenses for cost-effective access to the report.
13. Are there any additional resources or data provided in the Distress Signal Device report?
While the report offers comprehensive insights, it's advisable to review the specific contents or supplementary materials provided to ascertain if additional resources or data are available.
14. How can I stay updated on further developments or reports in the Distress Signal Device?
To stay informed about further developments, trends, and reports in the Distress Signal Device, consider subscribing to industry newsletters, following relevant companies and organizations, or regularly checking reputable industry news sources and publications.
Methodology
Step 1 - Identification of Relevant Samples Size from Population Database


Step 2 - Approaches for Defining Global Market Size (Value, Volume* & Price*)

Note*: In applicable scenarios
Step 3 - Data Sources
Primary Research
- Web Analytics
- Survey Reports
- Research Institute
- Latest Research Reports
- Opinion Leaders
Secondary Research
- Annual Reports
- White Paper
- Latest Press Release
- Industry Association
- Paid Database
- Investor Presentations

Step 4 - Data Triangulation
Involves using different sources of information in order to increase the validity of a study
These sources are likely to be stakeholders in a program - participants, other researchers, program staff, other community members, and so on.
Then we put all data in single framework & apply various statistical tools to find out the dynamic on the market.
During the analysis stage, feedback from the stakeholder groups would be compared to determine areas of agreement as well as areas of divergence
