

Key Insights
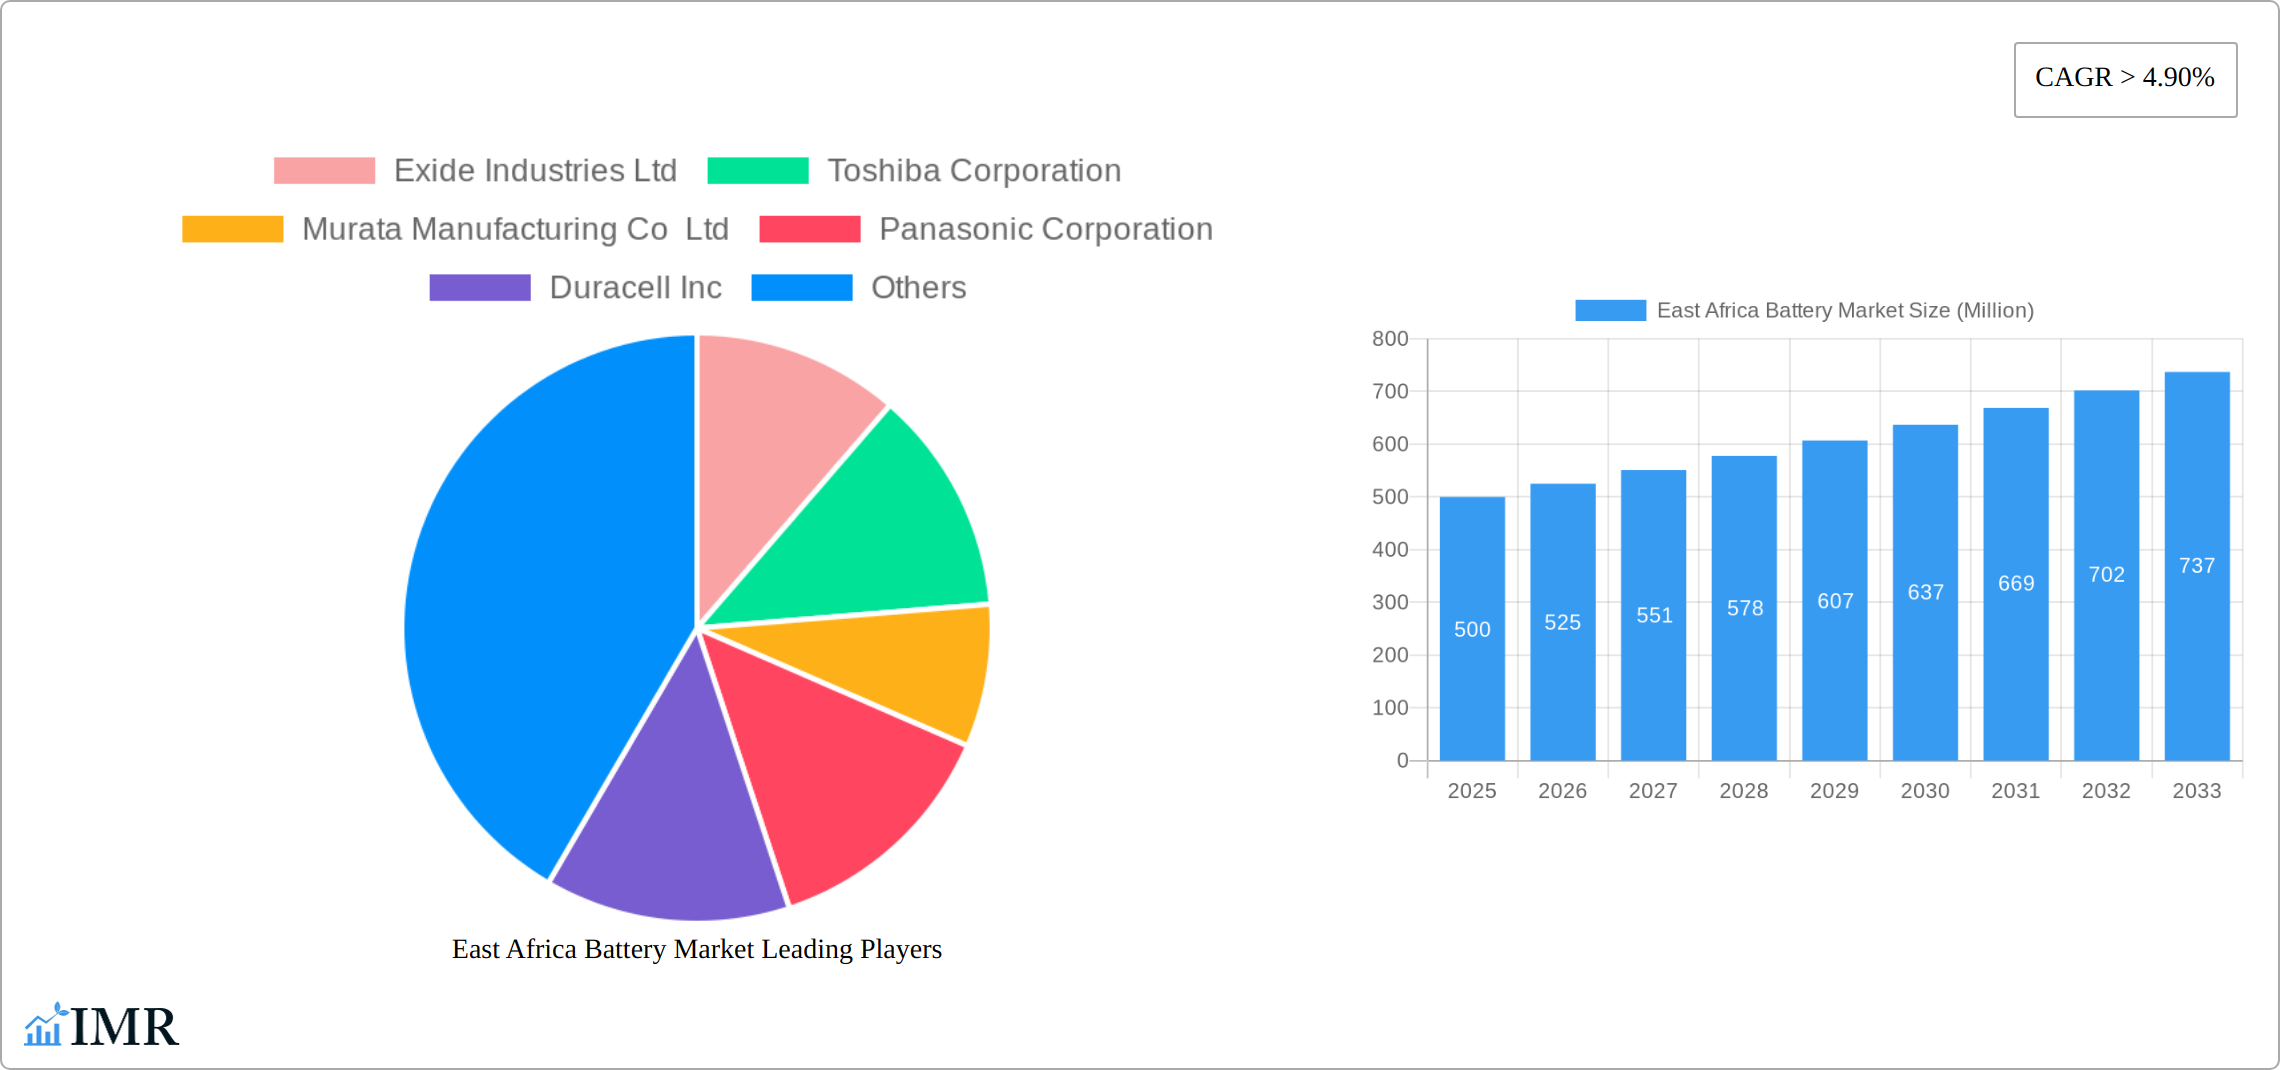
The East African battery market, currently experiencing robust growth, is projected to maintain a Compound Annual Growth Rate (CAGR) exceeding 4.90% from 2025 to 2033. This expansion is fueled by several key factors. The rising adoption of renewable energy sources, such as solar power, necessitates reliable energy storage solutions, significantly boosting demand for batteries. Furthermore, the burgeoning telecommunications sector and increasing urbanization contribute to higher battery consumption in mobile devices, backup power systems, and electric vehicles. Government initiatives promoting sustainable energy and technological advancements are further propelling market growth. However, challenges remain, including inconsistent electricity supply across the region, which limits the effective utilization of renewable energy technologies and creates a strong demand for reliable battery solutions for backup. Price fluctuations in raw materials, particularly lead and lithium, also pose a risk to market stability. Competitive landscape analysis reveals key players like Exide Industries Ltd, Toshiba Corporation, and Panasonic Corporation, alongside regional players such as Uganda Batteries Limited, actively shaping the market dynamics. Segmentation of the market likely includes lead-acid batteries, lithium-ion batteries, and others, with varying market shares depending on application and price sensitivity. The market is expected to see increased product diversification, catering to the specific needs of various sectors.
The forecast period of 2025-2033 anticipates continued market expansion driven by sustained infrastructure development and economic growth across East Africa. The increasing demand for reliable power solutions, coupled with government investment in infrastructure projects, positions the market for further growth. However, the market's trajectory will be significantly influenced by the adoption rate of electric vehicles, the expansion of renewable energy grids, and the overall economic stability of the region. Strategic partnerships between international and local companies are likely to play a crucial role in shaping market leadership and distribution networks. To navigate these dynamics, companies must invest in research and development, exploring cost-effective and environmentally friendly battery technologies to maintain competitiveness and cater to the growing market needs.
East Africa Battery Market: A Comprehensive Market Report (2019-2033)
This in-depth report provides a comprehensive analysis of the East Africa Battery Market, encompassing market dynamics, growth trends, regional dominance, product landscape, key players, and future outlook. The report covers the period 2019-2033, with a focus on the base year 2025 and a forecast period of 2025-2033. The East Africa battery market, encompassing both parent (stationary and automotive) and child markets (lead-acid, lithium-ion, etc.), is poised for significant growth, driven by expanding renewable energy infrastructure and increasing electrification. This report is an indispensable resource for industry professionals, investors, and policymakers seeking to understand and capitalize on opportunities within this dynamic market. The market size is projected to reach xx Million units by 2033.
East Africa Battery Market Dynamics & Structure
The East Africa battery market is characterized by a moderately concentrated landscape, with a mix of international players and local manufacturers. Technological innovation, particularly in lithium-ion battery technology, is a key driver, alongside supportive government policies promoting renewable energy adoption. However, regulatory frameworks concerning battery recycling and waste management present challenges. The market witnesses competition from alternative energy storage solutions, while end-user demographics increasingly favor portable and long-lasting batteries. Mergers and acquisitions (M&A) activity remains moderate, focusing primarily on strategic partnerships and market expansion.
- Market Concentration: Moderately concentrated, with a mix of multinational and local players. The top 5 players hold an estimated xx% market share in 2025.
- Technological Innovation: Significant focus on lithium-ion battery technology, driven by increased energy density and longer lifespan. Barriers include high initial investment costs and limited local manufacturing capacity.
- Regulatory Frameworks: Government policies promoting renewable energy are supportive, however, clear regulations for battery recycling and waste management are needed.
- Competitive Product Substitutes: Alternative energy storage solutions (e.g., flow batteries) represent potential competition.
- End-User Demographics: Growing demand from the telecommunications, transportation and renewable energy sectors drives market expansion.
- M&A Trends: Moderate M&A activity, primarily driven by strategic partnerships for market expansion and technology acquisition. xx M&A deals were recorded between 2019 and 2024.
East Africa Battery Market Growth Trends & Insights
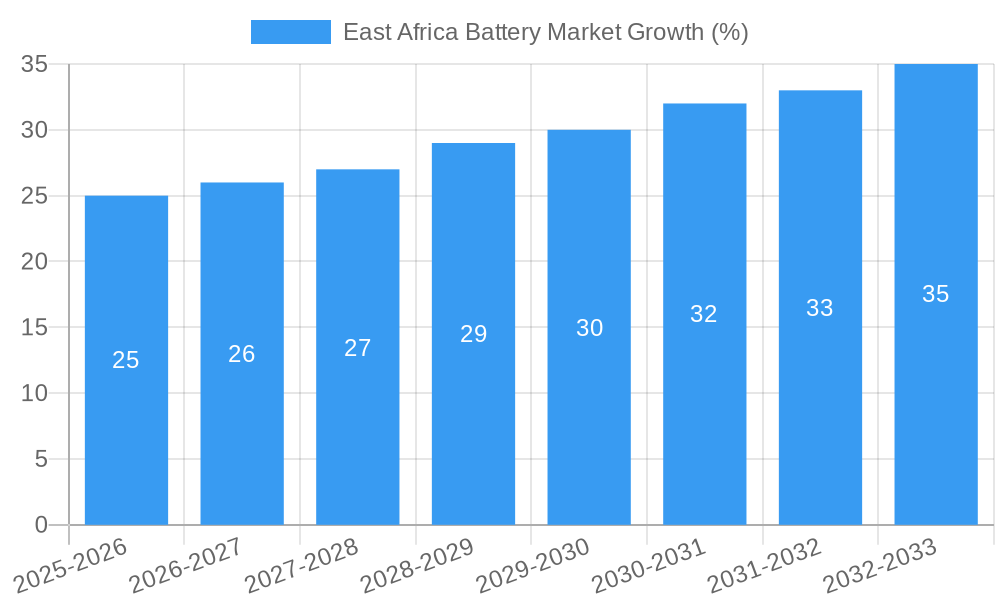
The East Africa battery market exhibits robust growth, driven by several key factors. The increasing adoption of renewable energy technologies, such as solar and wind power, necessitates efficient energy storage solutions, fueling demand for batteries. Furthermore, the expanding telecommunications infrastructure and rising vehicle electrification contribute to market expansion. Technological disruptions, such as advancements in lithium-ion battery technology, are significantly impacting adoption rates. Consumer behavior shifts towards eco-friendly products and longer-lasting power solutions further boost market growth.
The market size is projected to experience a CAGR of xx% during the forecast period (2025-2033). Market penetration is expected to increase from xx% in 2025 to xx% by 2033, driven by factors such as affordability, improved performance, and increasing awareness of sustainability. Specific metrics on CAGR, market penetration, and adoption rates across various segments (e.g., lead-acid vs. lithium-ion) are provided within the full report.
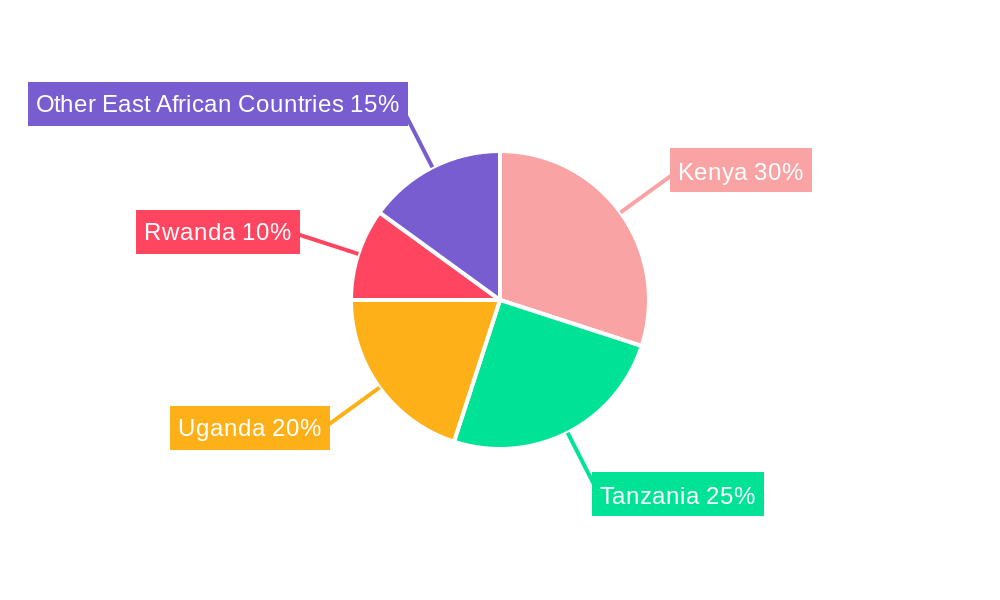
Dominant Regions, Countries, or Segments in East Africa Battery Market
While the entire East Africa region shows growth potential, specific countries and segments display stronger performance. Kenya and Rwanda, for example, lead in renewable energy adoption and infrastructure development, driving significant battery demand. The demand for lithium-ion batteries is rising rapidly, exceeding lead-acid batteries in certain segments (e.g., electric vehicles) due to higher energy density and longer cycle life.
- Key Drivers: Government initiatives promoting renewable energy, expanding telecommunications networks, and investments in electric vehicle infrastructure.
- Dominance Factors: Kenya and Rwanda show strong growth due to favorable government policies and increasing electrification. The lithium-ion segment is expected to surpass lead-acid in terms of market share by 2030, owing to superior performance.
Growth potential is particularly high in rural areas due to the increasing availability of off-grid solar solutions.
East Africa Battery Market Product Landscape
The East Africa battery market features a diverse range of products, including lead-acid, nickel-cadmium, and lithium-ion batteries. Innovations focus on improving energy density, lifespan, and safety features. Lithium-ion batteries are gaining traction due to their superior performance, while lead-acid batteries remain dominant in certain applications due to their cost-effectiveness. Advancements in battery management systems (BMS) are enhancing performance and extending battery life. Unique selling propositions often emphasize durability, reliability, and affordability to target diverse market segments.
Key Drivers, Barriers & Challenges in East Africa Battery Market
Key Drivers:
- Growing demand for renewable energy storage.
- Expanding telecommunications infrastructure.
- Increasing adoption of electric vehicles.
- Government support for renewable energy projects.
Challenges and Restraints:
- High initial investment costs for lithium-ion batteries.
- Limited local manufacturing capacity.
- Inadequate battery recycling infrastructure.
- Competition from alternative energy storage solutions.
- Supply chain disruptions impacting raw material availability and pricing.
Emerging Opportunities in East Africa Battery Market
- Untapped potential in rural electrification projects.
- Growing demand for energy storage in microgrids.
- Increasing adoption of electric two-wheelers.
- Opportunities in battery recycling and second-life applications.
Growth Accelerators in the East Africa Battery Market Industry
Technological breakthroughs in battery chemistry and energy storage technologies, coupled with strategic partnerships between international and local companies, are crucial catalysts for long-term growth. Expansion strategies targeting underserved markets, especially rural areas, will drive market penetration. Government incentives and regulatory frameworks supportive of sustainable energy further accelerate market expansion.
Key Players Shaping the East Africa Battery Market Market
- Exide Industries Ltd
- Toshiba Corporation
- Murata Manufacturing Co Ltd
- Panasonic Corporation
- Duracell Inc
- ABM Group
- Trojan Battery Company
- Uganda Batteries Limited
- Bodawerk International Ltd
- *List Not Exhaustive
Notable Milestones in East Africa Battery Market Sector
- February 2021: Winch Energy's solar mini-grid project in Uganda and Sierra Leone includes 6,000 portable batteries, expanding off-grid electrification.
- December 2021: Development Bank of Rwanda (BRD) plans to develop solar PV and hydro mini-grids with battery storage, boosting renewable energy capacity.
In-Depth East Africa Battery Market Market Outlook
The East Africa battery market is projected for substantial growth driven by several factors, including increased investment in renewable energy infrastructure, expanding electrification across various sectors, and supportive government policies. Strategic partnerships between international and local players, coupled with technological advancements in battery storage, will further accelerate market expansion, creating significant opportunities for both established players and new entrants. The market's long-term potential is considerable, promising substantial returns for investors and stakeholders committed to sustainable energy solutions.
East Africa Battery Market Segmentation
-
1. Type
- 1.1. Primary Battery
- 1.2. Secondary Battery
-
2. Technology
- 2.1. Lithium-ion Battery
- 2.2. Lead-acid Battery
- 2.3. Other Technologies
-
3. Application
- 3.1. Industrial Batteries
- 3.2. Portable Batteries
- 3.3. Other Applications
-
4. Geography
- 4.1. Kenya
- 4.2. Ethiopia
- 4.3. Tanzania
- 4.4. Rest of East Africa
East Africa Battery Market Segmentation By Geography
- 1. Kenya
- 2. Ethiopia
- 3. Tanzania
- 4. Rest of East Africa
East Africa Battery Market REPORT HIGHLIGHTS
| Aspects | Details |
|---|---|
| Study Period | 2019-2033 |
| Base Year | 2024 |
| Estimated Year | 2025 |
| Forecast Period | 2025-2033 |
| Historical Period | 2019-2024 |
| Growth Rate | CAGR of > 4.90% from 2019-2033 |
| Segmentation |
|
Table of Contents
- 1. Introduction
- 1.1. Research Scope
- 1.2. Market Segmentation
- 1.3. Research Methodology
- 1.4. Definitions and Assumptions
- 2. Executive Summary
- 2.1. Introduction
- 3. Market Dynamics
- 3.1. Introduction
- 3.2. Market Drivers
- 3.3. Market Restrains
- 3.4. Market Trends
- 3.4.1. Lithium-ion Battery Segment Expected to be the Fastest-growing Market
- 4. Market Factor Analysis
- 4.1. Porters Five Forces
- 4.2. Supply/Value Chain
- 4.3. PESTEL analysis
- 4.4. Market Entropy
- 4.5. Patent/Trademark Analysis
- 5. Global East Africa Battery Market Analysis, Insights and Forecast, 2019-2031
- 5.1. Market Analysis, Insights and Forecast - by Type
- 5.1.1. Primary Battery
- 5.1.2. Secondary Battery
- 5.2. Market Analysis, Insights and Forecast - by Technology
- 5.2.1. Lithium-ion Battery
- 5.2.2. Lead-acid Battery
- 5.2.3. Other Technologies
- 5.3. Market Analysis, Insights and Forecast - by Application
- 5.3.1. Industrial Batteries
- 5.3.2. Portable Batteries
- 5.3.3. Other Applications
- 5.4. Market Analysis, Insights and Forecast - by Geography
- 5.4.1. Kenya
- 5.4.2. Ethiopia
- 5.4.3. Tanzania
- 5.4.4. Rest of East Africa
- 5.5. Market Analysis, Insights and Forecast - by Region
- 5.5.1. Kenya
- 5.5.2. Ethiopia
- 5.5.3. Tanzania
- 5.5.4. Rest of East Africa
- 5.1. Market Analysis, Insights and Forecast - by Type
- 6. Kenya East Africa Battery Market Analysis, Insights and Forecast, 2019-2031
- 6.1. Market Analysis, Insights and Forecast - by Type
- 6.1.1. Primary Battery
- 6.1.2. Secondary Battery
- 6.2. Market Analysis, Insights and Forecast - by Technology
- 6.2.1. Lithium-ion Battery
- 6.2.2. Lead-acid Battery
- 6.2.3. Other Technologies
- 6.3. Market Analysis, Insights and Forecast - by Application
- 6.3.1. Industrial Batteries
- 6.3.2. Portable Batteries
- 6.3.3. Other Applications
- 6.4. Market Analysis, Insights and Forecast - by Geography
- 6.4.1. Kenya
- 6.4.2. Ethiopia
- 6.4.3. Tanzania
- 6.4.4. Rest of East Africa
- 6.1. Market Analysis, Insights and Forecast - by Type
- 7. Ethiopia East Africa Battery Market Analysis, Insights and Forecast, 2019-2031
- 7.1. Market Analysis, Insights and Forecast - by Type
- 7.1.1. Primary Battery
- 7.1.2. Secondary Battery
- 7.2. Market Analysis, Insights and Forecast - by Technology
- 7.2.1. Lithium-ion Battery
- 7.2.2. Lead-acid Battery
- 7.2.3. Other Technologies
- 7.3. Market Analysis, Insights and Forecast - by Application
- 7.3.1. Industrial Batteries
- 7.3.2. Portable Batteries
- 7.3.3. Other Applications
- 7.4. Market Analysis, Insights and Forecast - by Geography
- 7.4.1. Kenya
- 7.4.2. Ethiopia
- 7.4.3. Tanzania
- 7.4.4. Rest of East Africa
- 7.1. Market Analysis, Insights and Forecast - by Type
- 8. Tanzania East Africa Battery Market Analysis, Insights and Forecast, 2019-2031
- 8.1. Market Analysis, Insights and Forecast - by Type
- 8.1.1. Primary Battery
- 8.1.2. Secondary Battery
- 8.2. Market Analysis, Insights and Forecast - by Technology
- 8.2.1. Lithium-ion Battery
- 8.2.2. Lead-acid Battery
- 8.2.3. Other Technologies
- 8.3. Market Analysis, Insights and Forecast - by Application
- 8.3.1. Industrial Batteries
- 8.3.2. Portable Batteries
- 8.3.3. Other Applications
- 8.4. Market Analysis, Insights and Forecast - by Geography
- 8.4.1. Kenya
- 8.4.2. Ethiopia
- 8.4.3. Tanzania
- 8.4.4. Rest of East Africa
- 8.1. Market Analysis, Insights and Forecast - by Type
- 9. Rest of East Africa East Africa Battery Market Analysis, Insights and Forecast, 2019-2031
- 9.1. Market Analysis, Insights and Forecast - by Type
- 9.1.1. Primary Battery
- 9.1.2. Secondary Battery
- 9.2. Market Analysis, Insights and Forecast - by Technology
- 9.2.1. Lithium-ion Battery
- 9.2.2. Lead-acid Battery
- 9.2.3. Other Technologies
- 9.3. Market Analysis, Insights and Forecast - by Application
- 9.3.1. Industrial Batteries
- 9.3.2. Portable Batteries
- 9.3.3. Other Applications
- 9.4. Market Analysis, Insights and Forecast - by Geography
- 9.4.1. Kenya
- 9.4.2. Ethiopia
- 9.4.3. Tanzania
- 9.4.4. Rest of East Africa
- 9.1. Market Analysis, Insights and Forecast - by Type
- 10. Competitive Analysis
- 10.1. Global Market Share Analysis 2024
- 10.2. Company Profiles
- 10.2.1 Exide Industries Ltd
- 10.2.1.1. Overview
- 10.2.1.2. Products
- 10.2.1.3. SWOT Analysis
- 10.2.1.4. Recent Developments
- 10.2.1.5. Financials (Based on Availability)
- 10.2.2 Toshiba Corporation
- 10.2.2.1. Overview
- 10.2.2.2. Products
- 10.2.2.3. SWOT Analysis
- 10.2.2.4. Recent Developments
- 10.2.2.5. Financials (Based on Availability)
- 10.2.3 Murata Manufacturing Co Ltd
- 10.2.3.1. Overview
- 10.2.3.2. Products
- 10.2.3.3. SWOT Analysis
- 10.2.3.4. Recent Developments
- 10.2.3.5. Financials (Based on Availability)
- 10.2.4 Panasonic Corporation
- 10.2.4.1. Overview
- 10.2.4.2. Products
- 10.2.4.3. SWOT Analysis
- 10.2.4.4. Recent Developments
- 10.2.4.5. Financials (Based on Availability)
- 10.2.5 Duracell Inc
- 10.2.5.1. Overview
- 10.2.5.2. Products
- 10.2.5.3. SWOT Analysis
- 10.2.5.4. Recent Developments
- 10.2.5.5. Financials (Based on Availability)
- 10.2.6 ABM Group
- 10.2.6.1. Overview
- 10.2.6.2. Products
- 10.2.6.3. SWOT Analysis
- 10.2.6.4. Recent Developments
- 10.2.6.5. Financials (Based on Availability)
- 10.2.7 Trojan Battery Company
- 10.2.7.1. Overview
- 10.2.7.2. Products
- 10.2.7.3. SWOT Analysis
- 10.2.7.4. Recent Developments
- 10.2.7.5. Financials (Based on Availability)
- 10.2.8 Uganda Batteries Limited
- 10.2.8.1. Overview
- 10.2.8.2. Products
- 10.2.8.3. SWOT Analysis
- 10.2.8.4. Recent Developments
- 10.2.8.5. Financials (Based on Availability)
- 10.2.9 Bodawerk International Ltd*List Not Exhaustive
- 10.2.9.1. Overview
- 10.2.9.2. Products
- 10.2.9.3. SWOT Analysis
- 10.2.9.4. Recent Developments
- 10.2.9.5. Financials (Based on Availability)
- 10.2.1 Exide Industries Ltd
List of Figures
- Figure 1: Global East Africa Battery Market Revenue Breakdown (Million, %) by Region 2024 & 2032
- Figure 2: Kenya East Africa Battery Market Revenue (Million), by Type 2024 & 2032
- Figure 3: Kenya East Africa Battery Market Revenue Share (%), by Type 2024 & 2032
- Figure 4: Kenya East Africa Battery Market Revenue (Million), by Technology 2024 & 2032
- Figure 5: Kenya East Africa Battery Market Revenue Share (%), by Technology 2024 & 2032
- Figure 6: Kenya East Africa Battery Market Revenue (Million), by Application 2024 & 2032
- Figure 7: Kenya East Africa Battery Market Revenue Share (%), by Application 2024 & 2032
- Figure 8: Kenya East Africa Battery Market Revenue (Million), by Geography 2024 & 2032
- Figure 9: Kenya East Africa Battery Market Revenue Share (%), by Geography 2024 & 2032
- Figure 10: Kenya East Africa Battery Market Revenue (Million), by Country 2024 & 2032
- Figure 11: Kenya East Africa Battery Market Revenue Share (%), by Country 2024 & 2032
- Figure 12: Ethiopia East Africa Battery Market Revenue (Million), by Type 2024 & 2032
- Figure 13: Ethiopia East Africa Battery Market Revenue Share (%), by Type 2024 & 2032
- Figure 14: Ethiopia East Africa Battery Market Revenue (Million), by Technology 2024 & 2032
- Figure 15: Ethiopia East Africa Battery Market Revenue Share (%), by Technology 2024 & 2032
- Figure 16: Ethiopia East Africa Battery Market Revenue (Million), by Application 2024 & 2032
- Figure 17: Ethiopia East Africa Battery Market Revenue Share (%), by Application 2024 & 2032
- Figure 18: Ethiopia East Africa Battery Market Revenue (Million), by Geography 2024 & 2032
- Figure 19: Ethiopia East Africa Battery Market Revenue Share (%), by Geography 2024 & 2032
- Figure 20: Ethiopia East Africa Battery Market Revenue (Million), by Country 2024 & 2032
- Figure 21: Ethiopia East Africa Battery Market Revenue Share (%), by Country 2024 & 2032
- Figure 22: Tanzania East Africa Battery Market Revenue (Million), by Type 2024 & 2032
- Figure 23: Tanzania East Africa Battery Market Revenue Share (%), by Type 2024 & 2032
- Figure 24: Tanzania East Africa Battery Market Revenue (Million), by Technology 2024 & 2032
- Figure 25: Tanzania East Africa Battery Market Revenue Share (%), by Technology 2024 & 2032
- Figure 26: Tanzania East Africa Battery Market Revenue (Million), by Application 2024 & 2032
- Figure 27: Tanzania East Africa Battery Market Revenue Share (%), by Application 2024 & 2032
- Figure 28: Tanzania East Africa Battery Market Revenue (Million), by Geography 2024 & 2032
- Figure 29: Tanzania East Africa Battery Market Revenue Share (%), by Geography 2024 & 2032
- Figure 30: Tanzania East Africa Battery Market Revenue (Million), by Country 2024 & 2032
- Figure 31: Tanzania East Africa Battery Market Revenue Share (%), by Country 2024 & 2032
- Figure 32: Rest of East Africa East Africa Battery Market Revenue (Million), by Type 2024 & 2032
- Figure 33: Rest of East Africa East Africa Battery Market Revenue Share (%), by Type 2024 & 2032
- Figure 34: Rest of East Africa East Africa Battery Market Revenue (Million), by Technology 2024 & 2032
- Figure 35: Rest of East Africa East Africa Battery Market Revenue Share (%), by Technology 2024 & 2032
- Figure 36: Rest of East Africa East Africa Battery Market Revenue (Million), by Application 2024 & 2032
- Figure 37: Rest of East Africa East Africa Battery Market Revenue Share (%), by Application 2024 & 2032
- Figure 38: Rest of East Africa East Africa Battery Market Revenue (Million), by Geography 2024 & 2032
- Figure 39: Rest of East Africa East Africa Battery Market Revenue Share (%), by Geography 2024 & 2032
- Figure 40: Rest of East Africa East Africa Battery Market Revenue (Million), by Country 2024 & 2032
- Figure 41: Rest of East Africa East Africa Battery Market Revenue Share (%), by Country 2024 & 2032
List of Tables
- Table 1: Global East Africa Battery Market Revenue Million Forecast, by Region 2019 & 2032
- Table 2: Global East Africa Battery Market Revenue Million Forecast, by Type 2019 & 2032
- Table 3: Global East Africa Battery Market Revenue Million Forecast, by Technology 2019 & 2032
- Table 4: Global East Africa Battery Market Revenue Million Forecast, by Application 2019 & 2032
- Table 5: Global East Africa Battery Market Revenue Million Forecast, by Geography 2019 & 2032
- Table 6: Global East Africa Battery Market Revenue Million Forecast, by Region 2019 & 2032
- Table 7: Global East Africa Battery Market Revenue Million Forecast, by Type 2019 & 2032
- Table 8: Global East Africa Battery Market Revenue Million Forecast, by Technology 2019 & 2032
- Table 9: Global East Africa Battery Market Revenue Million Forecast, by Application 2019 & 2032
- Table 10: Global East Africa Battery Market Revenue Million Forecast, by Geography 2019 & 2032
- Table 11: Global East Africa Battery Market Revenue Million Forecast, by Country 2019 & 2032
- Table 12: Global East Africa Battery Market Revenue Million Forecast, by Type 2019 & 2032
- Table 13: Global East Africa Battery Market Revenue Million Forecast, by Technology 2019 & 2032
- Table 14: Global East Africa Battery Market Revenue Million Forecast, by Application 2019 & 2032
- Table 15: Global East Africa Battery Market Revenue Million Forecast, by Geography 2019 & 2032
- Table 16: Global East Africa Battery Market Revenue Million Forecast, by Country 2019 & 2032
- Table 17: Global East Africa Battery Market Revenue Million Forecast, by Type 2019 & 2032
- Table 18: Global East Africa Battery Market Revenue Million Forecast, by Technology 2019 & 2032
- Table 19: Global East Africa Battery Market Revenue Million Forecast, by Application 2019 & 2032
- Table 20: Global East Africa Battery Market Revenue Million Forecast, by Geography 2019 & 2032
- Table 21: Global East Africa Battery Market Revenue Million Forecast, by Country 2019 & 2032
- Table 22: Global East Africa Battery Market Revenue Million Forecast, by Type 2019 & 2032
- Table 23: Global East Africa Battery Market Revenue Million Forecast, by Technology 2019 & 2032
- Table 24: Global East Africa Battery Market Revenue Million Forecast, by Application 2019 & 2032
- Table 25: Global East Africa Battery Market Revenue Million Forecast, by Geography 2019 & 2032
- Table 26: Global East Africa Battery Market Revenue Million Forecast, by Country 2019 & 2032
Frequently Asked Questions
1. What is the projected Compound Annual Growth Rate (CAGR) of the East Africa Battery Market?
The projected CAGR is approximately > 4.90%.
2. Which companies are prominent players in the East Africa Battery Market?
Key companies in the market include Exide Industries Ltd, Toshiba Corporation, Murata Manufacturing Co Ltd, Panasonic Corporation, Duracell Inc, ABM Group, Trojan Battery Company, Uganda Batteries Limited, Bodawerk International Ltd*List Not Exhaustive.
3. What are the main segments of the East Africa Battery Market?
The market segments include Type, Technology, Application, Geography.
4. Can you provide details about the market size?
The market size is estimated to be USD XX Million as of 2022.
5. What are some drivers contributing to market growth?
N/A
6. What are the notable trends driving market growth?
Lithium-ion Battery Segment Expected to be the Fastest-growing Market.
7. Are there any restraints impacting market growth?
N/A
8. Can you provide examples of recent developments in the market?
In February 2021, Winch Energy, an off-grid utility provider, completed the funding for solar mini-grid projects in 49 villages across Uganda and Sierra Leone. The project includes 6,000 portable batteries installed through the project to provide people outside of the mini-grid catchment area with clean electricity.
9. What pricing options are available for accessing the report?
Pricing options include single-user, multi-user, and enterprise licenses priced at USD 4750, USD 5250, and USD 8750 respectively.
10. Is the market size provided in terms of value or volume?
The market size is provided in terms of value, measured in Million.
11. Are there any specific market keywords associated with the report?
Yes, the market keyword associated with the report is "East Africa Battery Market," which aids in identifying and referencing the specific market segment covered.
12. How do I determine which pricing option suits my needs best?
The pricing options vary based on user requirements and access needs. Individual users may opt for single-user licenses, while businesses requiring broader access may choose multi-user or enterprise licenses for cost-effective access to the report.
13. Are there any additional resources or data provided in the East Africa Battery Market report?
While the report offers comprehensive insights, it's advisable to review the specific contents or supplementary materials provided to ascertain if additional resources or data are available.
14. How can I stay updated on further developments or reports in the East Africa Battery Market?
To stay informed about further developments, trends, and reports in the East Africa Battery Market, consider subscribing to industry newsletters, following relevant companies and organizations, or regularly checking reputable industry news sources and publications.
Methodology
Step 1 - Identification of Relevant Samples Size from Population Database


Step 2 - Approaches for Defining Global Market Size (Value, Volume* & Price*)

Note*: In applicable scenarios
Step 3 - Data Sources
Primary Research
- Web Analytics
- Survey Reports
- Research Institute
- Latest Research Reports
- Opinion Leaders
Secondary Research
- Annual Reports
- White Paper
- Latest Press Release
- Industry Association
- Paid Database
- Investor Presentations

Step 4 - Data Triangulation
Involves using different sources of information in order to increase the validity of a study
These sources are likely to be stakeholders in a program - participants, other researchers, program staff, other community members, and so on.
Then we put all data in single framework & apply various statistical tools to find out the dynamic on the market.
During the analysis stage, feedback from the stakeholder groups would be compared to determine areas of agreement as well as areas of divergence
