

Key Insights
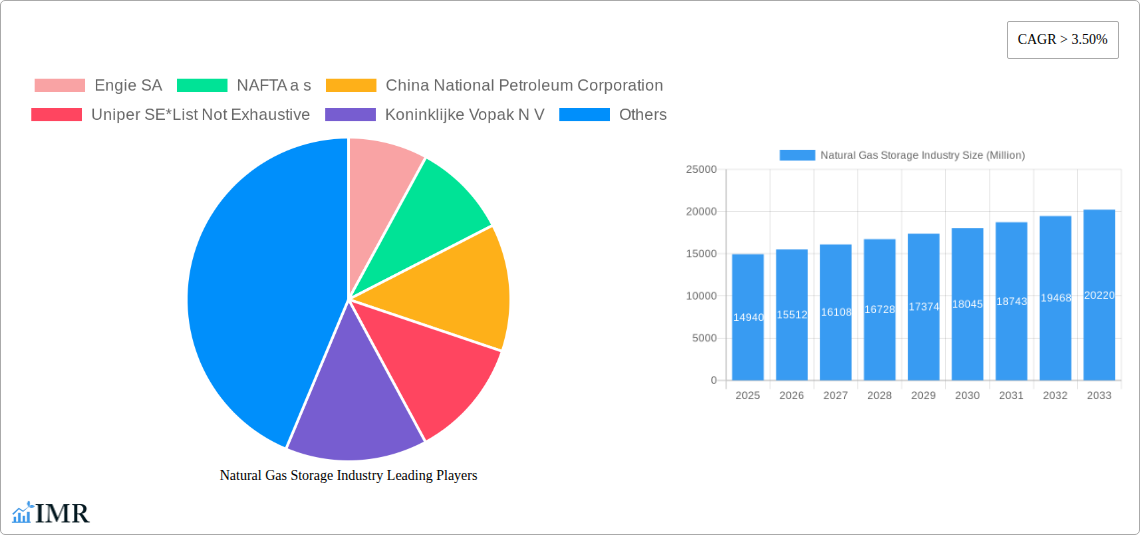
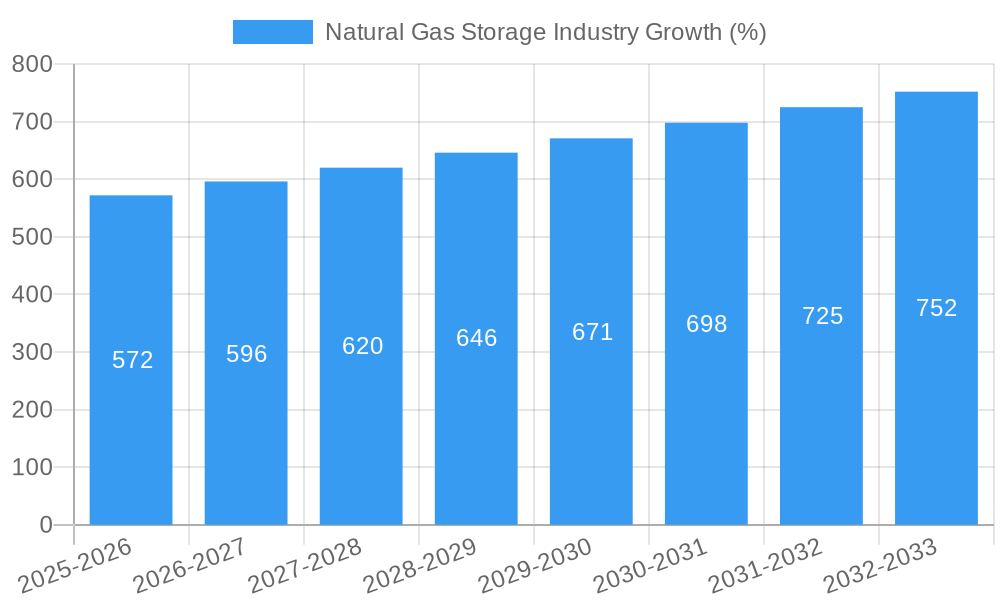
The global natural gas storage market, valued at $14.94 billion in 2025, is projected to experience robust growth, driven by increasing energy demand, particularly in emerging economies, and the need for enhanced energy security. The compound annual growth rate (CAGR) exceeding 3.50% for the forecast period (2025-2033) indicates a significant expansion of the market. This growth is fueled by several key factors. Firstly, the intermittent nature of renewable energy sources like solar and wind necessitates reliable energy storage solutions, making natural gas storage crucial for grid stability and balancing fluctuating energy supplies. Secondly, geopolitical instability and concerns over energy dependence are prompting countries to invest in domestic natural gas storage infrastructure to ensure energy security and reduce reliance on volatile international markets. Furthermore, advancements in storage technologies, such as the development of more efficient and durable underground storage facilities and improved above-ground storage solutions, are contributing to market expansion. The two primary segments, underground and above-ground storage, each represent significant market shares, with underground storage likely dominating due to its larger capacity and lower operational costs. Major players, including Engie SA, NAFTA, China National Petroleum Corporation, and others, are actively investing in expansion and technological upgrades to capitalize on this growth.
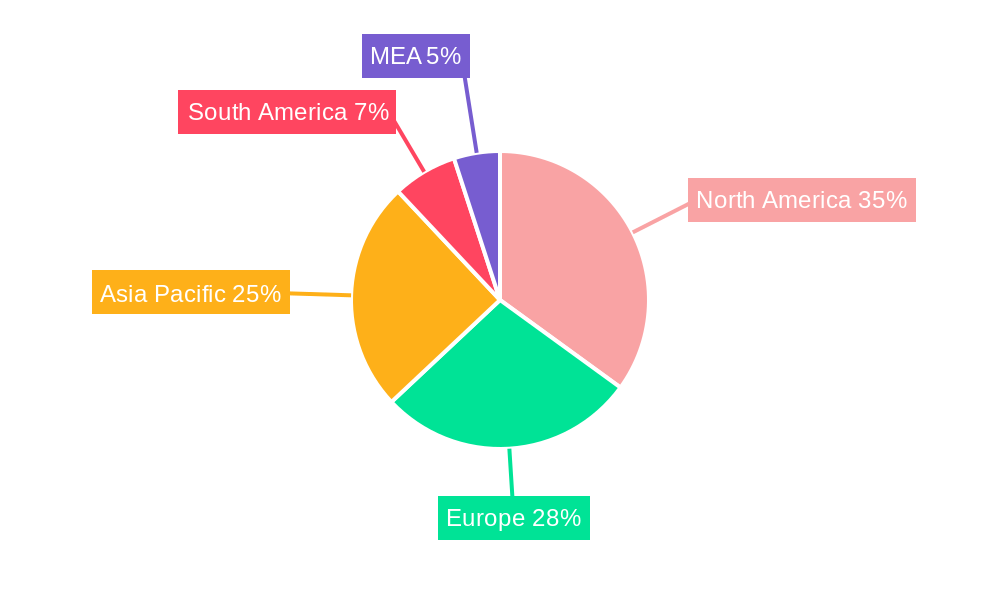
Regional market dynamics are also significant. North America, with its established infrastructure and abundant natural gas reserves, currently holds a considerable market share. However, the Asia-Pacific region, driven by rapid industrialization and rising energy consumption in countries like China and India, is expected to witness the fastest growth in the coming years. Europe, while a mature market, continues to invest in storage infrastructure to diversify its energy sources and strengthen energy independence. The competitive landscape is characterized by both established international players and regional companies, leading to ongoing innovation and market consolidation. The continued focus on sustainable energy practices and the increasing integration of natural gas in a diversified energy mix are expected to further drive growth in the global natural gas storage market throughout the forecast period. Challenges such as high initial investment costs for infrastructure development and environmental concerns related to methane emissions need to be addressed for sustained growth.
Natural Gas Storage Industry: A Comprehensive Market Report (2019-2033)
This comprehensive report provides an in-depth analysis of the global natural gas storage industry, encompassing market dynamics, growth trends, key players, and future outlook. The study period covers 2019-2033, with a base year of 2025 and a forecast period of 2025-2033. The report delves into both parent (Energy Storage) and child (Natural Gas Storage) markets, offering granular insights for informed decision-making.
Natural Gas Storage Industry Market Dynamics & Structure
This section analyzes the market's competitive landscape, focusing on market concentration, technological advancements, regulatory influences, and industry mergers and acquisitions (M&A) activity. The global natural gas storage market reached a value of xx Million in 2024 and is projected to reach xx Million by 2033, exhibiting a CAGR of xx% during the forecast period.
- Market Concentration: The industry displays a moderately concentrated structure with key players holding significant market share. The top five companies collectively account for approximately xx% of the global market share in 2025.
- Technological Innovation: Technological advancements such as improved underground storage techniques and advanced monitoring systems are driving efficiency and capacity expansion. However, high initial investment costs present a barrier to entry for smaller players.
- Regulatory Framework: Government regulations pertaining to safety, environmental impact, and infrastructure development significantly influence market dynamics. Varied regulatory landscapes across different regions create both opportunities and challenges.
- Competitive Substitutes: Other energy storage solutions like pumped hydro storage and battery storage present competitive pressures, impacting market share distribution for natural gas storage.
- End-User Demographics: The primary end-users are power generation companies, industrial consumers, and city gas distribution networks. Demand is driven by fluctuating energy prices and the need for energy security.
- M&A Trends: The industry has witnessed a moderate level of M&A activity in recent years, with larger companies acquiring smaller players to expand their geographical reach and technological capabilities. The total value of M&A deals in the natural gas storage sector from 2019 to 2024 amounted to approximately xx Million.
Natural Gas Storage Industry Growth Trends & Insights
This section provides a detailed analysis of the market size evolution, adoption rates, technological disruptions, and consumer behavior shifts, leveraging proprietary data and industry insights. The global natural gas storage market shows steady growth, driven by factors such as increasing natural gas consumption, energy security concerns, and government initiatives promoting gas storage infrastructure development. The market is further segmented by storage type (underground and above-ground), geographical region, and end-user industry. Detailed analysis of these segments reveals varied growth trajectories and market penetration rates. This section incorporates comprehensive data on CAGR, market penetration, and regional variations in adoption rates to offer a complete picture of market evolution.
Dominant Regions, Countries, or Segments in Natural Gas Storage Industry
North America and Europe currently dominate the natural gas storage market, driven by robust gas infrastructure and established regulatory frameworks. However, Asia-Pacific is projected to experience significant growth due to rapid industrialization and increasing energy demand.
Underground Storage:
- Key Drivers: Established infrastructure, higher storage capacity, and cost-effectiveness compared to above-ground options drive the dominance of underground storage. Government support for infrastructure development further fuels its growth.
- Dominance Factors: Abundance of suitable geological formations in certain regions contributes significantly to its widespread adoption.
Above-Ground Storage:
- Key Drivers: Faster deployment times, lower initial investment costs (though higher operational costs), and suitability for smaller-scale projects are key drivers of above-ground storage adoption.
- Dominance Factors: Above-ground storage finds applications in locations with limited geological suitability for underground facilities. It also facilitates smaller-scale storage solutions for niche industrial users.
Natural Gas Storage Industry Product Landscape
The natural gas storage industry offers a range of solutions, including salt caverns, depleted gas fields, aquifers, and above-ground storage tanks. Recent innovations include advanced monitoring systems, improved safety measures, and the integration of renewable energy sources to enhance efficiency and reduce environmental impact. These innovations are driven by the increasing demand for enhanced reliability, safety, and cost-effectiveness.
Key Drivers, Barriers & Challenges in Natural Gas Storage Industry
Key Drivers:
- Increasing demand for natural gas for power generation and industrial applications.
- Growing emphasis on energy security and reliability.
- Government initiatives and incentives promoting gas storage infrastructure development.
- Technological advancements enhancing efficiency and safety.
Challenges and Restraints:
- High initial capital investment costs for developing new storage facilities, particularly underground storage.
- Environmental concerns related to potential leaks and land use.
- Stringent safety regulations and compliance requirements.
- Competition from alternative energy storage technologies.
Emerging Opportunities in Natural Gas Storage Industry
- Expansion into developing economies with growing energy demand.
- Integration of natural gas storage with renewable energy sources to address intermittency issues.
- Development of innovative storage technologies, such as compressed natural gas (CNG) storage and liquefied natural gas (LNG) storage solutions.
- Development of advanced digital technologies to monitor gas storage efficiency and ensure safety.
Growth Accelerators in the Natural Gas Storage Industry
The long-term growth of the natural gas storage industry will be driven by several factors, including advancements in storage technologies, strategic partnerships between energy companies and storage providers, and increasing government support for infrastructure development. Furthermore, the integration of natural gas storage with renewable energy sources and the adoption of digital technologies to optimize operations will further accelerate market growth.
Key Players Shaping the Natural Gas Storage Industry Market
- Engie SA
- NAFTA a s
- China National Petroleum Corporation
- Uniper SE
- Koninklijke Vopak N V
- Enbridge Inc
- Chiyoda Corporation
- John Wood Group PLC
- Gazprom PAO
- Costain Group PLC
Notable Milestones in Natural Gas Storage Industry Sector
- 2020: Introduction of a new underground storage technology by Company X, increasing storage capacity by xx Million cubic meters.
- 2022: Government of Country Y announces significant investment in expanding national gas storage capacity by xx Million cubic meters.
- 2023: Strategic partnership between Company A and Company B results in the development of a large-scale gas storage facility with a capacity of xx Million cubic meters.
- 2024: Successful completion of a major gas storage expansion project in Region Z, adding xx Million cubic meters of storage capacity.
In-Depth Natural Gas Storage Industry Market Outlook
The future of the natural gas storage industry looks promising, driven by the continuous increase in global natural gas demand and the need for reliable and efficient energy storage solutions. The industry's evolution will be shaped by technological advancements, strategic partnerships, and supportive government policies. Companies that adopt innovative strategies and embrace technological disruptions will be best positioned to capitalize on the significant growth opportunities that lie ahead. The market is expected to witness robust expansion, particularly in developing economies and regions with rapidly growing energy sectors. Strategic partnerships and the development of innovative technologies will be key drivers of this growth.
Natural Gas Storage Industry Segmentation
-
1. Type
- 1.1. Underground Storage
- 1.2. Above-Ground Storage
Natural Gas Storage Industry Segmentation By Geography
- 1. North America
- 2. Europe
- 3. Asia Pacific
- 4. South America
- 5. Middle East and Africa
Natural Gas Storage Industry REPORT HIGHLIGHTS
| Aspects | Details |
|---|---|
| Study Period | 2019-2033 |
| Base Year | 2024 |
| Estimated Year | 2025 |
| Forecast Period | 2025-2033 |
| Historical Period | 2019-2024 |
| Growth Rate | CAGR of > 3.50% from 2019-2033 |
| Segmentation |
|
Table of Contents
- 1. Introduction
- 1.1. Research Scope
- 1.2. Market Segmentation
- 1.3. Research Methodology
- 1.4. Definitions and Assumptions
- 2. Executive Summary
- 2.1. Introduction
- 3. Market Dynamics
- 3.1. Introduction
- 3.2. Market Drivers
- 3.2.1. 4.; Increasing Electricity Demand4.; Rsing Investments in the Coal Industry
- 3.3. Market Restrains
- 3.3.1. 4.; Increasing Installation of Renewable Energy Sources
- 3.4. Market Trends
- 3.4.1. Underground Storage to Dominate the Market
- 4. Market Factor Analysis
- 4.1. Porters Five Forces
- 4.2. Supply/Value Chain
- 4.3. PESTEL analysis
- 4.4. Market Entropy
- 4.5. Patent/Trademark Analysis
- 5. Global Natural Gas Storage Industry Analysis, Insights and Forecast, 2019-2031
- 5.1. Market Analysis, Insights and Forecast - by Type
- 5.1.1. Underground Storage
- 5.1.2. Above-Ground Storage
- 5.2. Market Analysis, Insights and Forecast - by Region
- 5.2.1. North America
- 5.2.2. Europe
- 5.2.3. Asia Pacific
- 5.2.4. South America
- 5.2.5. Middle East and Africa
- 5.1. Market Analysis, Insights and Forecast - by Type
- 6. North America Natural Gas Storage Industry Analysis, Insights and Forecast, 2019-2031
- 6.1. Market Analysis, Insights and Forecast - by Type
- 6.1.1. Underground Storage
- 6.1.2. Above-Ground Storage
- 6.1. Market Analysis, Insights and Forecast - by Type
- 7. Europe Natural Gas Storage Industry Analysis, Insights and Forecast, 2019-2031
- 7.1. Market Analysis, Insights and Forecast - by Type
- 7.1.1. Underground Storage
- 7.1.2. Above-Ground Storage
- 7.1. Market Analysis, Insights and Forecast - by Type
- 8. Asia Pacific Natural Gas Storage Industry Analysis, Insights and Forecast, 2019-2031
- 8.1. Market Analysis, Insights and Forecast - by Type
- 8.1.1. Underground Storage
- 8.1.2. Above-Ground Storage
- 8.1. Market Analysis, Insights and Forecast - by Type
- 9. South America Natural Gas Storage Industry Analysis, Insights and Forecast, 2019-2031
- 9.1. Market Analysis, Insights and Forecast - by Type
- 9.1.1. Underground Storage
- 9.1.2. Above-Ground Storage
- 9.1. Market Analysis, Insights and Forecast - by Type
- 10. Middle East and Africa Natural Gas Storage Industry Analysis, Insights and Forecast, 2019-2031
- 10.1. Market Analysis, Insights and Forecast - by Type
- 10.1.1. Underground Storage
- 10.1.2. Above-Ground Storage
- 10.1. Market Analysis, Insights and Forecast - by Type
- 11. North America Natural Gas Storage Industry Analysis, Insights and Forecast, 2019-2031
- 11.1. Market Analysis, Insights and Forecast - By Country/Sub-region
- 11.1.1 United States
- 11.1.2 Canada
- 11.1.3 Mexico
- 12. Europe Natural Gas Storage Industry Analysis, Insights and Forecast, 2019-2031
- 12.1. Market Analysis, Insights and Forecast - By Country/Sub-region
- 12.1.1 Germany
- 12.1.2 United Kingdom
- 12.1.3 France
- 12.1.4 Spain
- 12.1.5 Italy
- 12.1.6 Spain
- 12.1.7 Belgium
- 12.1.8 Netherland
- 12.1.9 Nordics
- 12.1.10 Rest of Europe
- 13. Asia Pacific Natural Gas Storage Industry Analysis, Insights and Forecast, 2019-2031
- 13.1. Market Analysis, Insights and Forecast - By Country/Sub-region
- 13.1.1 China
- 13.1.2 Japan
- 13.1.3 India
- 13.1.4 South Korea
- 13.1.5 Southeast Asia
- 13.1.6 Australia
- 13.1.7 Indonesia
- 13.1.8 Phillipes
- 13.1.9 Singapore
- 13.1.10 Thailandc
- 13.1.11 Rest of Asia Pacific
- 14. South America Natural Gas Storage Industry Analysis, Insights and Forecast, 2019-2031
- 14.1. Market Analysis, Insights and Forecast - By Country/Sub-region
- 14.1.1 Brazil
- 14.1.2 Argentina
- 14.1.3 Peru
- 14.1.4 Chile
- 14.1.5 Colombia
- 14.1.6 Ecuador
- 14.1.7 Venezuela
- 14.1.8 Rest of South America
- 15. North America Natural Gas Storage Industry Analysis, Insights and Forecast, 2019-2031
- 15.1. Market Analysis, Insights and Forecast - By Country/Sub-region
- 15.1.1 United States
- 15.1.2 Canada
- 15.1.3 Mexico
- 16. MEA Natural Gas Storage Industry Analysis, Insights and Forecast, 2019-2031
- 16.1. Market Analysis, Insights and Forecast - By Country/Sub-region
- 16.1.1 United Arab Emirates
- 16.1.2 Saudi Arabia
- 16.1.3 South Africa
- 16.1.4 Rest of Middle East and Africa
- 17. Competitive Analysis
- 17.1. Global Market Share Analysis 2024
- 17.2. Company Profiles
- 17.2.1 Engie SA
- 17.2.1.1. Overview
- 17.2.1.2. Products
- 17.2.1.3. SWOT Analysis
- 17.2.1.4. Recent Developments
- 17.2.1.5. Financials (Based on Availability)
- 17.2.2 NAFTA a s
- 17.2.2.1. Overview
- 17.2.2.2. Products
- 17.2.2.3. SWOT Analysis
- 17.2.2.4. Recent Developments
- 17.2.2.5. Financials (Based on Availability)
- 17.2.3 China National Petroleum Corporation
- 17.2.3.1. Overview
- 17.2.3.2. Products
- 17.2.3.3. SWOT Analysis
- 17.2.3.4. Recent Developments
- 17.2.3.5. Financials (Based on Availability)
- 17.2.4 Uniper SE*List Not Exhaustive
- 17.2.4.1. Overview
- 17.2.4.2. Products
- 17.2.4.3. SWOT Analysis
- 17.2.4.4. Recent Developments
- 17.2.4.5. Financials (Based on Availability)
- 17.2.5 Koninklijke Vopak N V
- 17.2.5.1. Overview
- 17.2.5.2. Products
- 17.2.5.3. SWOT Analysis
- 17.2.5.4. Recent Developments
- 17.2.5.5. Financials (Based on Availability)
- 17.2.6 Enbridge Inc
- 17.2.6.1. Overview
- 17.2.6.2. Products
- 17.2.6.3. SWOT Analysis
- 17.2.6.4. Recent Developments
- 17.2.6.5. Financials (Based on Availability)
- 17.2.7 Chiyoda Corporation
- 17.2.7.1. Overview
- 17.2.7.2. Products
- 17.2.7.3. SWOT Analysis
- 17.2.7.4. Recent Developments
- 17.2.7.5. Financials (Based on Availability)
- 17.2.8 John Wood Group PLC
- 17.2.8.1. Overview
- 17.2.8.2. Products
- 17.2.8.3. SWOT Analysis
- 17.2.8.4. Recent Developments
- 17.2.8.5. Financials (Based on Availability)
- 17.2.9 Gazprom PAO
- 17.2.9.1. Overview
- 17.2.9.2. Products
- 17.2.9.3. SWOT Analysis
- 17.2.9.4. Recent Developments
- 17.2.9.5. Financials (Based on Availability)
- 17.2.10 Costain Group PLC
- 17.2.10.1. Overview
- 17.2.10.2. Products
- 17.2.10.3. SWOT Analysis
- 17.2.10.4. Recent Developments
- 17.2.10.5. Financials (Based on Availability)
- 17.2.1 Engie SA
List of Figures
- Figure 1: Global Natural Gas Storage Industry Revenue Breakdown (Million, %) by Region 2024 & 2032
- Figure 2: Global Natural Gas Storage Industry Volume Breakdown (K Tons, %) by Region 2024 & 2032
- Figure 3: North America Natural Gas Storage Industry Revenue (Million), by Country 2024 & 2032
- Figure 4: North America Natural Gas Storage Industry Volume (K Tons), by Country 2024 & 2032
- Figure 5: North America Natural Gas Storage Industry Revenue Share (%), by Country 2024 & 2032
- Figure 6: North America Natural Gas Storage Industry Volume Share (%), by Country 2024 & 2032
- Figure 7: Europe Natural Gas Storage Industry Revenue (Million), by Country 2024 & 2032
- Figure 8: Europe Natural Gas Storage Industry Volume (K Tons), by Country 2024 & 2032
- Figure 9: Europe Natural Gas Storage Industry Revenue Share (%), by Country 2024 & 2032
- Figure 10: Europe Natural Gas Storage Industry Volume Share (%), by Country 2024 & 2032
- Figure 11: Asia Pacific Natural Gas Storage Industry Revenue (Million), by Country 2024 & 2032
- Figure 12: Asia Pacific Natural Gas Storage Industry Volume (K Tons), by Country 2024 & 2032
- Figure 13: Asia Pacific Natural Gas Storage Industry Revenue Share (%), by Country 2024 & 2032
- Figure 14: Asia Pacific Natural Gas Storage Industry Volume Share (%), by Country 2024 & 2032
- Figure 15: South America Natural Gas Storage Industry Revenue (Million), by Country 2024 & 2032
- Figure 16: South America Natural Gas Storage Industry Volume (K Tons), by Country 2024 & 2032
- Figure 17: South America Natural Gas Storage Industry Revenue Share (%), by Country 2024 & 2032
- Figure 18: South America Natural Gas Storage Industry Volume Share (%), by Country 2024 & 2032
- Figure 19: North America Natural Gas Storage Industry Revenue (Million), by Country 2024 & 2032
- Figure 20: North America Natural Gas Storage Industry Volume (K Tons), by Country 2024 & 2032
- Figure 21: North America Natural Gas Storage Industry Revenue Share (%), by Country 2024 & 2032
- Figure 22: North America Natural Gas Storage Industry Volume Share (%), by Country 2024 & 2032
- Figure 23: MEA Natural Gas Storage Industry Revenue (Million), by Country 2024 & 2032
- Figure 24: MEA Natural Gas Storage Industry Volume (K Tons), by Country 2024 & 2032
- Figure 25: MEA Natural Gas Storage Industry Revenue Share (%), by Country 2024 & 2032
- Figure 26: MEA Natural Gas Storage Industry Volume Share (%), by Country 2024 & 2032
- Figure 27: North America Natural Gas Storage Industry Revenue (Million), by Type 2024 & 2032
- Figure 28: North America Natural Gas Storage Industry Volume (K Tons), by Type 2024 & 2032
- Figure 29: North America Natural Gas Storage Industry Revenue Share (%), by Type 2024 & 2032
- Figure 30: North America Natural Gas Storage Industry Volume Share (%), by Type 2024 & 2032
- Figure 31: North America Natural Gas Storage Industry Revenue (Million), by Country 2024 & 2032
- Figure 32: North America Natural Gas Storage Industry Volume (K Tons), by Country 2024 & 2032
- Figure 33: North America Natural Gas Storage Industry Revenue Share (%), by Country 2024 & 2032
- Figure 34: North America Natural Gas Storage Industry Volume Share (%), by Country 2024 & 2032
- Figure 35: Europe Natural Gas Storage Industry Revenue (Million), by Type 2024 & 2032
- Figure 36: Europe Natural Gas Storage Industry Volume (K Tons), by Type 2024 & 2032
- Figure 37: Europe Natural Gas Storage Industry Revenue Share (%), by Type 2024 & 2032
- Figure 38: Europe Natural Gas Storage Industry Volume Share (%), by Type 2024 & 2032
- Figure 39: Europe Natural Gas Storage Industry Revenue (Million), by Country 2024 & 2032
- Figure 40: Europe Natural Gas Storage Industry Volume (K Tons), by Country 2024 & 2032
- Figure 41: Europe Natural Gas Storage Industry Revenue Share (%), by Country 2024 & 2032
- Figure 42: Europe Natural Gas Storage Industry Volume Share (%), by Country 2024 & 2032
- Figure 43: Asia Pacific Natural Gas Storage Industry Revenue (Million), by Type 2024 & 2032
- Figure 44: Asia Pacific Natural Gas Storage Industry Volume (K Tons), by Type 2024 & 2032
- Figure 45: Asia Pacific Natural Gas Storage Industry Revenue Share (%), by Type 2024 & 2032
- Figure 46: Asia Pacific Natural Gas Storage Industry Volume Share (%), by Type 2024 & 2032
- Figure 47: Asia Pacific Natural Gas Storage Industry Revenue (Million), by Country 2024 & 2032
- Figure 48: Asia Pacific Natural Gas Storage Industry Volume (K Tons), by Country 2024 & 2032
- Figure 49: Asia Pacific Natural Gas Storage Industry Revenue Share (%), by Country 2024 & 2032
- Figure 50: Asia Pacific Natural Gas Storage Industry Volume Share (%), by Country 2024 & 2032
- Figure 51: South America Natural Gas Storage Industry Revenue (Million), by Type 2024 & 2032
- Figure 52: South America Natural Gas Storage Industry Volume (K Tons), by Type 2024 & 2032
- Figure 53: South America Natural Gas Storage Industry Revenue Share (%), by Type 2024 & 2032
- Figure 54: South America Natural Gas Storage Industry Volume Share (%), by Type 2024 & 2032
- Figure 55: South America Natural Gas Storage Industry Revenue (Million), by Country 2024 & 2032
- Figure 56: South America Natural Gas Storage Industry Volume (K Tons), by Country 2024 & 2032
- Figure 57: South America Natural Gas Storage Industry Revenue Share (%), by Country 2024 & 2032
- Figure 58: South America Natural Gas Storage Industry Volume Share (%), by Country 2024 & 2032
- Figure 59: Middle East and Africa Natural Gas Storage Industry Revenue (Million), by Type 2024 & 2032
- Figure 60: Middle East and Africa Natural Gas Storage Industry Volume (K Tons), by Type 2024 & 2032
- Figure 61: Middle East and Africa Natural Gas Storage Industry Revenue Share (%), by Type 2024 & 2032
- Figure 62: Middle East and Africa Natural Gas Storage Industry Volume Share (%), by Type 2024 & 2032
- Figure 63: Middle East and Africa Natural Gas Storage Industry Revenue (Million), by Country 2024 & 2032
- Figure 64: Middle East and Africa Natural Gas Storage Industry Volume (K Tons), by Country 2024 & 2032
- Figure 65: Middle East and Africa Natural Gas Storage Industry Revenue Share (%), by Country 2024 & 2032
- Figure 66: Middle East and Africa Natural Gas Storage Industry Volume Share (%), by Country 2024 & 2032
List of Tables
- Table 1: Global Natural Gas Storage Industry Revenue Million Forecast, by Region 2019 & 2032
- Table 2: Global Natural Gas Storage Industry Volume K Tons Forecast, by Region 2019 & 2032
- Table 3: Global Natural Gas Storage Industry Revenue Million Forecast, by Type 2019 & 2032
- Table 4: Global Natural Gas Storage Industry Volume K Tons Forecast, by Type 2019 & 2032
- Table 5: Global Natural Gas Storage Industry Revenue Million Forecast, by Region 2019 & 2032
- Table 6: Global Natural Gas Storage Industry Volume K Tons Forecast, by Region 2019 & 2032
- Table 7: Global Natural Gas Storage Industry Revenue Million Forecast, by Country 2019 & 2032
- Table 8: Global Natural Gas Storage Industry Volume K Tons Forecast, by Country 2019 & 2032
- Table 9: United States Natural Gas Storage Industry Revenue (Million) Forecast, by Application 2019 & 2032
- Table 10: United States Natural Gas Storage Industry Volume (K Tons) Forecast, by Application 2019 & 2032
- Table 11: Canada Natural Gas Storage Industry Revenue (Million) Forecast, by Application 2019 & 2032
- Table 12: Canada Natural Gas Storage Industry Volume (K Tons) Forecast, by Application 2019 & 2032
- Table 13: Mexico Natural Gas Storage Industry Revenue (Million) Forecast, by Application 2019 & 2032
- Table 14: Mexico Natural Gas Storage Industry Volume (K Tons) Forecast, by Application 2019 & 2032
- Table 15: Global Natural Gas Storage Industry Revenue Million Forecast, by Country 2019 & 2032
- Table 16: Global Natural Gas Storage Industry Volume K Tons Forecast, by Country 2019 & 2032
- Table 17: Germany Natural Gas Storage Industry Revenue (Million) Forecast, by Application 2019 & 2032
- Table 18: Germany Natural Gas Storage Industry Volume (K Tons) Forecast, by Application 2019 & 2032
- Table 19: United Kingdom Natural Gas Storage Industry Revenue (Million) Forecast, by Application 2019 & 2032
- Table 20: United Kingdom Natural Gas Storage Industry Volume (K Tons) Forecast, by Application 2019 & 2032
- Table 21: France Natural Gas Storage Industry Revenue (Million) Forecast, by Application 2019 & 2032
- Table 22: France Natural Gas Storage Industry Volume (K Tons) Forecast, by Application 2019 & 2032
- Table 23: Spain Natural Gas Storage Industry Revenue (Million) Forecast, by Application 2019 & 2032
- Table 24: Spain Natural Gas Storage Industry Volume (K Tons) Forecast, by Application 2019 & 2032
- Table 25: Italy Natural Gas Storage Industry Revenue (Million) Forecast, by Application 2019 & 2032
- Table 26: Italy Natural Gas Storage Industry Volume (K Tons) Forecast, by Application 2019 & 2032
- Table 27: Spain Natural Gas Storage Industry Revenue (Million) Forecast, by Application 2019 & 2032
- Table 28: Spain Natural Gas Storage Industry Volume (K Tons) Forecast, by Application 2019 & 2032
- Table 29: Belgium Natural Gas Storage Industry Revenue (Million) Forecast, by Application 2019 & 2032
- Table 30: Belgium Natural Gas Storage Industry Volume (K Tons) Forecast, by Application 2019 & 2032
- Table 31: Netherland Natural Gas Storage Industry Revenue (Million) Forecast, by Application 2019 & 2032
- Table 32: Netherland Natural Gas Storage Industry Volume (K Tons) Forecast, by Application 2019 & 2032
- Table 33: Nordics Natural Gas Storage Industry Revenue (Million) Forecast, by Application 2019 & 2032
- Table 34: Nordics Natural Gas Storage Industry Volume (K Tons) Forecast, by Application 2019 & 2032
- Table 35: Rest of Europe Natural Gas Storage Industry Revenue (Million) Forecast, by Application 2019 & 2032
- Table 36: Rest of Europe Natural Gas Storage Industry Volume (K Tons) Forecast, by Application 2019 & 2032
- Table 37: Global Natural Gas Storage Industry Revenue Million Forecast, by Country 2019 & 2032
- Table 38: Global Natural Gas Storage Industry Volume K Tons Forecast, by Country 2019 & 2032
- Table 39: China Natural Gas Storage Industry Revenue (Million) Forecast, by Application 2019 & 2032
- Table 40: China Natural Gas Storage Industry Volume (K Tons) Forecast, by Application 2019 & 2032
- Table 41: Japan Natural Gas Storage Industry Revenue (Million) Forecast, by Application 2019 & 2032
- Table 42: Japan Natural Gas Storage Industry Volume (K Tons) Forecast, by Application 2019 & 2032
- Table 43: India Natural Gas Storage Industry Revenue (Million) Forecast, by Application 2019 & 2032
- Table 44: India Natural Gas Storage Industry Volume (K Tons) Forecast, by Application 2019 & 2032
- Table 45: South Korea Natural Gas Storage Industry Revenue (Million) Forecast, by Application 2019 & 2032
- Table 46: South Korea Natural Gas Storage Industry Volume (K Tons) Forecast, by Application 2019 & 2032
- Table 47: Southeast Asia Natural Gas Storage Industry Revenue (Million) Forecast, by Application 2019 & 2032
- Table 48: Southeast Asia Natural Gas Storage Industry Volume (K Tons) Forecast, by Application 2019 & 2032
- Table 49: Australia Natural Gas Storage Industry Revenue (Million) Forecast, by Application 2019 & 2032
- Table 50: Australia Natural Gas Storage Industry Volume (K Tons) Forecast, by Application 2019 & 2032
- Table 51: Indonesia Natural Gas Storage Industry Revenue (Million) Forecast, by Application 2019 & 2032
- Table 52: Indonesia Natural Gas Storage Industry Volume (K Tons) Forecast, by Application 2019 & 2032
- Table 53: Phillipes Natural Gas Storage Industry Revenue (Million) Forecast, by Application 2019 & 2032
- Table 54: Phillipes Natural Gas Storage Industry Volume (K Tons) Forecast, by Application 2019 & 2032
- Table 55: Singapore Natural Gas Storage Industry Revenue (Million) Forecast, by Application 2019 & 2032
- Table 56: Singapore Natural Gas Storage Industry Volume (K Tons) Forecast, by Application 2019 & 2032
- Table 57: Thailandc Natural Gas Storage Industry Revenue (Million) Forecast, by Application 2019 & 2032
- Table 58: Thailandc Natural Gas Storage Industry Volume (K Tons) Forecast, by Application 2019 & 2032
- Table 59: Rest of Asia Pacific Natural Gas Storage Industry Revenue (Million) Forecast, by Application 2019 & 2032
- Table 60: Rest of Asia Pacific Natural Gas Storage Industry Volume (K Tons) Forecast, by Application 2019 & 2032
- Table 61: Global Natural Gas Storage Industry Revenue Million Forecast, by Country 2019 & 2032
- Table 62: Global Natural Gas Storage Industry Volume K Tons Forecast, by Country 2019 & 2032
- Table 63: Brazil Natural Gas Storage Industry Revenue (Million) Forecast, by Application 2019 & 2032
- Table 64: Brazil Natural Gas Storage Industry Volume (K Tons) Forecast, by Application 2019 & 2032
- Table 65: Argentina Natural Gas Storage Industry Revenue (Million) Forecast, by Application 2019 & 2032
- Table 66: Argentina Natural Gas Storage Industry Volume (K Tons) Forecast, by Application 2019 & 2032
- Table 67: Peru Natural Gas Storage Industry Revenue (Million) Forecast, by Application 2019 & 2032
- Table 68: Peru Natural Gas Storage Industry Volume (K Tons) Forecast, by Application 2019 & 2032
- Table 69: Chile Natural Gas Storage Industry Revenue (Million) Forecast, by Application 2019 & 2032
- Table 70: Chile Natural Gas Storage Industry Volume (K Tons) Forecast, by Application 2019 & 2032
- Table 71: Colombia Natural Gas Storage Industry Revenue (Million) Forecast, by Application 2019 & 2032
- Table 72: Colombia Natural Gas Storage Industry Volume (K Tons) Forecast, by Application 2019 & 2032
- Table 73: Ecuador Natural Gas Storage Industry Revenue (Million) Forecast, by Application 2019 & 2032
- Table 74: Ecuador Natural Gas Storage Industry Volume (K Tons) Forecast, by Application 2019 & 2032
- Table 75: Venezuela Natural Gas Storage Industry Revenue (Million) Forecast, by Application 2019 & 2032
- Table 76: Venezuela Natural Gas Storage Industry Volume (K Tons) Forecast, by Application 2019 & 2032
- Table 77: Rest of South America Natural Gas Storage Industry Revenue (Million) Forecast, by Application 2019 & 2032
- Table 78: Rest of South America Natural Gas Storage Industry Volume (K Tons) Forecast, by Application 2019 & 2032
- Table 79: Global Natural Gas Storage Industry Revenue Million Forecast, by Country 2019 & 2032
- Table 80: Global Natural Gas Storage Industry Volume K Tons Forecast, by Country 2019 & 2032
- Table 81: United States Natural Gas Storage Industry Revenue (Million) Forecast, by Application 2019 & 2032
- Table 82: United States Natural Gas Storage Industry Volume (K Tons) Forecast, by Application 2019 & 2032
- Table 83: Canada Natural Gas Storage Industry Revenue (Million) Forecast, by Application 2019 & 2032
- Table 84: Canada Natural Gas Storage Industry Volume (K Tons) Forecast, by Application 2019 & 2032
- Table 85: Mexico Natural Gas Storage Industry Revenue (Million) Forecast, by Application 2019 & 2032
- Table 86: Mexico Natural Gas Storage Industry Volume (K Tons) Forecast, by Application 2019 & 2032
- Table 87: Global Natural Gas Storage Industry Revenue Million Forecast, by Country 2019 & 2032
- Table 88: Global Natural Gas Storage Industry Volume K Tons Forecast, by Country 2019 & 2032
- Table 89: United Arab Emirates Natural Gas Storage Industry Revenue (Million) Forecast, by Application 2019 & 2032
- Table 90: United Arab Emirates Natural Gas Storage Industry Volume (K Tons) Forecast, by Application 2019 & 2032
- Table 91: Saudi Arabia Natural Gas Storage Industry Revenue (Million) Forecast, by Application 2019 & 2032
- Table 92: Saudi Arabia Natural Gas Storage Industry Volume (K Tons) Forecast, by Application 2019 & 2032
- Table 93: South Africa Natural Gas Storage Industry Revenue (Million) Forecast, by Application 2019 & 2032
- Table 94: South Africa Natural Gas Storage Industry Volume (K Tons) Forecast, by Application 2019 & 2032
- Table 95: Rest of Middle East and Africa Natural Gas Storage Industry Revenue (Million) Forecast, by Application 2019 & 2032
- Table 96: Rest of Middle East and Africa Natural Gas Storage Industry Volume (K Tons) Forecast, by Application 2019 & 2032
- Table 97: Global Natural Gas Storage Industry Revenue Million Forecast, by Type 2019 & 2032
- Table 98: Global Natural Gas Storage Industry Volume K Tons Forecast, by Type 2019 & 2032
- Table 99: Global Natural Gas Storage Industry Revenue Million Forecast, by Country 2019 & 2032
- Table 100: Global Natural Gas Storage Industry Volume K Tons Forecast, by Country 2019 & 2032
- Table 101: Global Natural Gas Storage Industry Revenue Million Forecast, by Type 2019 & 2032
- Table 102: Global Natural Gas Storage Industry Volume K Tons Forecast, by Type 2019 & 2032
- Table 103: Global Natural Gas Storage Industry Revenue Million Forecast, by Country 2019 & 2032
- Table 104: Global Natural Gas Storage Industry Volume K Tons Forecast, by Country 2019 & 2032
- Table 105: Global Natural Gas Storage Industry Revenue Million Forecast, by Type 2019 & 2032
- Table 106: Global Natural Gas Storage Industry Volume K Tons Forecast, by Type 2019 & 2032
- Table 107: Global Natural Gas Storage Industry Revenue Million Forecast, by Country 2019 & 2032
- Table 108: Global Natural Gas Storage Industry Volume K Tons Forecast, by Country 2019 & 2032
- Table 109: Global Natural Gas Storage Industry Revenue Million Forecast, by Type 2019 & 2032
- Table 110: Global Natural Gas Storage Industry Volume K Tons Forecast, by Type 2019 & 2032
- Table 111: Global Natural Gas Storage Industry Revenue Million Forecast, by Country 2019 & 2032
- Table 112: Global Natural Gas Storage Industry Volume K Tons Forecast, by Country 2019 & 2032
- Table 113: Global Natural Gas Storage Industry Revenue Million Forecast, by Type 2019 & 2032
- Table 114: Global Natural Gas Storage Industry Volume K Tons Forecast, by Type 2019 & 2032
- Table 115: Global Natural Gas Storage Industry Revenue Million Forecast, by Country 2019 & 2032
- Table 116: Global Natural Gas Storage Industry Volume K Tons Forecast, by Country 2019 & 2032
Frequently Asked Questions
1. What is the projected Compound Annual Growth Rate (CAGR) of the Natural Gas Storage Industry?
The projected CAGR is approximately > 3.50%.
2. Which companies are prominent players in the Natural Gas Storage Industry?
Key companies in the market include Engie SA, NAFTA a s, China National Petroleum Corporation, Uniper SE*List Not Exhaustive, Koninklijke Vopak N V, Enbridge Inc, Chiyoda Corporation, John Wood Group PLC, Gazprom PAO, Costain Group PLC.
3. What are the main segments of the Natural Gas Storage Industry?
The market segments include Type.
4. Can you provide details about the market size?
The market size is estimated to be USD 14940 Million as of 2022.
5. What are some drivers contributing to market growth?
4.; Increasing Electricity Demand4.; Rsing Investments in the Coal Industry.
6. What are the notable trends driving market growth?
Underground Storage to Dominate the Market.
7. Are there any restraints impacting market growth?
4.; Increasing Installation of Renewable Energy Sources.
8. Can you provide examples of recent developments in the market?
Technological innovations in storage systems
9. What pricing options are available for accessing the report?
Pricing options include single-user, multi-user, and enterprise licenses priced at USD 4750, USD 5250, and USD 8750 respectively.
10. Is the market size provided in terms of value or volume?
The market size is provided in terms of value, measured in Million and volume, measured in K Tons.
11. Are there any specific market keywords associated with the report?
Yes, the market keyword associated with the report is "Natural Gas Storage Industry," which aids in identifying and referencing the specific market segment covered.
12. How do I determine which pricing option suits my needs best?
The pricing options vary based on user requirements and access needs. Individual users may opt for single-user licenses, while businesses requiring broader access may choose multi-user or enterprise licenses for cost-effective access to the report.
13. Are there any additional resources or data provided in the Natural Gas Storage Industry report?
While the report offers comprehensive insights, it's advisable to review the specific contents or supplementary materials provided to ascertain if additional resources or data are available.
14. How can I stay updated on further developments or reports in the Natural Gas Storage Industry?
To stay informed about further developments, trends, and reports in the Natural Gas Storage Industry, consider subscribing to industry newsletters, following relevant companies and organizations, or regularly checking reputable industry news sources and publications.
Methodology
Step 1 - Identification of Relevant Samples Size from Population Database


Step 2 - Approaches for Defining Global Market Size (Value, Volume* & Price*)

Note*: In applicable scenarios
Step 3 - Data Sources
Primary Research
- Web Analytics
- Survey Reports
- Research Institute
- Latest Research Reports
- Opinion Leaders
Secondary Research
- Annual Reports
- White Paper
- Latest Press Release
- Industry Association
- Paid Database
- Investor Presentations

Step 4 - Data Triangulation
Involves using different sources of information in order to increase the validity of a study
These sources are likely to be stakeholders in a program - participants, other researchers, program staff, other community members, and so on.
Then we put all data in single framework & apply various statistical tools to find out the dynamic on the market.
During the analysis stage, feedback from the stakeholder groups would be compared to determine areas of agreement as well as areas of divergence
