

Key Insights
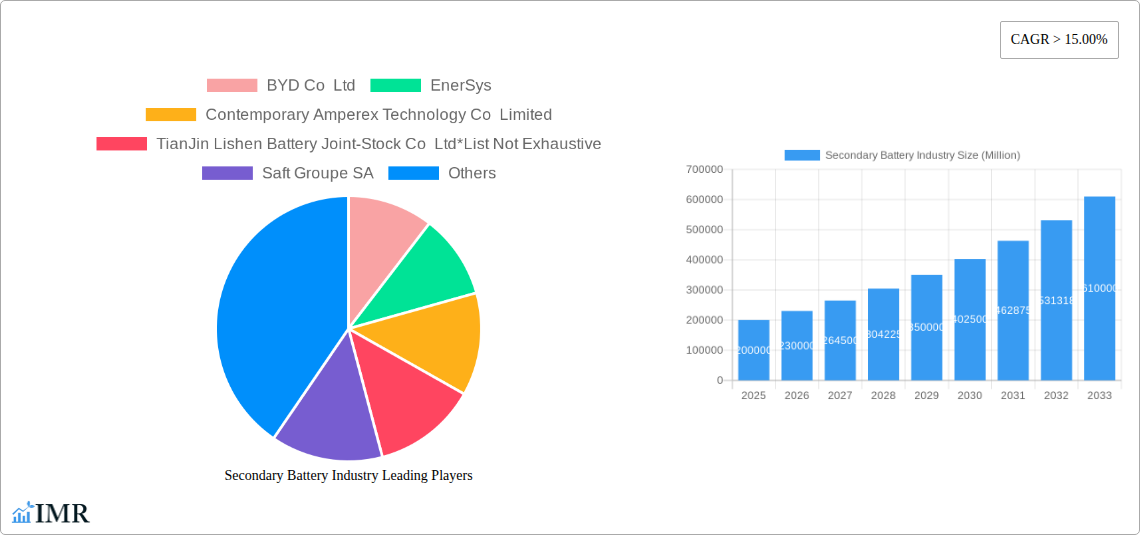
The secondary battery market is experiencing significant expansion, propelled by the accelerating electric vehicle (EV) sector and heightened demand for energy storage solutions. The market, valued at $71.9 billion in 2025, is forecasted to achieve a Compound Annual Growth Rate (CAGR) of 23.2% from 2025 to 2033. Key drivers include the global transition to sustainable transportation, which is intensifying demand for automotive batteries, with lithium-ion technology leading due to its superior energy density and performance. Concurrently, the increasing integration of renewable energy sources like solar and wind is spurring the need for robust energy storage systems (ESS), creating substantial opportunities in the industrial battery segment. The sustained demand from portable electronics also contributes to market growth, albeit at a less rapid pace.
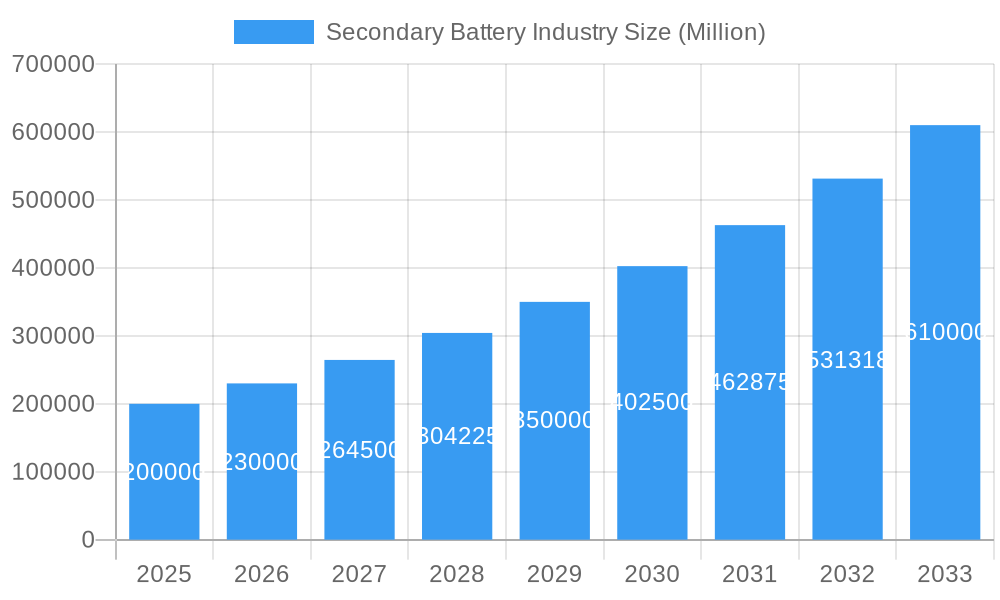
Secondary Battery Industry Market Size (In Billion)
Geographically, while North America and Europe represent mature markets, the Asia-Pacific region, particularly China, is projected to lead in both production and consumption, driven by its substantial EV market and advanced manufacturing infrastructure. Emerging markets in South America and MEA (Middle East and Africa) show considerable growth potential, though current market penetration is constrained by infrastructure and economic factors. The competitive landscape is dynamic, with key players actively innovating in technology, cost optimization, and market share acquisition. This competitive environment fosters advancements, leading to more accessible and higher-performance batteries and further stimulating market growth. However, challenges such as raw material price fluctuations, supply chain disruptions, and environmental considerations related to battery lifecycle management persist.
Secondary Battery Industry Company Market Share
Secondary Battery Industry Market Report: 2019-2033
This comprehensive report provides an in-depth analysis of the secondary battery industry, encompassing market dynamics, growth trends, regional dominance, product landscape, and future outlook. The study period covers 2019-2033, with a base year of 2025 and a forecast period of 2025-2033. The report analyzes key segments including Lead-acid, Lithium-ion, and other battery technologies across diverse applications like automotive, industrial, portable, and other specialized sectors. Key players such as BYD Co Ltd, EnerSys, Contemporary Amperex Technology Co Limited, and others are profiled, providing a complete overview of this rapidly evolving market.
Secondary Battery Industry Market Dynamics & Structure
The secondary battery market is characterized by intense competition, rapid technological advancements, and evolving regulatory landscapes. Market concentration is moderate, with several major players holding significant shares, but a growing number of smaller companies are innovating and disrupting the market. The shift towards electric vehicles (EVs) is a major driver, boosting demand for lithium-ion batteries. However, the industry also faces challenges, including supply chain constraints and fluctuating raw material prices. Mergers and acquisitions (M&A) activity is significant, with xx million USD worth of deals recorded in 2024 (estimated).
- Market Concentration: Moderate, with top 5 players holding approximately xx% market share (estimated).
- Technological Innovation: Driven by improvements in energy density, lifespan, charging time, and cost reduction.
- Regulatory Frameworks: Stringent regulations regarding battery safety, recycling, and environmental impact are shaping the market.
- Competitive Product Substitutes: Fuel cells and alternative energy storage technologies present some level of competition, although lithium-ion batteries currently dominate.
- End-User Demographics: Primarily driven by automotive, industrial, and consumer electronics sectors, with growing interest from renewable energy applications.
- M&A Trends: A significant number of mergers and acquisitions, particularly focusing on securing supply chains and advanced technologies.
Secondary Battery Industry Growth Trends & Insights
The secondary battery market is experiencing robust growth, driven by the global transition towards electric vehicles, renewable energy integration, and increasing demand for portable electronics. The market size expanded from xx million units in 2019 to xx million units in 2024, with a Compound Annual Growth Rate (CAGR) of xx% during the historical period. This growth is projected to continue, with an expected CAGR of xx% from 2025 to 2033, reaching xx million units by 2033. Technological disruptions, such as advancements in solid-state batteries and improved battery management systems, are further accelerating market growth. Consumer preferences are shifting towards higher energy density, longer lifespan, and more sustainable battery solutions.
Dominant Regions, Countries, or Segments in Secondary Battery Industry
Asia, particularly China, is currently the dominant region in the secondary battery industry, driven by large-scale EV adoption, substantial manufacturing capacity, and supportive government policies. Within the technology segment, lithium-ion batteries account for the largest market share due to their superior performance characteristics. In terms of application, the automotive sector is a significant growth driver, particularly for EVs and HEVs (Hybrid Electric Vehicles).
- Key Drivers (Asia): Strong government support for EV adoption, large-scale manufacturing capabilities, and readily available raw materials.
- Key Drivers (Automotive Sector): Increasing demand for EVs, stricter emission regulations, and technological advancements in battery technology.
- Market Share (Lithium-ion): Holding approximately xx% of the total market share in 2024 (estimated), projected to increase to xx% by 2033.
Secondary Battery Industry Product Landscape
The secondary battery market offers a wide array of products, ranging from lead-acid batteries for traditional applications to high-energy-density lithium-ion batteries for EVs and energy storage systems. Recent innovations include solid-state batteries promising higher energy density and safety, fast-charging technologies, and improved battery management systems that enhance performance and lifespan. Unique selling propositions include enhanced energy density, longer cycle life, improved safety features, and faster charging capabilities.
Key Drivers, Barriers & Challenges in Secondary Battery Industry
Key Drivers:
- Rising demand for electric vehicles and renewable energy storage.
- Advancements in battery technology, resulting in improved performance and reduced costs.
- Government incentives and regulations promoting the adoption of electric vehicles and renewable energy.
Key Challenges:
- Supply chain disruptions and volatile raw material prices (e.g., lithium, cobalt).
- Concerns about battery safety and environmental impact.
- Intense competition and technological advancements requiring continuous innovation. The high capital investment required for new battery production facilities is also a major barrier.
Emerging Opportunities in Secondary Battery Industry
- Growth in the energy storage sector, driven by increased renewable energy adoption.
- Expansion into new applications, such as drones, robotics, and grid-scale energy storage.
- Development of sustainable and recyclable battery technologies to address environmental concerns.
Growth Accelerators in the Secondary Battery Industry
Technological breakthroughs, particularly in solid-state battery technology and advanced battery management systems, are key growth accelerators. Strategic partnerships between battery manufacturers, automotive companies, and raw material suppliers are also crucial. Expanding into new and emerging markets, especially in developing countries, presents substantial growth opportunities.
Key Players Shaping the Secondary Battery Industry Market
- BYD Co Ltd
- EnerSys
- Contemporary Amperex Technology Co Limited
- TianJin Lishen Battery Joint-Stock Co Ltd
- Saft Groupe SA
- Samsung SDI Co Ltd
- LG Chem Ltd
- Clarios
- Tesla Inc
- GS Yuasa Corporation
- Duracell Inc
- Showa Denko KK
- Panasonic Corporation
Notable Milestones in Secondary Battery Industry Sector
- December 2021: Reliance New Energy Solar Limited acquired Faradion, a UK-based sodium-ion battery technology company, for USD 117 million.
- December 2021: Northvolt produced its first lithium-ion battery cell at its Swedish factory, with a planned annual output of 60 GWh.
In-Depth Secondary Battery Industry Market Outlook
The secondary battery market is poised for continued strong growth, driven by the increasing adoption of electric vehicles, renewable energy storage, and advancements in battery technology. The market presents significant opportunities for companies that can innovate, secure supply chains, and meet the growing demand for high-performance, sustainable battery solutions. Strategic partnerships and investments in research and development will be crucial for long-term success in this dynamic market.
Secondary Battery Industry Segmentation
-
1. Technology
- 1.1. Lead-acid Battery
- 1.2. Lithium-ion Battery
- 1.3. Other Technologies (NiMh, NiCD, etc.)
-
2. Application
- 2.1. Automotive Batteries (HEV, PHEV, and EV)
- 2.2. industrial batteries
- 2.3. Portable Batteries (Consumer Electronics, etc.)
- 2.4. other applications
Secondary Battery Industry Segmentation By Geography
- 1. North America
- 2. Asia Pacific
- 3. Europe
- 4. South America
- 5. Middle East
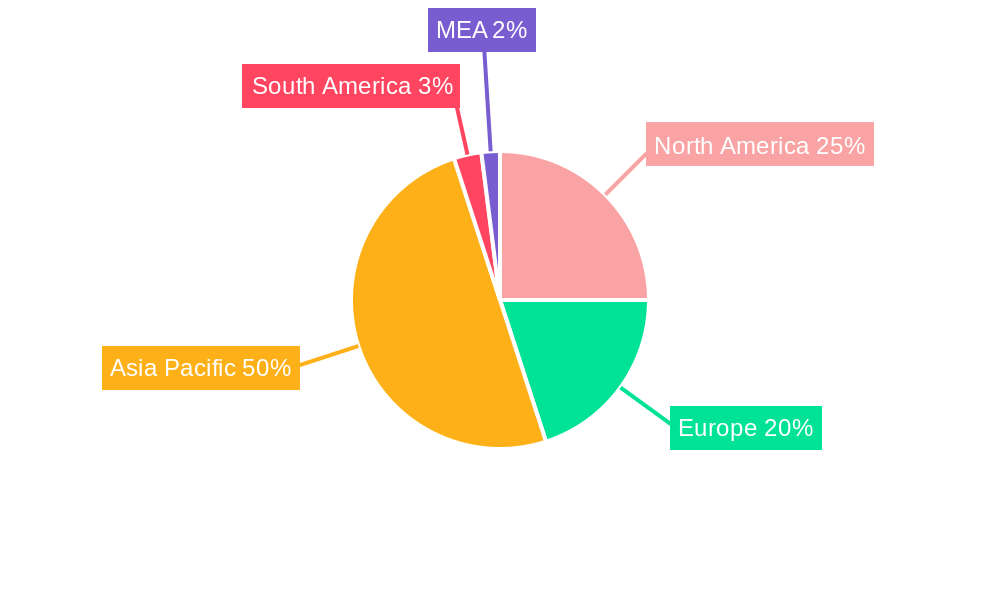
Secondary Battery Industry Regional Market Share
Geographic Coverage of Secondary Battery Industry
Secondary Battery Industry REPORT HIGHLIGHTS
| Aspects | Details |
|---|---|
| Study Period | 2020-2034 |
| Base Year | 2025 |
| Estimated Year | 2026 |
| Forecast Period | 2026-2034 |
| Historical Period | 2020-2025 |
| Growth Rate | CAGR of 23.2% from 2020-2034 |
| Segmentation |
|
Table of Contents
- 1. Introduction
- 1.1. Research Scope
- 1.2. Market Segmentation
- 1.3. Research Objective
- 1.4. Definitions and Assumptions
- 2. Executive Summary
- 2.1. Market Snapshot
- 3. Market Dynamics
- 3.1. Market Drivers
- 3.2. Market Restrains
- 3.3. Market Trends
- 3.4. Market Opportunities
- 4. Market Factor Analysis
- 4.1. Porters Five Forces
- 4.1.1. Bargaining Power of Suppliers
- 4.1.2. Bargaining Power of Buyers
- 4.1.3. Threat of New Entrants
- 4.1.4. Threat of Substitutes
- 4.1.5. Competitive Rivalry
- 4.2. PESTEL analysis
- 4.3. BCG Analysis
- 4.3.1. Stars (High Growth, High Market Share)
- 4.3.2. Cash Cows (Low Growth, High Market Share)
- 4.3.3. Question Mark (High Growth, Low Market Share)
- 4.3.4. Dogs (Low Growth, Low Market Share)
- 4.4. Ansoff Matrix Analysis
- 4.5. Supply Chain Analysis
- 4.6. Regulatory Landscape
- 4.7. Current Market Potential and Opportunity Assessment (TAM–SAM–SOM Framework)
- 4.8. IMR Analyst Note
- 4.1. Porters Five Forces
- 5. Market Analysis, Insights and Forecast 2021-2033
- 5.1. Market Analysis, Insights and Forecast - by Technology
- 5.1.1. Lead-acid Battery
- 5.1.2. Lithium-ion Battery
- 5.1.3. Other Technologies (NiMh, NiCD, etc.)
- 5.2. Market Analysis, Insights and Forecast - by Application
- 5.2.1. Automotive Batteries (HEV, PHEV, and EV)
- 5.2.2. industrial batteries
- 5.2.3. Portable Batteries (Consumer Electronics, etc.)
- 5.2.4. other applications
- 5.3. Market Analysis, Insights and Forecast - by Region
- 5.3.1. North America
- 5.3.2. Asia Pacific
- 5.3.3. Europe
- 5.3.4. South America
- 5.3.5. Middle East
- 5.1. Market Analysis, Insights and Forecast - by Technology
- 6. Global Secondary Battery Industry Analysis, Insights and Forecast, 2021-2033
- 6.1. Market Analysis, Insights and Forecast - by Technology
- 6.1.1. Lead-acid Battery
- 6.1.2. Lithium-ion Battery
- 6.1.3. Other Technologies (NiMh, NiCD, etc.)
- 6.2. Market Analysis, Insights and Forecast - by Application
- 6.2.1. Automotive Batteries (HEV, PHEV, and EV)
- 6.2.2. industrial batteries
- 6.2.3. Portable Batteries (Consumer Electronics, etc.)
- 6.2.4. other applications
- 6.1. Market Analysis, Insights and Forecast - by Technology
- 7. North America Secondary Battery Industry Analysis, Insights and Forecast, 2020-2032
- 7.1. Market Analysis, Insights and Forecast - by Technology
- 7.1.1. Lead-acid Battery
- 7.1.2. Lithium-ion Battery
- 7.1.3. Other Technologies (NiMh, NiCD, etc.)
- 7.2. Market Analysis, Insights and Forecast - by Application
- 7.2.1. Automotive Batteries (HEV, PHEV, and EV)
- 7.2.2. industrial batteries
- 7.2.3. Portable Batteries (Consumer Electronics, etc.)
- 7.2.4. other applications
- 7.1. Market Analysis, Insights and Forecast - by Technology
- 8. Asia Pacific Secondary Battery Industry Analysis, Insights and Forecast, 2020-2032
- 8.1. Market Analysis, Insights and Forecast - by Technology
- 8.1.1. Lead-acid Battery
- 8.1.2. Lithium-ion Battery
- 8.1.3. Other Technologies (NiMh, NiCD, etc.)
- 8.2. Market Analysis, Insights and Forecast - by Application
- 8.2.1. Automotive Batteries (HEV, PHEV, and EV)
- 8.2.2. industrial batteries
- 8.2.3. Portable Batteries (Consumer Electronics, etc.)
- 8.2.4. other applications
- 8.1. Market Analysis, Insights and Forecast - by Technology
- 9. Europe Secondary Battery Industry Analysis, Insights and Forecast, 2020-2032
- 9.1. Market Analysis, Insights and Forecast - by Technology
- 9.1.1. Lead-acid Battery
- 9.1.2. Lithium-ion Battery
- 9.1.3. Other Technologies (NiMh, NiCD, etc.)
- 9.2. Market Analysis, Insights and Forecast - by Application
- 9.2.1. Automotive Batteries (HEV, PHEV, and EV)
- 9.2.2. industrial batteries
- 9.2.3. Portable Batteries (Consumer Electronics, etc.)
- 9.2.4. other applications
- 9.1. Market Analysis, Insights and Forecast - by Technology
- 10. South America Secondary Battery Industry Analysis, Insights and Forecast, 2020-2032
- 10.1. Market Analysis, Insights and Forecast - by Technology
- 10.1.1. Lead-acid Battery
- 10.1.2. Lithium-ion Battery
- 10.1.3. Other Technologies (NiMh, NiCD, etc.)
- 10.2. Market Analysis, Insights and Forecast - by Application
- 10.2.1. Automotive Batteries (HEV, PHEV, and EV)
- 10.2.2. industrial batteries
- 10.2.3. Portable Batteries (Consumer Electronics, etc.)
- 10.2.4. other applications
- 10.1. Market Analysis, Insights and Forecast - by Technology
- 11. Middle East Secondary Battery Industry Analysis, Insights and Forecast, 2020-2032
- 11.1. Market Analysis, Insights and Forecast - by Technology
- 11.1.1. Lead-acid Battery
- 11.1.2. Lithium-ion Battery
- 11.1.3. Other Technologies (NiMh, NiCD, etc.)
- 11.2. Market Analysis, Insights and Forecast - by Application
- 11.2.1. Automotive Batteries (HEV, PHEV, and EV)
- 11.2.2. industrial batteries
- 11.2.3. Portable Batteries (Consumer Electronics, etc.)
- 11.2.4. other applications
- 11.1. Market Analysis, Insights and Forecast - by Technology
- 12. Competitive Analysis
- 12.1. Company Profiles
- 12.1.1 BYD Co Ltd
- 12.1.1.1. Company Overview
- 12.1.1.2. Products
- 12.1.1.3. Company Financials
- 12.1.1.4. SWOT Analysis
- 12.1.2 EnerSys
- 12.1.2.1. Company Overview
- 12.1.2.2. Products
- 12.1.2.3. Company Financials
- 12.1.2.4. SWOT Analysis
- 12.1.3 Contemporary Amperex Technology Co Limited
- 12.1.3.1. Company Overview
- 12.1.3.2. Products
- 12.1.3.3. Company Financials
- 12.1.3.4. SWOT Analysis
- 12.1.4 TianJin Lishen Battery Joint-Stock Co Ltd*List Not Exhaustive
- 12.1.4.1. Company Overview
- 12.1.4.2. Products
- 12.1.4.3. Company Financials
- 12.1.4.4. SWOT Analysis
- 12.1.5 Saft Groupe SA
- 12.1.5.1. Company Overview
- 12.1.5.2. Products
- 12.1.5.3. Company Financials
- 12.1.5.4. SWOT Analysis
- 12.1.6 Samsung SDI Co Ltd
- 12.1.6.1. Company Overview
- 12.1.6.2. Products
- 12.1.6.3. Company Financials
- 12.1.6.4. SWOT Analysis
- 12.1.7 LG Chem Ltd
- 12.1.7.1. Company Overview
- 12.1.7.2. Products
- 12.1.7.3. Company Financials
- 12.1.7.4. SWOT Analysis
- 12.1.8 Clarios
- 12.1.8.1. Company Overview
- 12.1.8.2. Products
- 12.1.8.3. Company Financials
- 12.1.8.4. SWOT Analysis
- 12.1.9 Tesla Inc
- 12.1.9.1. Company Overview
- 12.1.9.2. Products
- 12.1.9.3. Company Financials
- 12.1.9.4. SWOT Analysis
- 12.1.10 GS Yuasa Corporation
- 12.1.10.1. Company Overview
- 12.1.10.2. Products
- 12.1.10.3. Company Financials
- 12.1.10.4. SWOT Analysis
- 12.1.11 Duracell Inc
- 12.1.11.1. Company Overview
- 12.1.11.2. Products
- 12.1.11.3. Company Financials
- 12.1.11.4. SWOT Analysis
- 12.1.12 Showa Denko KK
- 12.1.12.1. Company Overview
- 12.1.12.2. Products
- 12.1.12.3. Company Financials
- 12.1.12.4. SWOT Analysis
- 12.1.13 Panasonic Corporation
- 12.1.13.1. Company Overview
- 12.1.13.2. Products
- 12.1.13.3. Company Financials
- 12.1.13.4. SWOT Analysis
- 12.1.1 BYD Co Ltd
- 12.2. Market Entropy
- 12.2.1 Company's Key Areas Served
- 12.2.2 Recent Developments
- 12.3. Company Market Share Analysis 2025
- 12.3.1 Top 5 Companies Market Share Analysis
- 12.3.2 Top 3 Companies Market Share Analysis
- 12.4. List of Potential Customers
- 13. Research Methodology
List of Figures
- Figure 1: Global Secondary Battery Industry Revenue Breakdown (billion, %) by Region 2025 & 2033
- Figure 2: Global Secondary Battery Industry Volume Breakdown (K Units, %) by Region 2025 & 2033
- Figure 3: North America Secondary Battery Industry Revenue (billion), by Technology 2025 & 2033
- Figure 4: North America Secondary Battery Industry Volume (K Units), by Technology 2025 & 2033
- Figure 5: North America Secondary Battery Industry Revenue Share (%), by Technology 2025 & 2033
- Figure 6: North America Secondary Battery Industry Volume Share (%), by Technology 2025 & 2033
- Figure 7: North America Secondary Battery Industry Revenue (billion), by Application 2025 & 2033
- Figure 8: North America Secondary Battery Industry Volume (K Units), by Application 2025 & 2033
- Figure 9: North America Secondary Battery Industry Revenue Share (%), by Application 2025 & 2033
- Figure 10: North America Secondary Battery Industry Volume Share (%), by Application 2025 & 2033
- Figure 11: North America Secondary Battery Industry Revenue (billion), by Country 2025 & 2033
- Figure 12: North America Secondary Battery Industry Volume (K Units), by Country 2025 & 2033
- Figure 13: North America Secondary Battery Industry Revenue Share (%), by Country 2025 & 2033
- Figure 14: North America Secondary Battery Industry Volume Share (%), by Country 2025 & 2033
- Figure 15: Asia Pacific Secondary Battery Industry Revenue (billion), by Technology 2025 & 2033
- Figure 16: Asia Pacific Secondary Battery Industry Volume (K Units), by Technology 2025 & 2033
- Figure 17: Asia Pacific Secondary Battery Industry Revenue Share (%), by Technology 2025 & 2033
- Figure 18: Asia Pacific Secondary Battery Industry Volume Share (%), by Technology 2025 & 2033
- Figure 19: Asia Pacific Secondary Battery Industry Revenue (billion), by Application 2025 & 2033
- Figure 20: Asia Pacific Secondary Battery Industry Volume (K Units), by Application 2025 & 2033
- Figure 21: Asia Pacific Secondary Battery Industry Revenue Share (%), by Application 2025 & 2033
- Figure 22: Asia Pacific Secondary Battery Industry Volume Share (%), by Application 2025 & 2033
- Figure 23: Asia Pacific Secondary Battery Industry Revenue (billion), by Country 2025 & 2033
- Figure 24: Asia Pacific Secondary Battery Industry Volume (K Units), by Country 2025 & 2033
- Figure 25: Asia Pacific Secondary Battery Industry Revenue Share (%), by Country 2025 & 2033
- Figure 26: Asia Pacific Secondary Battery Industry Volume Share (%), by Country 2025 & 2033
- Figure 27: Europe Secondary Battery Industry Revenue (billion), by Technology 2025 & 2033
- Figure 28: Europe Secondary Battery Industry Volume (K Units), by Technology 2025 & 2033
- Figure 29: Europe Secondary Battery Industry Revenue Share (%), by Technology 2025 & 2033
- Figure 30: Europe Secondary Battery Industry Volume Share (%), by Technology 2025 & 2033
- Figure 31: Europe Secondary Battery Industry Revenue (billion), by Application 2025 & 2033
- Figure 32: Europe Secondary Battery Industry Volume (K Units), by Application 2025 & 2033
- Figure 33: Europe Secondary Battery Industry Revenue Share (%), by Application 2025 & 2033
- Figure 34: Europe Secondary Battery Industry Volume Share (%), by Application 2025 & 2033
- Figure 35: Europe Secondary Battery Industry Revenue (billion), by Country 2025 & 2033
- Figure 36: Europe Secondary Battery Industry Volume (K Units), by Country 2025 & 2033
- Figure 37: Europe Secondary Battery Industry Revenue Share (%), by Country 2025 & 2033
- Figure 38: Europe Secondary Battery Industry Volume Share (%), by Country 2025 & 2033
- Figure 39: South America Secondary Battery Industry Revenue (billion), by Technology 2025 & 2033
- Figure 40: South America Secondary Battery Industry Volume (K Units), by Technology 2025 & 2033
- Figure 41: South America Secondary Battery Industry Revenue Share (%), by Technology 2025 & 2033
- Figure 42: South America Secondary Battery Industry Volume Share (%), by Technology 2025 & 2033
- Figure 43: South America Secondary Battery Industry Revenue (billion), by Application 2025 & 2033
- Figure 44: South America Secondary Battery Industry Volume (K Units), by Application 2025 & 2033
- Figure 45: South America Secondary Battery Industry Revenue Share (%), by Application 2025 & 2033
- Figure 46: South America Secondary Battery Industry Volume Share (%), by Application 2025 & 2033
- Figure 47: South America Secondary Battery Industry Revenue (billion), by Country 2025 & 2033
- Figure 48: South America Secondary Battery Industry Volume (K Units), by Country 2025 & 2033
- Figure 49: South America Secondary Battery Industry Revenue Share (%), by Country 2025 & 2033
- Figure 50: South America Secondary Battery Industry Volume Share (%), by Country 2025 & 2033
- Figure 51: Middle East Secondary Battery Industry Revenue (billion), by Technology 2025 & 2033
- Figure 52: Middle East Secondary Battery Industry Volume (K Units), by Technology 2025 & 2033
- Figure 53: Middle East Secondary Battery Industry Revenue Share (%), by Technology 2025 & 2033
- Figure 54: Middle East Secondary Battery Industry Volume Share (%), by Technology 2025 & 2033
- Figure 55: Middle East Secondary Battery Industry Revenue (billion), by Application 2025 & 2033
- Figure 56: Middle East Secondary Battery Industry Volume (K Units), by Application 2025 & 2033
- Figure 57: Middle East Secondary Battery Industry Revenue Share (%), by Application 2025 & 2033
- Figure 58: Middle East Secondary Battery Industry Volume Share (%), by Application 2025 & 2033
- Figure 59: Middle East Secondary Battery Industry Revenue (billion), by Country 2025 & 2033
- Figure 60: Middle East Secondary Battery Industry Volume (K Units), by Country 2025 & 2033
- Figure 61: Middle East Secondary Battery Industry Revenue Share (%), by Country 2025 & 2033
- Figure 62: Middle East Secondary Battery Industry Volume Share (%), by Country 2025 & 2033
List of Tables
- Table 1: Global Secondary Battery Industry Revenue billion Forecast, by Technology 2020 & 2033
- Table 2: Global Secondary Battery Industry Volume K Units Forecast, by Technology 2020 & 2033
- Table 3: Global Secondary Battery Industry Revenue billion Forecast, by Application 2020 & 2033
- Table 4: Global Secondary Battery Industry Volume K Units Forecast, by Application 2020 & 2033
- Table 5: Global Secondary Battery Industry Revenue billion Forecast, by Region 2020 & 2033
- Table 6: Global Secondary Battery Industry Volume K Units Forecast, by Region 2020 & 2033
- Table 7: Global Secondary Battery Industry Revenue billion Forecast, by Technology 2020 & 2033
- Table 8: Global Secondary Battery Industry Volume K Units Forecast, by Technology 2020 & 2033
- Table 9: Global Secondary Battery Industry Revenue billion Forecast, by Application 2020 & 2033
- Table 10: Global Secondary Battery Industry Volume K Units Forecast, by Application 2020 & 2033
- Table 11: Global Secondary Battery Industry Revenue billion Forecast, by Country 2020 & 2033
- Table 12: Global Secondary Battery Industry Volume K Units Forecast, by Country 2020 & 2033
- Table 13: Global Secondary Battery Industry Revenue billion Forecast, by Technology 2020 & 2033
- Table 14: Global Secondary Battery Industry Volume K Units Forecast, by Technology 2020 & 2033
- Table 15: Global Secondary Battery Industry Revenue billion Forecast, by Application 2020 & 2033
- Table 16: Global Secondary Battery Industry Volume K Units Forecast, by Application 2020 & 2033
- Table 17: Global Secondary Battery Industry Revenue billion Forecast, by Country 2020 & 2033
- Table 18: Global Secondary Battery Industry Volume K Units Forecast, by Country 2020 & 2033
- Table 19: Global Secondary Battery Industry Revenue billion Forecast, by Technology 2020 & 2033
- Table 20: Global Secondary Battery Industry Volume K Units Forecast, by Technology 2020 & 2033
- Table 21: Global Secondary Battery Industry Revenue billion Forecast, by Application 2020 & 2033
- Table 22: Global Secondary Battery Industry Volume K Units Forecast, by Application 2020 & 2033
- Table 23: Global Secondary Battery Industry Revenue billion Forecast, by Country 2020 & 2033
- Table 24: Global Secondary Battery Industry Volume K Units Forecast, by Country 2020 & 2033
- Table 25: Global Secondary Battery Industry Revenue billion Forecast, by Technology 2020 & 2033
- Table 26: Global Secondary Battery Industry Volume K Units Forecast, by Technology 2020 & 2033
- Table 27: Global Secondary Battery Industry Revenue billion Forecast, by Application 2020 & 2033
- Table 28: Global Secondary Battery Industry Volume K Units Forecast, by Application 2020 & 2033
- Table 29: Global Secondary Battery Industry Revenue billion Forecast, by Country 2020 & 2033
- Table 30: Global Secondary Battery Industry Volume K Units Forecast, by Country 2020 & 2033
- Table 31: Global Secondary Battery Industry Revenue billion Forecast, by Technology 2020 & 2033
- Table 32: Global Secondary Battery Industry Volume K Units Forecast, by Technology 2020 & 2033
- Table 33: Global Secondary Battery Industry Revenue billion Forecast, by Application 2020 & 2033
- Table 34: Global Secondary Battery Industry Volume K Units Forecast, by Application 2020 & 2033
- Table 35: Global Secondary Battery Industry Revenue billion Forecast, by Country 2020 & 2033
- Table 36: Global Secondary Battery Industry Volume K Units Forecast, by Country 2020 & 2033
Frequently Asked Questions
1. What is the projected Compound Annual Growth Rate (CAGR) of the Secondary Battery Industry?
The projected CAGR is approximately 23.2%.
2. Which companies are prominent players in the Secondary Battery Industry?
Key companies in the market include BYD Co Ltd, EnerSys, Contemporary Amperex Technology Co Limited, TianJin Lishen Battery Joint-Stock Co Ltd*List Not Exhaustive, Saft Groupe SA, Samsung SDI Co Ltd, LG Chem Ltd, Clarios, Tesla Inc, GS Yuasa Corporation, Duracell Inc, Showa Denko KK, Panasonic Corporation.
3. What are the main segments of the Secondary Battery Industry?
The market segments include Technology, Application.
4. Can you provide details about the market size?
The market size is estimated to be USD 71.9 billion as of 2022.
5. What are some drivers contributing to market growth?
4.; Increasing Demand for Natural Gas and Developing Gas Infrastructure 4.; Increasing Offshore Oil & Gas Exploration Activities.
6. What are the notable trends driving market growth?
Lithium-ion Battery Technology to Dominate the Market.
7. Are there any restraints impacting market growth?
4.; Adoption of Cleaner Alternatives4.; High Volatility of Crude Oil Prices.
8. Can you provide examples of recent developments in the market?
In December 2021, Reliance New Energy Solar Limited entered an agreement with Faradion to acquire 100% of the equity shares for a total value of USD 117 million. Faradion is a UK-based leading battery technology company with an extensive IP portfolio covering many aspects of sodium-ion technology.
9. What pricing options are available for accessing the report?
Pricing options include single-user, multi-user, and enterprise licenses priced at USD 4750, USD 5250, and USD 8750 respectively.
10. Is the market size provided in terms of value or volume?
The market size is provided in terms of value, measured in billion and volume, measured in K Units.
11. Are there any specific market keywords associated with the report?
Yes, the market keyword associated with the report is "Secondary Battery Industry," which aids in identifying and referencing the specific market segment covered.
12. How do I determine which pricing option suits my needs best?
The pricing options vary based on user requirements and access needs. Individual users may opt for single-user licenses, while businesses requiring broader access may choose multi-user or enterprise licenses for cost-effective access to the report.
13. Are there any additional resources or data provided in the Secondary Battery Industry report?
While the report offers comprehensive insights, it's advisable to review the specific contents or supplementary materials provided to ascertain if additional resources or data are available.
14. How can I stay updated on further developments or reports in the Secondary Battery Industry?
To stay informed about further developments, trends, and reports in the Secondary Battery Industry, consider subscribing to industry newsletters, following relevant companies and organizations, or regularly checking reputable industry news sources and publications.
Methodology
Step 1 - Identification of Relevant Samples Size from Population Database


Step 2 - Approaches for Defining Global Market Size (Value, Volume* & Price*)

Note*: In applicable scenarios
Step 3 - Data Sources
Primary Research
- Web Analytics
- Survey Reports
- Research Institute
- Latest Research Reports
- Opinion Leaders
Secondary Research
- Annual Reports
- White Paper
- Latest Press Release
- Industry Association
- Paid Database
- Investor Presentations

Step 4 - Data Triangulation
Involves using different sources of information in order to increase the validity of a study
These sources are likely to be stakeholders in a program - participants, other researchers, program staff, other community members, and so on.
Then we put all data in single framework & apply various statistical tools to find out the dynamic on the market.
During the analysis stage, feedback from the stakeholder groups would be compared to determine areas of agreement as well as areas of divergence