

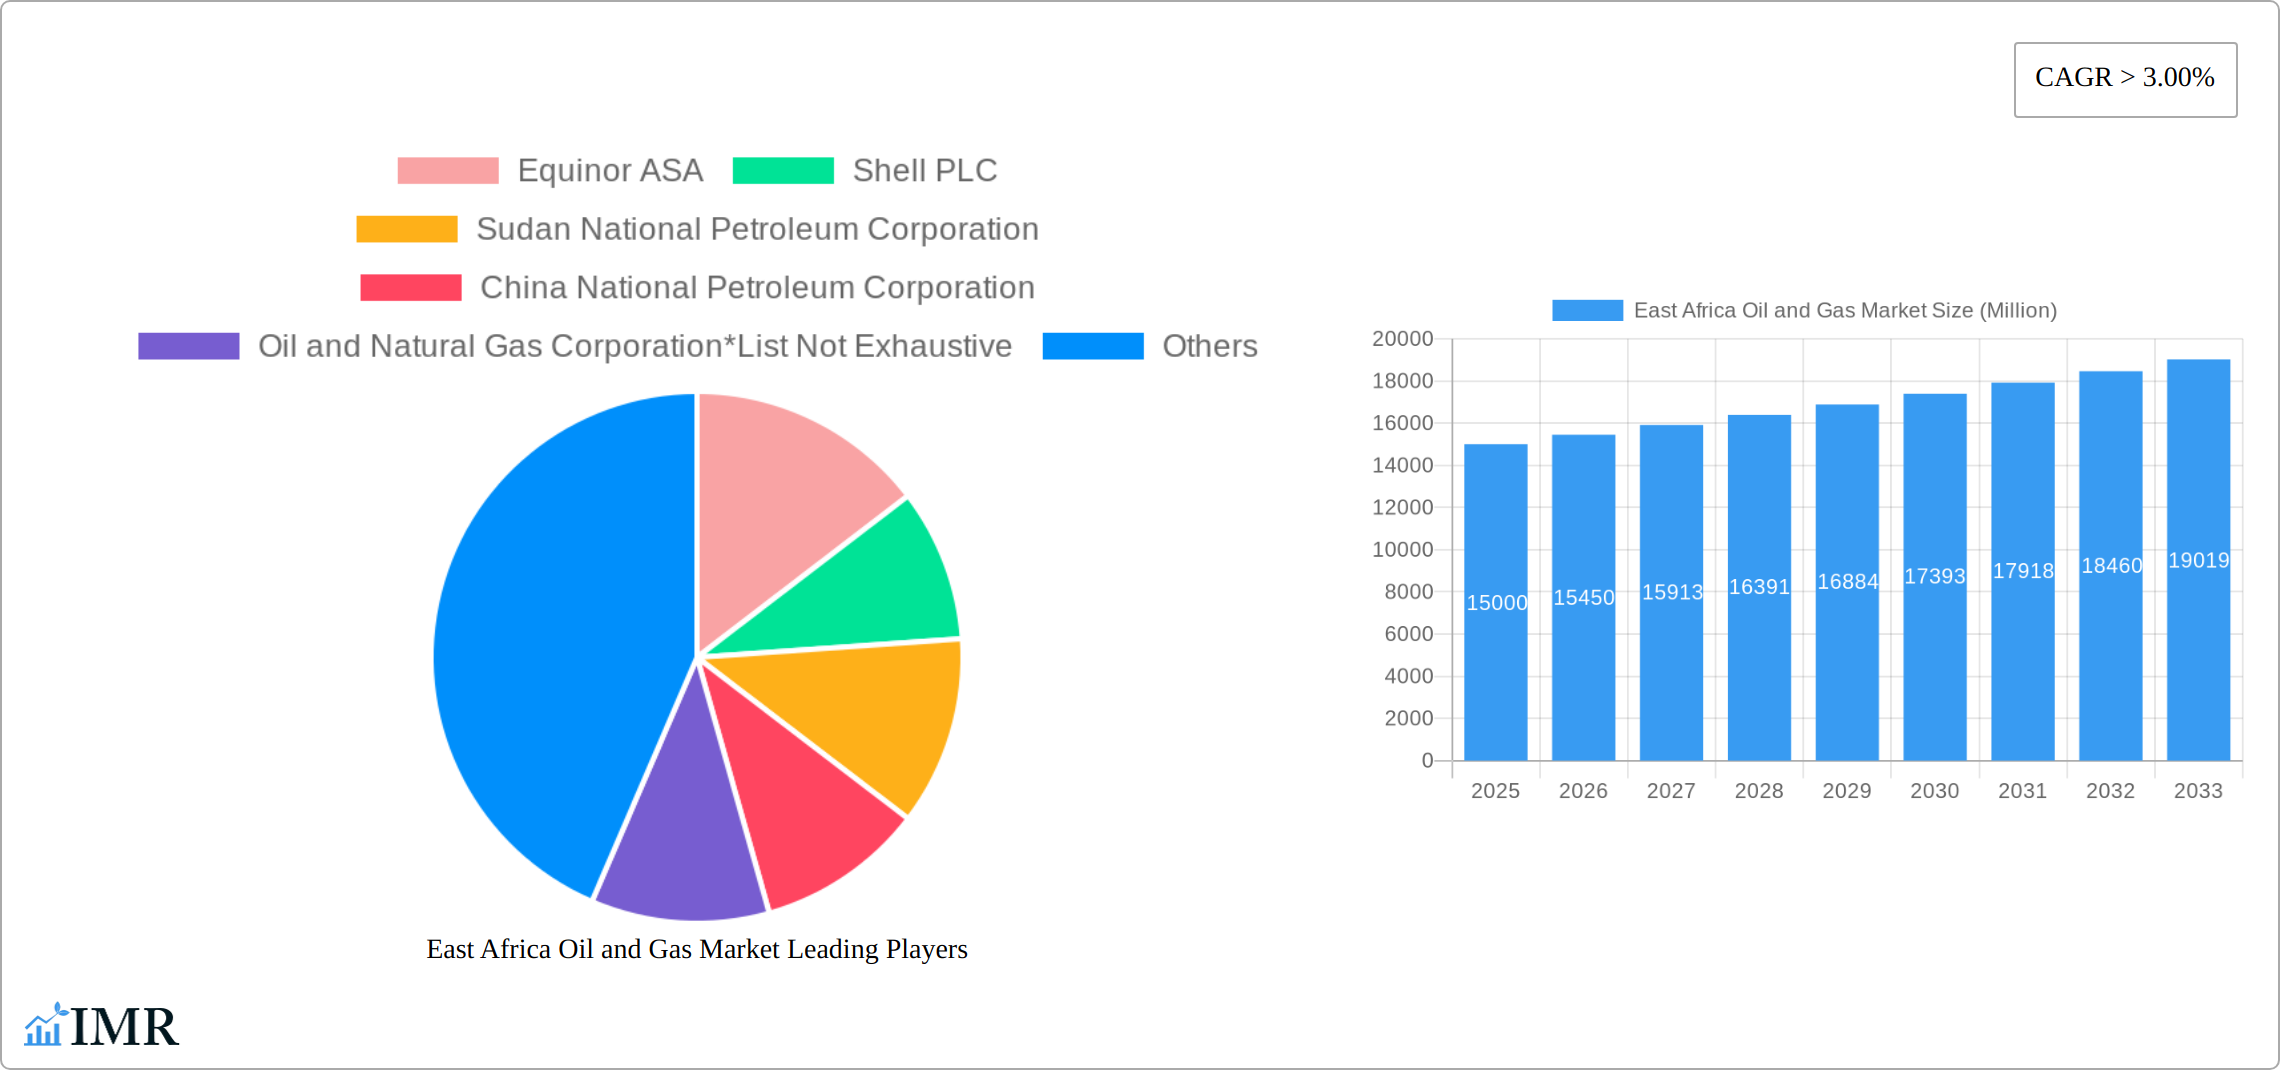
Key Insights
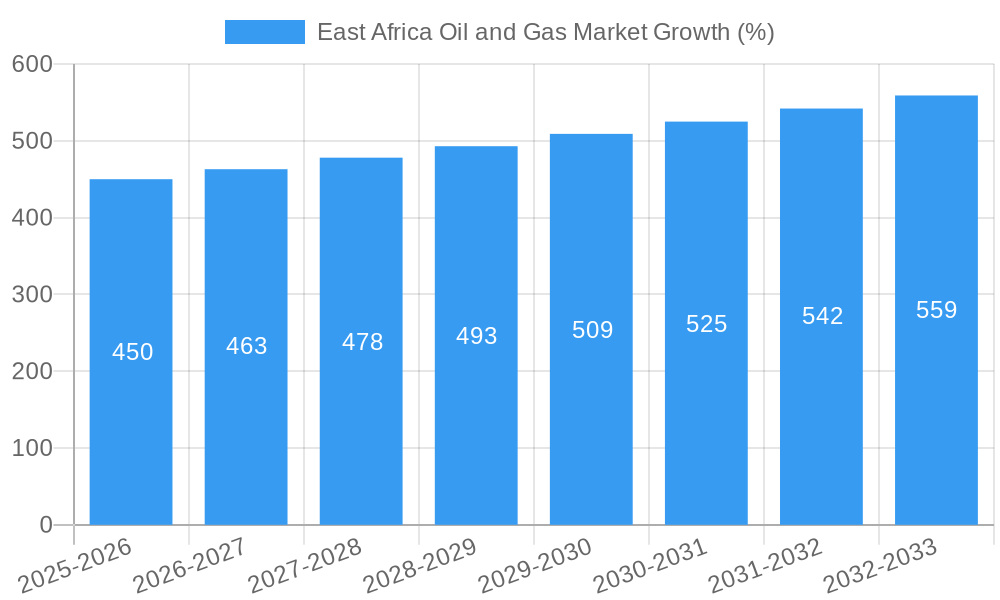
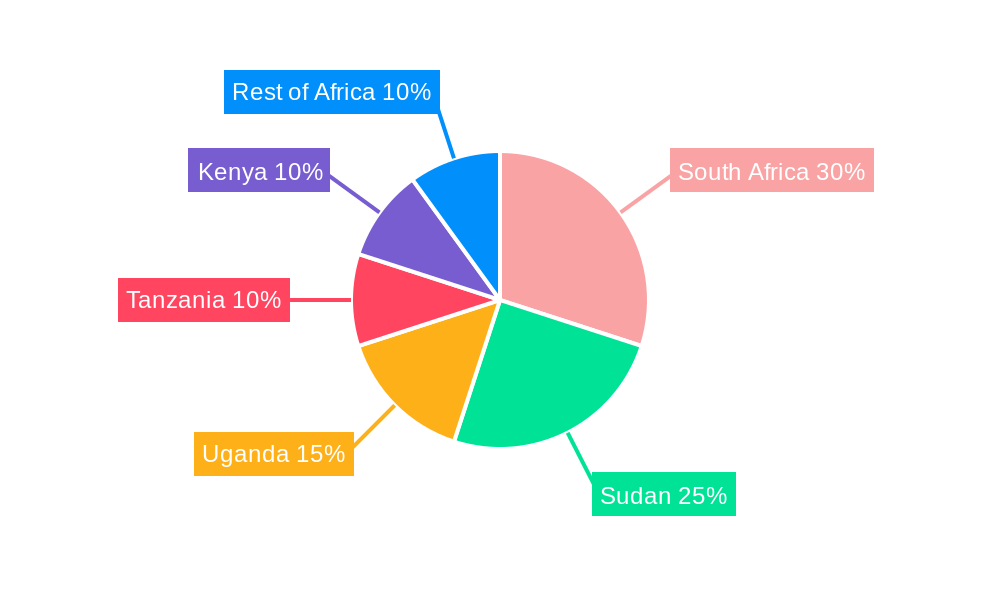
The East African oil and gas market, encompassing countries like South Africa, Sudan, Uganda, Tanzania, and Kenya, presents a dynamic landscape with significant growth potential. Driven by rising energy demand, increasing exploration activities, and supportive government policies aimed at boosting energy independence, the market is projected to experience a Compound Annual Growth Rate (CAGR) exceeding 3% from 2025 to 2033. The market's value, estimated at $XX million in 2025, is expected to expand considerably over the forecast period. While the upstream sector (exploration and production) currently dominates, the midstream (transportation and storage) and downstream (refining and distribution) sectors are poised for substantial growth as infrastructure develops and local consumption increases. Onshore projects are currently more prevalent due to easier accessibility and lower initial investment costs, but offshore exploration is anticipated to gain momentum in the coming years, driven by discoveries in promising locations. Major players like Equinor ASA, Shell PLC, and national oil companies are actively involved, driving investment and technological advancements. However, challenges such as geopolitical instability in certain regions, regulatory hurdles, and environmental concerns related to exploration and production remain potential restraints on the market's trajectory.
The segmentation of the East African oil and gas market reveals distinct opportunities and challenges across its value chain. Upstream activities currently lead the market, but the midstream and downstream sectors offer significant potential for growth as infrastructure and refining capacity increase to meet growing local demand. The geographical spread also highlights variations in market dynamics. For instance, countries with established infrastructure and stable political environments may experience faster growth compared to those with ongoing political instability or underdeveloped infrastructure. Addressing these challenges through strategic investments, robust regulatory frameworks, and sustainable practices will be crucial for unlocking the full potential of the East African oil and gas market and ensuring its sustainable development.
East Africa Oil & Gas Market: A Comprehensive Report (2019-2033)
This in-depth report provides a comprehensive analysis of the East Africa Oil & Gas market, covering the period 2019-2033. It delves into market dynamics, growth trends, dominant segments (Upstream, Midstream, Downstream; Onshore, Offshore), key players, and emerging opportunities across Kenya, Tanzania, Uganda, Mozambique, and Sudan. The report is invaluable for industry professionals, investors, and policymakers seeking to understand and capitalize on this dynamic market.
East Africa Oil & Gas Market Dynamics & Structure
This section analyzes the East African Oil & Gas market's structure, focusing on market concentration, technological innovation, regulatory frameworks, and competitive dynamics. We examine the impact of mergers and acquisitions (M&A) activity and explore the influence of end-user demographics and substitute products.
- Market Concentration: The market exhibits a moderate level of concentration, with major international players like Equinor ASA, Shell PLC, and Tullow Oil PLC competing alongside national oil companies such as the Sudan National Petroleum Corporation and China National Petroleum Corporation. The market share of these key players is estimated to be xx% in 2025, with smaller independent players holding the remaining share.
- Technological Innovation: Technological advancements, particularly in enhanced oil recovery (EOR) techniques and exploration technologies, are driving efficiency gains. However, barriers such as high initial investment costs and limited infrastructure hinder rapid technological adoption.
- Regulatory Landscape: Varying regulatory frameworks across East African nations impact investment decisions and operational costs. Recent policy shifts, such as the approval of the EACOP pipeline, significantly impact project development.
- M&A Activity: The number of M&A deals in the East African oil and gas sector averaged xx per year between 2019 and 2024, with a total deal value of approximately xx Million. This activity reflects both consolidation efforts and the attraction of foreign investment.
East Africa Oil & Gas Market Growth Trends & Insights
This section details the market's size evolution, adoption rates, and technological disruptions from 2019 to 2033. We analyze the impact of consumer behavior shifts and present quantitative insights, including compound annual growth rates (CAGR) and market penetration rates. Utilizing a combination of statistical modeling and expert opinions, we project a CAGR of xx% from 2025 to 2033, driven by increasing energy demand and ongoing exploration activities. Market penetration, currently at xx%, is expected to reach xx% by 2033. Significant technological disruptions are projected in exploration and production technologies impacting cost efficiency and resource recovery rates.
Dominant Regions, Countries, or Segments in East Africa Oil & Gas Market
This section identifies the leading regions, countries, and segments within the East African Oil & Gas market. Currently, Uganda and Tanzania show the strongest growth potential due to significant discoveries and infrastructure development, particularly the EACOP project. The upstream sector is expected to dominate market share in 2025, accounting for approximately xx% due to ongoing exploration and development activities.
- Key Drivers: Government incentives, improving infrastructure, and increased foreign direct investment (FDI) are crucial drivers of growth. The development of the EACOP pipeline, for example, is a significant catalyst for investment in Uganda and Tanzania.
- Onshore vs Offshore: Onshore development currently dominates, but offshore exploration is increasing, presenting a substantial future growth opportunity.
East Africa Oil & Gas Market Product Landscape
The East African oil and gas market features a diverse product landscape, encompassing crude oil, natural gas, refined petroleum products, and petrochemicals. Recent advancements focus on improving extraction techniques, enhancing processing efficiency, and expanding downstream value chains. The emphasis is on optimizing resource utilization and minimizing environmental impact.
Key Drivers, Barriers & Challenges in East Africa Oil & Gas Market
Key Drivers: The primary drivers include rising energy demand, significant hydrocarbon reserves, government support for energy security, and increased foreign investment.
Key Barriers & Challenges: Challenges include infrastructure limitations, regulatory complexities, geopolitical instability, and environmental concerns. Supply chain disruptions can lead to cost increases and delays in project completion. The impact of these challenges on overall market growth is estimated at xx% reduction in projected output over the forecast period.
Emerging Opportunities in East Africa Oil & Gas Market
Emerging opportunities lie in the development of gas processing facilities, expansion of downstream industries, and increased regional cooperation in infrastructure development. Untapped potential exists in exploration activities beyond established areas, and innovation in low-carbon technologies presents considerable growth prospects.
Growth Accelerators in the East Africa Oil & Gas Market Industry
Long-term growth will be fueled by advancements in exploration technologies, the development of new pipelines and infrastructure, and strategic partnerships between international and national players. Regional integration efforts and the development of a more robust regulatory framework are also expected to accelerate market growth.
Key Players Shaping the East Africa Oil & Gas Market Market
- Equinor ASA
- Shell PLC
- Sudan National Petroleum Corporation
- China National Petroleum Corporation
- Oil and Natural Gas Corporation
- Tullow Oil PLC
- List Not Exhaustive
Notable Milestones in East Africa Oil & Gas Market Sector
- November 2022: Approval of the EACOP pipeline project signifies a major milestone, unlocking significant investment and development opportunities.
- October 2022: Sasol's exploration plans in Mozambique indicate growing interest in the region's potential.
In-Depth East Africa Oil & Gas Market Market Outlook
The East African Oil & Gas market presents a compelling investment opportunity, with strong long-term growth prospects driven by rising energy demand and substantial hydrocarbon reserves. Strategic partnerships, infrastructure development, and technological innovation will be critical to realizing the market's full potential. The market is expected to reach a value of xx Million by 2033.
East Africa Oil and Gas Market Segmentation
-
1. Sector
- 1.1. Upstream
- 1.2. Midstream
- 1.3. Downstream
-
2. Location of Development
- 2.1. Onshore
- 2.2. Offshore
-
3. Geography
- 3.1. Mozambique
- 3.2. Tanzania
- 3.3. South Sudan
- 3.4. Kenya
- 3.5. Rest of East Africa
East Africa Oil and Gas Market Segmentation By Geography
- 1. Mozambique
- 2. Tanzania
- 3. South Sudan
- 4. Kenya
- 5. Rest of East Africa
East Africa Oil and Gas Market REPORT HIGHLIGHTS
| Aspects | Details |
|---|---|
| Study Period | 2019-2033 |
| Base Year | 2024 |
| Estimated Year | 2025 |
| Forecast Period | 2025-2033 |
| Historical Period | 2019-2024 |
| Growth Rate | CAGR of > 3.00% from 2019-2033 |
| Segmentation |
|
Table of Contents
- 1. Introduction
- 1.1. Research Scope
- 1.2. Market Segmentation
- 1.3. Research Methodology
- 1.4. Definitions and Assumptions
- 2. Executive Summary
- 2.1. Introduction
- 3. Market Dynamics
- 3.1. Introduction
- 3.2. Market Drivers
- 3.2.1. 4.; Modernization and Upgrades of Existing Military Aircraft Fleets4.; Increasing Defense Budgets
- 3.3. Market Restrains
- 3.3.1. 4.; Shift Toward Unmanned Aircraft
- 3.4. Market Trends
- 3.4.1. Midstream Sector to Witness Significant Growth
- 4. Market Factor Analysis
- 4.1. Porters Five Forces
- 4.2. Supply/Value Chain
- 4.3. PESTEL analysis
- 4.4. Market Entropy
- 4.5. Patent/Trademark Analysis
- 5. East Africa Oil and Gas Market Analysis, Insights and Forecast, 2019-2031
- 5.1. Market Analysis, Insights and Forecast - by Sector
- 5.1.1. Upstream
- 5.1.2. Midstream
- 5.1.3. Downstream
- 5.2. Market Analysis, Insights and Forecast - by Location of Development
- 5.2.1. Onshore
- 5.2.2. Offshore
- 5.3. Market Analysis, Insights and Forecast - by Geography
- 5.3.1. Mozambique
- 5.3.2. Tanzania
- 5.3.3. South Sudan
- 5.3.4. Kenya
- 5.3.5. Rest of East Africa
- 5.4. Market Analysis, Insights and Forecast - by Region
- 5.4.1. Mozambique
- 5.4.2. Tanzania
- 5.4.3. South Sudan
- 5.4.4. Kenya
- 5.4.5. Rest of East Africa
- 5.1. Market Analysis, Insights and Forecast - by Sector
- 6. Mozambique East Africa Oil and Gas Market Analysis, Insights and Forecast, 2019-2031
- 6.1. Market Analysis, Insights and Forecast - by Sector
- 6.1.1. Upstream
- 6.1.2. Midstream
- 6.1.3. Downstream
- 6.2. Market Analysis, Insights and Forecast - by Location of Development
- 6.2.1. Onshore
- 6.2.2. Offshore
- 6.3. Market Analysis, Insights and Forecast - by Geography
- 6.3.1. Mozambique
- 6.3.2. Tanzania
- 6.3.3. South Sudan
- 6.3.4. Kenya
- 6.3.5. Rest of East Africa
- 6.1. Market Analysis, Insights and Forecast - by Sector
- 7. Tanzania East Africa Oil and Gas Market Analysis, Insights and Forecast, 2019-2031
- 7.1. Market Analysis, Insights and Forecast - by Sector
- 7.1.1. Upstream
- 7.1.2. Midstream
- 7.1.3. Downstream
- 7.2. Market Analysis, Insights and Forecast - by Location of Development
- 7.2.1. Onshore
- 7.2.2. Offshore
- 7.3. Market Analysis, Insights and Forecast - by Geography
- 7.3.1. Mozambique
- 7.3.2. Tanzania
- 7.3.3. South Sudan
- 7.3.4. Kenya
- 7.3.5. Rest of East Africa
- 7.1. Market Analysis, Insights and Forecast - by Sector
- 8. South Sudan East Africa Oil and Gas Market Analysis, Insights and Forecast, 2019-2031
- 8.1. Market Analysis, Insights and Forecast - by Sector
- 8.1.1. Upstream
- 8.1.2. Midstream
- 8.1.3. Downstream
- 8.2. Market Analysis, Insights and Forecast - by Location of Development
- 8.2.1. Onshore
- 8.2.2. Offshore
- 8.3. Market Analysis, Insights and Forecast - by Geography
- 8.3.1. Mozambique
- 8.3.2. Tanzania
- 8.3.3. South Sudan
- 8.3.4. Kenya
- 8.3.5. Rest of East Africa
- 8.1. Market Analysis, Insights and Forecast - by Sector
- 9. Kenya East Africa Oil and Gas Market Analysis, Insights and Forecast, 2019-2031
- 9.1. Market Analysis, Insights and Forecast - by Sector
- 9.1.1. Upstream
- 9.1.2. Midstream
- 9.1.3. Downstream
- 9.2. Market Analysis, Insights and Forecast - by Location of Development
- 9.2.1. Onshore
- 9.2.2. Offshore
- 9.3. Market Analysis, Insights and Forecast - by Geography
- 9.3.1. Mozambique
- 9.3.2. Tanzania
- 9.3.3. South Sudan
- 9.3.4. Kenya
- 9.3.5. Rest of East Africa
- 9.1. Market Analysis, Insights and Forecast - by Sector
- 10. Rest of East Africa East Africa Oil and Gas Market Analysis, Insights and Forecast, 2019-2031
- 10.1. Market Analysis, Insights and Forecast - by Sector
- 10.1.1. Upstream
- 10.1.2. Midstream
- 10.1.3. Downstream
- 10.2. Market Analysis, Insights and Forecast - by Location of Development
- 10.2.1. Onshore
- 10.2.2. Offshore
- 10.3. Market Analysis, Insights and Forecast - by Geography
- 10.3.1. Mozambique
- 10.3.2. Tanzania
- 10.3.3. South Sudan
- 10.3.4. Kenya
- 10.3.5. Rest of East Africa
- 10.1. Market Analysis, Insights and Forecast - by Sector
- 11. South Africa East Africa Oil and Gas Market Analysis, Insights and Forecast, 2019-2031
- 12. Sudan East Africa Oil and Gas Market Analysis, Insights and Forecast, 2019-2031
- 13. Uganda East Africa Oil and Gas Market Analysis, Insights and Forecast, 2019-2031
- 14. Tanzania East Africa Oil and Gas Market Analysis, Insights and Forecast, 2019-2031
- 15. Kenya East Africa Oil and Gas Market Analysis, Insights and Forecast, 2019-2031
- 16. Rest of Africa East Africa Oil and Gas Market Analysis, Insights and Forecast, 2019-2031
- 17. Competitive Analysis
- 17.1. Market Share Analysis 2024
- 17.2. Company Profiles
- 17.2.1 Equinor ASA
- 17.2.1.1. Overview
- 17.2.1.2. Products
- 17.2.1.3. SWOT Analysis
- 17.2.1.4. Recent Developments
- 17.2.1.5. Financials (Based on Availability)
- 17.2.2 Shell PLC
- 17.2.2.1. Overview
- 17.2.2.2. Products
- 17.2.2.3. SWOT Analysis
- 17.2.2.4. Recent Developments
- 17.2.2.5. Financials (Based on Availability)
- 17.2.3 Sudan National Petroleum Corporation
- 17.2.3.1. Overview
- 17.2.3.2. Products
- 17.2.3.3. SWOT Analysis
- 17.2.3.4. Recent Developments
- 17.2.3.5. Financials (Based on Availability)
- 17.2.4 China National Petroleum Corporation
- 17.2.4.1. Overview
- 17.2.4.2. Products
- 17.2.4.3. SWOT Analysis
- 17.2.4.4. Recent Developments
- 17.2.4.5. Financials (Based on Availability)
- 17.2.5 Oil and Natural Gas Corporation*List Not Exhaustive
- 17.2.5.1. Overview
- 17.2.5.2. Products
- 17.2.5.3. SWOT Analysis
- 17.2.5.4. Recent Developments
- 17.2.5.5. Financials (Based on Availability)
- 17.2.6 Tullow Oil PLC
- 17.2.6.1. Overview
- 17.2.6.2. Products
- 17.2.6.3. SWOT Analysis
- 17.2.6.4. Recent Developments
- 17.2.6.5. Financials (Based on Availability)
- 17.2.1 Equinor ASA
List of Figures
- Figure 1: East Africa Oil and Gas Market Revenue Breakdown (Million, %) by Product 2024 & 2032
- Figure 2: East Africa Oil and Gas Market Share (%) by Company 2024
List of Tables
- Table 1: East Africa Oil and Gas Market Revenue Million Forecast, by Region 2019 & 2032
- Table 2: East Africa Oil and Gas Market Volume K Tons Forecast, by Region 2019 & 2032
- Table 3: East Africa Oil and Gas Market Revenue Million Forecast, by Sector 2019 & 2032
- Table 4: East Africa Oil and Gas Market Volume K Tons Forecast, by Sector 2019 & 2032
- Table 5: East Africa Oil and Gas Market Revenue Million Forecast, by Location of Development 2019 & 2032
- Table 6: East Africa Oil and Gas Market Volume K Tons Forecast, by Location of Development 2019 & 2032
- Table 7: East Africa Oil and Gas Market Revenue Million Forecast, by Geography 2019 & 2032
- Table 8: East Africa Oil and Gas Market Volume K Tons Forecast, by Geography 2019 & 2032
- Table 9: East Africa Oil and Gas Market Revenue Million Forecast, by Region 2019 & 2032
- Table 10: East Africa Oil and Gas Market Volume K Tons Forecast, by Region 2019 & 2032
- Table 11: East Africa Oil and Gas Market Revenue Million Forecast, by Country 2019 & 2032
- Table 12: East Africa Oil and Gas Market Volume K Tons Forecast, by Country 2019 & 2032
- Table 13: South Africa East Africa Oil and Gas Market Revenue (Million) Forecast, by Application 2019 & 2032
- Table 14: South Africa East Africa Oil and Gas Market Volume (K Tons) Forecast, by Application 2019 & 2032
- Table 15: Sudan East Africa Oil and Gas Market Revenue (Million) Forecast, by Application 2019 & 2032
- Table 16: Sudan East Africa Oil and Gas Market Volume (K Tons) Forecast, by Application 2019 & 2032
- Table 17: Uganda East Africa Oil and Gas Market Revenue (Million) Forecast, by Application 2019 & 2032
- Table 18: Uganda East Africa Oil and Gas Market Volume (K Tons) Forecast, by Application 2019 & 2032
- Table 19: Tanzania East Africa Oil and Gas Market Revenue (Million) Forecast, by Application 2019 & 2032
- Table 20: Tanzania East Africa Oil and Gas Market Volume (K Tons) Forecast, by Application 2019 & 2032
- Table 21: Kenya East Africa Oil and Gas Market Revenue (Million) Forecast, by Application 2019 & 2032
- Table 22: Kenya East Africa Oil and Gas Market Volume (K Tons) Forecast, by Application 2019 & 2032
- Table 23: Rest of Africa East Africa Oil and Gas Market Revenue (Million) Forecast, by Application 2019 & 2032
- Table 24: Rest of Africa East Africa Oil and Gas Market Volume (K Tons) Forecast, by Application 2019 & 2032
- Table 25: East Africa Oil and Gas Market Revenue Million Forecast, by Sector 2019 & 2032
- Table 26: East Africa Oil and Gas Market Volume K Tons Forecast, by Sector 2019 & 2032
- Table 27: East Africa Oil and Gas Market Revenue Million Forecast, by Location of Development 2019 & 2032
- Table 28: East Africa Oil and Gas Market Volume K Tons Forecast, by Location of Development 2019 & 2032
- Table 29: East Africa Oil and Gas Market Revenue Million Forecast, by Geography 2019 & 2032
- Table 30: East Africa Oil and Gas Market Volume K Tons Forecast, by Geography 2019 & 2032
- Table 31: East Africa Oil and Gas Market Revenue Million Forecast, by Country 2019 & 2032
- Table 32: East Africa Oil and Gas Market Volume K Tons Forecast, by Country 2019 & 2032
- Table 33: East Africa Oil and Gas Market Revenue Million Forecast, by Sector 2019 & 2032
- Table 34: East Africa Oil and Gas Market Volume K Tons Forecast, by Sector 2019 & 2032
- Table 35: East Africa Oil and Gas Market Revenue Million Forecast, by Location of Development 2019 & 2032
- Table 36: East Africa Oil and Gas Market Volume K Tons Forecast, by Location of Development 2019 & 2032
- Table 37: East Africa Oil and Gas Market Revenue Million Forecast, by Geography 2019 & 2032
- Table 38: East Africa Oil and Gas Market Volume K Tons Forecast, by Geography 2019 & 2032
- Table 39: East Africa Oil and Gas Market Revenue Million Forecast, by Country 2019 & 2032
- Table 40: East Africa Oil and Gas Market Volume K Tons Forecast, by Country 2019 & 2032
- Table 41: East Africa Oil and Gas Market Revenue Million Forecast, by Sector 2019 & 2032
- Table 42: East Africa Oil and Gas Market Volume K Tons Forecast, by Sector 2019 & 2032
- Table 43: East Africa Oil and Gas Market Revenue Million Forecast, by Location of Development 2019 & 2032
- Table 44: East Africa Oil and Gas Market Volume K Tons Forecast, by Location of Development 2019 & 2032
- Table 45: East Africa Oil and Gas Market Revenue Million Forecast, by Geography 2019 & 2032
- Table 46: East Africa Oil and Gas Market Volume K Tons Forecast, by Geography 2019 & 2032
- Table 47: East Africa Oil and Gas Market Revenue Million Forecast, by Country 2019 & 2032
- Table 48: East Africa Oil and Gas Market Volume K Tons Forecast, by Country 2019 & 2032
- Table 49: East Africa Oil and Gas Market Revenue Million Forecast, by Sector 2019 & 2032
- Table 50: East Africa Oil and Gas Market Volume K Tons Forecast, by Sector 2019 & 2032
- Table 51: East Africa Oil and Gas Market Revenue Million Forecast, by Location of Development 2019 & 2032
- Table 52: East Africa Oil and Gas Market Volume K Tons Forecast, by Location of Development 2019 & 2032
- Table 53: East Africa Oil and Gas Market Revenue Million Forecast, by Geography 2019 & 2032
- Table 54: East Africa Oil and Gas Market Volume K Tons Forecast, by Geography 2019 & 2032
- Table 55: East Africa Oil and Gas Market Revenue Million Forecast, by Country 2019 & 2032
- Table 56: East Africa Oil and Gas Market Volume K Tons Forecast, by Country 2019 & 2032
- Table 57: East Africa Oil and Gas Market Revenue Million Forecast, by Sector 2019 & 2032
- Table 58: East Africa Oil and Gas Market Volume K Tons Forecast, by Sector 2019 & 2032
- Table 59: East Africa Oil and Gas Market Revenue Million Forecast, by Location of Development 2019 & 2032
- Table 60: East Africa Oil and Gas Market Volume K Tons Forecast, by Location of Development 2019 & 2032
- Table 61: East Africa Oil and Gas Market Revenue Million Forecast, by Geography 2019 & 2032
- Table 62: East Africa Oil and Gas Market Volume K Tons Forecast, by Geography 2019 & 2032
- Table 63: East Africa Oil and Gas Market Revenue Million Forecast, by Country 2019 & 2032
- Table 64: East Africa Oil and Gas Market Volume K Tons Forecast, by Country 2019 & 2032
Frequently Asked Questions
1. What is the projected Compound Annual Growth Rate (CAGR) of the East Africa Oil and Gas Market?
The projected CAGR is approximately > 3.00%.
2. Which companies are prominent players in the East Africa Oil and Gas Market?
Key companies in the market include Equinor ASA, Shell PLC, Sudan National Petroleum Corporation, China National Petroleum Corporation, Oil and Natural Gas Corporation*List Not Exhaustive, Tullow Oil PLC.
3. What are the main segments of the East Africa Oil and Gas Market?
The market segments include Sector, Location of Development, Geography.
4. Can you provide details about the market size?
The market size is estimated to be USD XX Million as of 2022.
5. What are some drivers contributing to market growth?
4.; Modernization and Upgrades of Existing Military Aircraft Fleets4.; Increasing Defense Budgets.
6. What are the notable trends driving market growth?
Midstream Sector to Witness Significant Growth.
7. Are there any restraints impacting market growth?
4.; Shift Toward Unmanned Aircraft.
8. Can you provide examples of recent developments in the market?
November 2022: The African, Caribbean, Pacific, and European Union (ACP-EU) Joint Parliamentary Assembly overturned an earlier decision and voted to allow Uganda to develop the East African Crude Pipeline (EACOP) project. The 1,443-kilometer (897-mile)-long pipeline runs from Uganda's Western Region oil wells to Tanzania's seaport of Tanga.
9. What pricing options are available for accessing the report?
Pricing options include single-user, multi-user, and enterprise licenses priced at USD 4750, USD 5250, and USD 8750 respectively.
10. Is the market size provided in terms of value or volume?
The market size is provided in terms of value, measured in Million and volume, measured in K Tons.
11. Are there any specific market keywords associated with the report?
Yes, the market keyword associated with the report is "East Africa Oil and Gas Market," which aids in identifying and referencing the specific market segment covered.
12. How do I determine which pricing option suits my needs best?
The pricing options vary based on user requirements and access needs. Individual users may opt for single-user licenses, while businesses requiring broader access may choose multi-user or enterprise licenses for cost-effective access to the report.
13. Are there any additional resources or data provided in the East Africa Oil and Gas Market report?
While the report offers comprehensive insights, it's advisable to review the specific contents or supplementary materials provided to ascertain if additional resources or data are available.
14. How can I stay updated on further developments or reports in the East Africa Oil and Gas Market?
To stay informed about further developments, trends, and reports in the East Africa Oil and Gas Market, consider subscribing to industry newsletters, following relevant companies and organizations, or regularly checking reputable industry news sources and publications.
Methodology
Step 1 - Identification of Relevant Samples Size from Population Database


Step 2 - Approaches for Defining Global Market Size (Value, Volume* & Price*)

Note*: In applicable scenarios
Step 3 - Data Sources
Primary Research
- Web Analytics
- Survey Reports
- Research Institute
- Latest Research Reports
- Opinion Leaders
Secondary Research
- Annual Reports
- White Paper
- Latest Press Release
- Industry Association
- Paid Database
- Investor Presentations

Step 4 - Data Triangulation
Involves using different sources of information in order to increase the validity of a study
These sources are likely to be stakeholders in a program - participants, other researchers, program staff, other community members, and so on.
Then we put all data in single framework & apply various statistical tools to find out the dynamic on the market.
During the analysis stage, feedback from the stakeholder groups would be compared to determine areas of agreement as well as areas of divergence
