

Key Insights
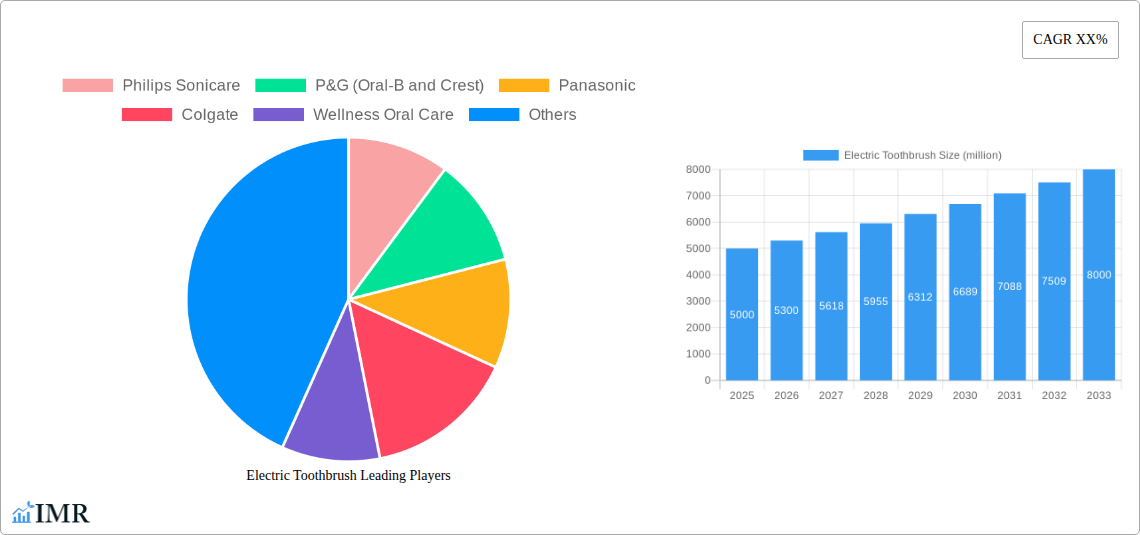
The global electric toothbrush market is experiencing robust growth, driven by increasing consumer awareness of oral hygiene and the convenience and effectiveness of electric toothbrushes compared to manual ones. The market, estimated at $5 billion in 2025, is projected to exhibit a Compound Annual Growth Rate (CAGR) of approximately 6% from 2025 to 2033, reaching a value exceeding $8 billion by 2033. This expansion is fueled by several key trends, including the rising adoption of technologically advanced features like smart sensors, Bluetooth connectivity, and personalized brushing modes. Furthermore, the growing prevalence of dental diseases and the increasing disposable incomes in developing economies are contributing significantly to market growth. Major players like Philips Sonicare, Oral-B, and Colgate are constantly innovating with new product lines and marketing strategies to capture market share, leading to a competitive landscape. However, high initial costs compared to manual toothbrushes and potential concerns about battery life and maintenance represent restraining factors to some degree. Market segmentation reveals strong growth in premium, feature-rich models, while the basic segment maintains a substantial presence due to price sensitivity.
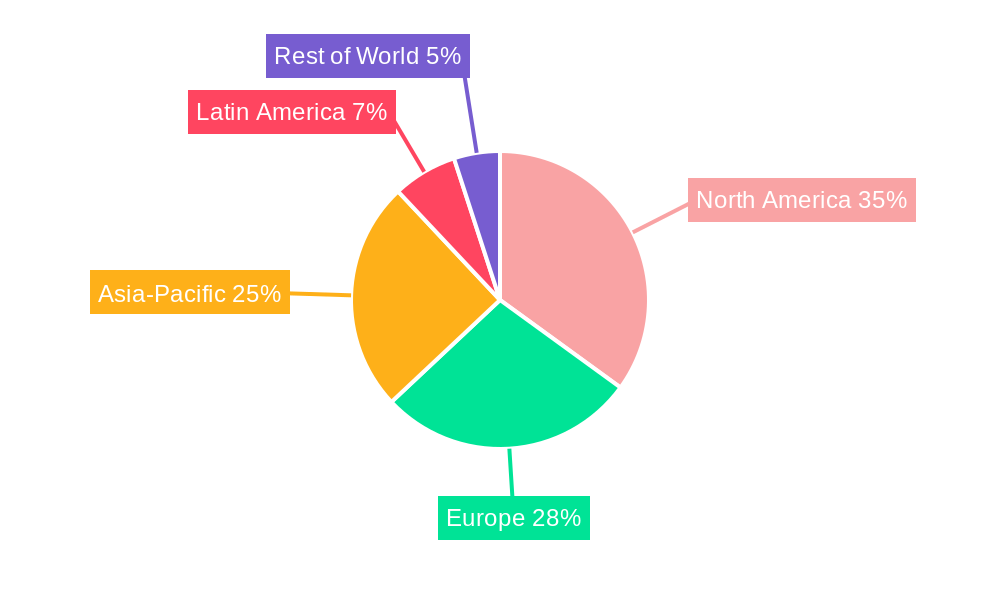
The geographic distribution of the market shows strong growth in North America and Europe, driven by high levels of awareness and disposable income. However, emerging markets in Asia-Pacific and Latin America are also expected to witness significant growth in the coming years, fueled by increasing urbanization and rising middle classes. The competitive landscape is characterized by the presence of established global brands alongside a number of smaller, specialized players. The ongoing focus on innovation, including the integration of artificial intelligence and improved battery technology, is expected to further enhance the market's growth trajectory. Companies are also increasingly emphasizing sustainable practices and eco-friendly materials in their product offerings, catering to growing environmental concerns among consumers. Overall, the electric toothbrush market presents a promising investment opportunity for businesses and investors alike, driven by both evolving consumer preferences and technological advancements.
Electric Toothbrush Market Report: 2019-2033
This comprehensive report provides a detailed analysis of the global electric toothbrush market, encompassing market dynamics, growth trends, regional performance, product landscape, and key players. The study period covers 2019-2033, with a base year of 2025 and a forecast period of 2025-2033. This report is an invaluable resource for industry professionals, investors, and anyone seeking to understand this dynamic market. The global market size is predicted to reach xx million units by 2033.
Electric Toothbrush Market Dynamics & Structure
The electric toothbrush market is characterized by a moderately concentrated structure, with key players like Philips Sonicare, P&G (Oral-B and Crest), and Colgate holding significant market share. Technological innovation, particularly in areas like sonic vibration technology, smart features (e.g., Bluetooth connectivity, app integration), and improved brushing efficacy, is a major driver of growth. Regulatory frameworks concerning safety and efficacy standards play a vital role in shaping the market. The market faces competition from manual toothbrushes, but the superior cleaning capabilities and convenience of electric toothbrushes are driving substitution. End-user demographics, with a rising middle class and increasing awareness of oral hygiene, are significantly impacting market expansion. M&A activity within the industry has been moderate, with several instances of smaller companies being acquired by larger players for technology or market access.
- Market Concentration: Highly concentrated with top 5 players holding approximately xx% market share in 2025.
- Innovation Drivers: Improved brushing technology, smart features, and sustainable materials.
- Regulatory Framework: Stringent safety and efficacy standards influence product development and market access.
- Competitive Substitutes: Manual toothbrushes pose a minor competitive threat due to established consumer preference for electric models.
- End-User Demographics: Growing middle class and increased awareness of oral hygiene are primary growth drivers.
- M&A Trends: Moderate activity, mainly involving smaller companies being acquired for technology or market access; xx deals recorded between 2019 and 2024.
Electric Toothbrush Growth Trends & Insights
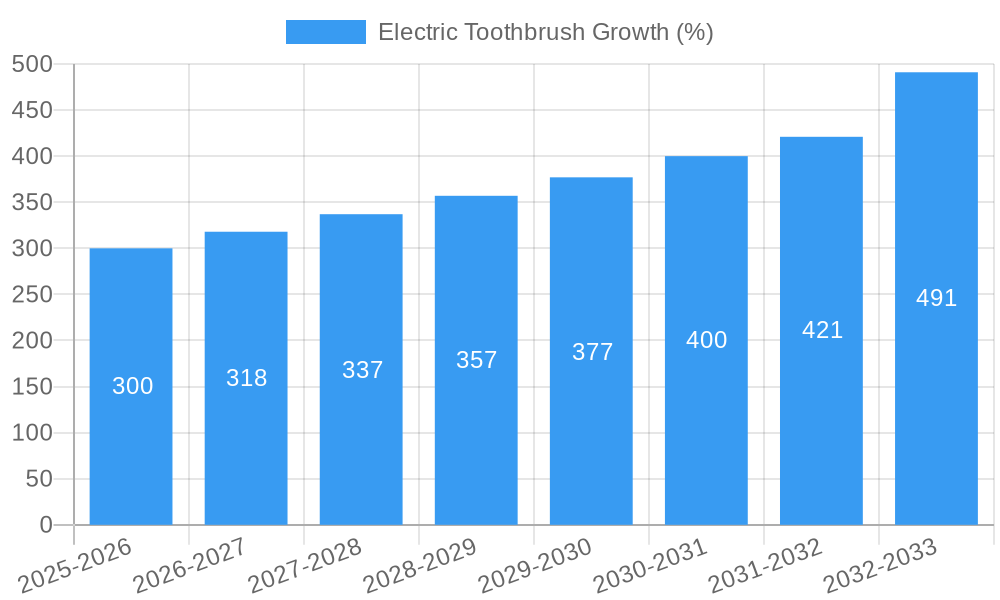
The global electric toothbrush market has exhibited robust growth throughout the historical period (2019-2024). Driven by factors such as rising disposable incomes, increased awareness of oral health, and technological advancements, the market size is expected to grow at a CAGR of xx% from 2025 to 2033, reaching xx million units by 2033. This growth is fueled by increased market penetration, particularly in developing economies. Technological disruptions, such as the introduction of smart toothbrushes and improved battery technology, have significantly boosted adoption rates. Consumer behavior is shifting towards premium, feature-rich models, reflecting a growing demand for advanced oral care solutions. The increasing integration of smart features like AI-powered brushing analysis is creating new opportunities for personalized oral hygiene routines.
Dominant Regions, Countries, or Segments in Electric Toothbrush
North America and Western Europe currently dominate the electric toothbrush market, driven by high consumer awareness, strong disposable incomes, and established distribution channels. However, significant growth potential lies in Asia-Pacific, particularly in rapidly developing economies like India and China. The increasing adoption of electric toothbrushes in these regions is fueled by rising middle-class incomes, increasing awareness of oral hygiene, and the entry of both international and domestic players offering a range of price points. The premium segment, characterized by advanced features and higher prices, is experiencing the fastest growth due to growing consumer preference for advanced technologies and improved oral care experience.
- Key Drivers in North America: High disposable incomes, strong consumer preference for advanced technologies.
- Key Drivers in Asia-Pacific: Growing middle class, rising disposable incomes, increasing awareness of oral hygiene.
- Segment Dominance: The premium segment is demonstrating the highest growth potential owing to features like app integration and improved cleaning efficiency.
Electric Toothbrush Product Landscape
The electric toothbrush market features a diverse range of products, from basic models to sophisticated smart toothbrushes with advanced features like pressure sensors, brushing timers, and Bluetooth connectivity. These innovations aim to improve brushing effectiveness, provide personalized feedback, and enhance user experience. Key selling propositions include improved plaque removal, gum health benefits, and convenience. Technological advancements focus on improving battery life, enhancing brush head designs, and incorporating AI-powered brushing analysis.
Key Drivers, Barriers & Challenges in Electric Toothbrush
Key Drivers:
- Rising disposable incomes in developing economies.
- Growing awareness of oral hygiene and its link to overall health.
- Technological advancements leading to improved brushing efficacy and enhanced user experience.
- Increased marketing and promotional activities by major players.
Key Challenges:
- Competition from manual toothbrushes, particularly in price-sensitive markets.
- High initial cost of electric toothbrushes compared to manual options.
- Supply chain disruptions impacting the availability of raw materials and components.
- Stringent regulatory requirements regarding safety and efficacy.
Emerging Opportunities in Electric Toothbrush
- Expanding into untapped markets in developing economies.
- Development of innovative brush head designs to cater to specific oral care needs (e.g., sensitive gums, orthodontics).
- Increased integration of smart technology for data-driven oral care solutions (e.g., AI-powered brushing analysis).
- Customization of electric toothbrushes based on consumer preferences.
Growth Accelerators in the Electric Toothbrush Industry
Technological advancements, including the development of more efficient motors, longer-lasting batteries, and advanced sensors, are key growth drivers. Strategic partnerships between toothbrush manufacturers and oral healthcare providers can also accelerate market growth by integrating electric toothbrushes into broader oral health management programs. Expansion into new geographical markets, particularly in developing economies with growing middle classes, will also be vital in driving long-term growth.
Key Players Shaping the Electric Toothbrush Market
- Philips Sonicare
- P&G (Oral-B and Crest)
- Panasonic
- Colgate
- Wellness Oral Care
- Interplak (Conair)
- Church & Dwight (Arm & Hammer, Waterpik, Spinbrush)
- Lion
- Lebond
- Ningbo Seago Electric
- Risun Technology
- SEASTAR Corporation
- Minimum
- Dretec
- JSB Healthcare
- Brush Buddies (Soniclean)
- SONIC Chic
- Brio Product
- usmile
- Saky
- Xiaomi
Notable Milestones in Electric Toothbrush Sector
- 2020: Launch of several smart toothbrushes with advanced features.
- 2021: Increased adoption of sustainable materials in electric toothbrush production.
- 2022: Significant investments in research and development of new brushing technologies.
- 2023: Merger of two smaller companies to form a larger player in the market. (xx further details needed)
- 2024: Several key players launch subscription services for brush heads.
In-Depth Electric Toothbrush Market Outlook
The electric toothbrush market is poised for sustained growth over the forecast period, driven by factors such as continuous technological innovation, increasing consumer awareness, and expanding market penetration in developing economies. Strategic partnerships, new product launches, and targeted marketing campaigns will be crucial in further driving market expansion. The premium segment, in particular, holds significant potential, as consumers show an increasing willingness to invest in higher-priced models with advanced features and improved functionality. The market will witness increased competition and consolidation as companies seek to capitalize on the growth opportunities presented by this dynamic market.
Electric Toothbrush Segmentation
-
1. Application
- 1.1. Adults Electric Toothbrush
- 1.2. Children Electric Toothbrush
-
2. Types
- 2.1. Rechargeable Toothbrushes
- 2.2. Battery Powered Toothbrushes
Electric Toothbrush Segmentation By Geography
-
1. North America
- 1.1. United States
- 1.2. Canada
- 1.3. Mexico
-
2. South America
- 2.1. Brazil
- 2.2. Argentina
- 2.3. Rest of South America
-
3. Europe
- 3.1. United Kingdom
- 3.2. Germany
- 3.3. France
- 3.4. Italy
- 3.5. Spain
- 3.6. Russia
- 3.7. Benelux
- 3.8. Nordics
- 3.9. Rest of Europe
-
4. Middle East & Africa
- 4.1. Turkey
- 4.2. Israel
- 4.3. GCC
- 4.4. North Africa
- 4.5. South Africa
- 4.6. Rest of Middle East & Africa
-
5. Asia Pacific
- 5.1. China
- 5.2. India
- 5.3. Japan
- 5.4. South Korea
- 5.5. ASEAN
- 5.6. Oceania
- 5.7. Rest of Asia Pacific
Electric Toothbrush REPORT HIGHLIGHTS
| Aspects | Details |
|---|---|
| Study Period | 2019-2033 |
| Base Year | 2024 |
| Estimated Year | 2025 |
| Forecast Period | 2025-2033 |
| Historical Period | 2019-2024 |
| Growth Rate | CAGR of XX% from 2019-2033 |
| Segmentation |
|
Table of Contents
- 1. Introduction
- 1.1. Research Scope
- 1.2. Market Segmentation
- 1.3. Research Methodology
- 1.4. Definitions and Assumptions
- 2. Executive Summary
- 2.1. Introduction
- 3. Market Dynamics
- 3.1. Introduction
- 3.2. Market Drivers
- 3.3. Market Restrains
- 3.4. Market Trends
- 4. Market Factor Analysis
- 4.1. Porters Five Forces
- 4.2. Supply/Value Chain
- 4.3. PESTEL analysis
- 4.4. Market Entropy
- 4.5. Patent/Trademark Analysis
- 5. Global Electric Toothbrush Analysis, Insights and Forecast, 2019-2031
- 5.1. Market Analysis, Insights and Forecast - by Application
- 5.1.1. Adults Electric Toothbrush
- 5.1.2. Children Electric Toothbrush
- 5.2. Market Analysis, Insights and Forecast - by Types
- 5.2.1. Rechargeable Toothbrushes
- 5.2.2. Battery Powered Toothbrushes
- 5.3. Market Analysis, Insights and Forecast - by Region
- 5.3.1. North America
- 5.3.2. South America
- 5.3.3. Europe
- 5.3.4. Middle East & Africa
- 5.3.5. Asia Pacific
- 5.1. Market Analysis, Insights and Forecast - by Application
- 6. North America Electric Toothbrush Analysis, Insights and Forecast, 2019-2031
- 6.1. Market Analysis, Insights and Forecast - by Application
- 6.1.1. Adults Electric Toothbrush
- 6.1.2. Children Electric Toothbrush
- 6.2. Market Analysis, Insights and Forecast - by Types
- 6.2.1. Rechargeable Toothbrushes
- 6.2.2. Battery Powered Toothbrushes
- 6.1. Market Analysis, Insights and Forecast - by Application
- 7. South America Electric Toothbrush Analysis, Insights and Forecast, 2019-2031
- 7.1. Market Analysis, Insights and Forecast - by Application
- 7.1.1. Adults Electric Toothbrush
- 7.1.2. Children Electric Toothbrush
- 7.2. Market Analysis, Insights and Forecast - by Types
- 7.2.1. Rechargeable Toothbrushes
- 7.2.2. Battery Powered Toothbrushes
- 7.1. Market Analysis, Insights and Forecast - by Application
- 8. Europe Electric Toothbrush Analysis, Insights and Forecast, 2019-2031
- 8.1. Market Analysis, Insights and Forecast - by Application
- 8.1.1. Adults Electric Toothbrush
- 8.1.2. Children Electric Toothbrush
- 8.2. Market Analysis, Insights and Forecast - by Types
- 8.2.1. Rechargeable Toothbrushes
- 8.2.2. Battery Powered Toothbrushes
- 8.1. Market Analysis, Insights and Forecast - by Application
- 9. Middle East & Africa Electric Toothbrush Analysis, Insights and Forecast, 2019-2031
- 9.1. Market Analysis, Insights and Forecast - by Application
- 9.1.1. Adults Electric Toothbrush
- 9.1.2. Children Electric Toothbrush
- 9.2. Market Analysis, Insights and Forecast - by Types
- 9.2.1. Rechargeable Toothbrushes
- 9.2.2. Battery Powered Toothbrushes
- 9.1. Market Analysis, Insights and Forecast - by Application
- 10. Asia Pacific Electric Toothbrush Analysis, Insights and Forecast, 2019-2031
- 10.1. Market Analysis, Insights and Forecast - by Application
- 10.1.1. Adults Electric Toothbrush
- 10.1.2. Children Electric Toothbrush
- 10.2. Market Analysis, Insights and Forecast - by Types
- 10.2.1. Rechargeable Toothbrushes
- 10.2.2. Battery Powered Toothbrushes
- 10.1. Market Analysis, Insights and Forecast - by Application
- 11. Competitive Analysis
- 11.1. Global Market Share Analysis 2024
- 11.2. Company Profiles
- 11.2.1 Philips Sonicare
- 11.2.1.1. Overview
- 11.2.1.2. Products
- 11.2.1.3. SWOT Analysis
- 11.2.1.4. Recent Developments
- 11.2.1.5. Financials (Based on Availability)
- 11.2.2 P&G (Oral-B and Crest)
- 11.2.2.1. Overview
- 11.2.2.2. Products
- 11.2.2.3. SWOT Analysis
- 11.2.2.4. Recent Developments
- 11.2.2.5. Financials (Based on Availability)
- 11.2.3 Panasonic
- 11.2.3.1. Overview
- 11.2.3.2. Products
- 11.2.3.3. SWOT Analysis
- 11.2.3.4. Recent Developments
- 11.2.3.5. Financials (Based on Availability)
- 11.2.4 Colgate
- 11.2.4.1. Overview
- 11.2.4.2. Products
- 11.2.4.3. SWOT Analysis
- 11.2.4.4. Recent Developments
- 11.2.4.5. Financials (Based on Availability)
- 11.2.5 Wellness Oral Care
- 11.2.5.1. Overview
- 11.2.5.2. Products
- 11.2.5.3. SWOT Analysis
- 11.2.5.4. Recent Developments
- 11.2.5.5. Financials (Based on Availability)
- 11.2.6 Interplak(Conair)
- 11.2.6.1. Overview
- 11.2.6.2. Products
- 11.2.6.3. SWOT Analysis
- 11.2.6.4. Recent Developments
- 11.2.6.5. Financials (Based on Availability)
- 11.2.7 Church & Dwight (Arm & Hammer
- 11.2.7.1. Overview
- 11.2.7.2. Products
- 11.2.7.3. SWOT Analysis
- 11.2.7.4. Recent Developments
- 11.2.7.5. Financials (Based on Availability)
- 11.2.8 Waterpik
- 11.2.8.1. Overview
- 11.2.8.2. Products
- 11.2.8.3. SWOT Analysis
- 11.2.8.4. Recent Developments
- 11.2.8.5. Financials (Based on Availability)
- 11.2.9 Spinbrush)
- 11.2.9.1. Overview
- 11.2.9.2. Products
- 11.2.9.3. SWOT Analysis
- 11.2.9.4. Recent Developments
- 11.2.9.5. Financials (Based on Availability)
- 11.2.10 Lion
- 11.2.10.1. Overview
- 11.2.10.2. Products
- 11.2.10.3. SWOT Analysis
- 11.2.10.4. Recent Developments
- 11.2.10.5. Financials (Based on Availability)
- 11.2.11 Lebond
- 11.2.11.1. Overview
- 11.2.11.2. Products
- 11.2.11.3. SWOT Analysis
- 11.2.11.4. Recent Developments
- 11.2.11.5. Financials (Based on Availability)
- 11.2.12 Ningbo Seago Electric
- 11.2.12.1. Overview
- 11.2.12.2. Products
- 11.2.12.3. SWOT Analysis
- 11.2.12.4. Recent Developments
- 11.2.12.5. Financials (Based on Availability)
- 11.2.13 Risun Technology
- 11.2.13.1. Overview
- 11.2.13.2. Products
- 11.2.13.3. SWOT Analysis
- 11.2.13.4. Recent Developments
- 11.2.13.5. Financials (Based on Availability)
- 11.2.14 SEASTAR Corporation
- 11.2.14.1. Overview
- 11.2.14.2. Products
- 11.2.14.3. SWOT Analysis
- 11.2.14.4. Recent Developments
- 11.2.14.5. Financials (Based on Availability)
- 11.2.15 Minimum
- 11.2.15.1. Overview
- 11.2.15.2. Products
- 11.2.15.3. SWOT Analysis
- 11.2.15.4. Recent Developments
- 11.2.15.5. Financials (Based on Availability)
- 11.2.16 Dretec
- 11.2.16.1. Overview
- 11.2.16.2. Products
- 11.2.16.3. SWOT Analysis
- 11.2.16.4. Recent Developments
- 11.2.16.5. Financials (Based on Availability)
- 11.2.17 JSB Healthcare
- 11.2.17.1. Overview
- 11.2.17.2. Products
- 11.2.17.3. SWOT Analysis
- 11.2.17.4. Recent Developments
- 11.2.17.5. Financials (Based on Availability)
- 11.2.18 Brush Buddies (Soniclean)
- 11.2.18.1. Overview
- 11.2.18.2. Products
- 11.2.18.3. SWOT Analysis
- 11.2.18.4. Recent Developments
- 11.2.18.5. Financials (Based on Availability)
- 11.2.19 SONIC Chic
- 11.2.19.1. Overview
- 11.2.19.2. Products
- 11.2.19.3. SWOT Analysis
- 11.2.19.4. Recent Developments
- 11.2.19.5. Financials (Based on Availability)
- 11.2.20 Brio Product
- 11.2.20.1. Overview
- 11.2.20.2. Products
- 11.2.20.3. SWOT Analysis
- 11.2.20.4. Recent Developments
- 11.2.20.5. Financials (Based on Availability)
- 11.2.21 usmile
- 11.2.21.1. Overview
- 11.2.21.2. Products
- 11.2.21.3. SWOT Analysis
- 11.2.21.4. Recent Developments
- 11.2.21.5. Financials (Based on Availability)
- 11.2.22 Saky
- 11.2.22.1. Overview
- 11.2.22.2. Products
- 11.2.22.3. SWOT Analysis
- 11.2.22.4. Recent Developments
- 11.2.22.5. Financials (Based on Availability)
- 11.2.23 Xiaomi
- 11.2.23.1. Overview
- 11.2.23.2. Products
- 11.2.23.3. SWOT Analysis
- 11.2.23.4. Recent Developments
- 11.2.23.5. Financials (Based on Availability)
- 11.2.1 Philips Sonicare
List of Figures
- Figure 1: Global Electric Toothbrush Revenue Breakdown (million, %) by Region 2024 & 2032
- Figure 2: Global Electric Toothbrush Volume Breakdown (K, %) by Region 2024 & 2032
- Figure 3: North America Electric Toothbrush Revenue (million), by Application 2024 & 2032
- Figure 4: North America Electric Toothbrush Volume (K), by Application 2024 & 2032
- Figure 5: North America Electric Toothbrush Revenue Share (%), by Application 2024 & 2032
- Figure 6: North America Electric Toothbrush Volume Share (%), by Application 2024 & 2032
- Figure 7: North America Electric Toothbrush Revenue (million), by Types 2024 & 2032
- Figure 8: North America Electric Toothbrush Volume (K), by Types 2024 & 2032
- Figure 9: North America Electric Toothbrush Revenue Share (%), by Types 2024 & 2032
- Figure 10: North America Electric Toothbrush Volume Share (%), by Types 2024 & 2032
- Figure 11: North America Electric Toothbrush Revenue (million), by Country 2024 & 2032
- Figure 12: North America Electric Toothbrush Volume (K), by Country 2024 & 2032
- Figure 13: North America Electric Toothbrush Revenue Share (%), by Country 2024 & 2032
- Figure 14: North America Electric Toothbrush Volume Share (%), by Country 2024 & 2032
- Figure 15: South America Electric Toothbrush Revenue (million), by Application 2024 & 2032
- Figure 16: South America Electric Toothbrush Volume (K), by Application 2024 & 2032
- Figure 17: South America Electric Toothbrush Revenue Share (%), by Application 2024 & 2032
- Figure 18: South America Electric Toothbrush Volume Share (%), by Application 2024 & 2032
- Figure 19: South America Electric Toothbrush Revenue (million), by Types 2024 & 2032
- Figure 20: South America Electric Toothbrush Volume (K), by Types 2024 & 2032
- Figure 21: South America Electric Toothbrush Revenue Share (%), by Types 2024 & 2032
- Figure 22: South America Electric Toothbrush Volume Share (%), by Types 2024 & 2032
- Figure 23: South America Electric Toothbrush Revenue (million), by Country 2024 & 2032
- Figure 24: South America Electric Toothbrush Volume (K), by Country 2024 & 2032
- Figure 25: South America Electric Toothbrush Revenue Share (%), by Country 2024 & 2032
- Figure 26: South America Electric Toothbrush Volume Share (%), by Country 2024 & 2032
- Figure 27: Europe Electric Toothbrush Revenue (million), by Application 2024 & 2032
- Figure 28: Europe Electric Toothbrush Volume (K), by Application 2024 & 2032
- Figure 29: Europe Electric Toothbrush Revenue Share (%), by Application 2024 & 2032
- Figure 30: Europe Electric Toothbrush Volume Share (%), by Application 2024 & 2032
- Figure 31: Europe Electric Toothbrush Revenue (million), by Types 2024 & 2032
- Figure 32: Europe Electric Toothbrush Volume (K), by Types 2024 & 2032
- Figure 33: Europe Electric Toothbrush Revenue Share (%), by Types 2024 & 2032
- Figure 34: Europe Electric Toothbrush Volume Share (%), by Types 2024 & 2032
- Figure 35: Europe Electric Toothbrush Revenue (million), by Country 2024 & 2032
- Figure 36: Europe Electric Toothbrush Volume (K), by Country 2024 & 2032
- Figure 37: Europe Electric Toothbrush Revenue Share (%), by Country 2024 & 2032
- Figure 38: Europe Electric Toothbrush Volume Share (%), by Country 2024 & 2032
- Figure 39: Middle East & Africa Electric Toothbrush Revenue (million), by Application 2024 & 2032
- Figure 40: Middle East & Africa Electric Toothbrush Volume (K), by Application 2024 & 2032
- Figure 41: Middle East & Africa Electric Toothbrush Revenue Share (%), by Application 2024 & 2032
- Figure 42: Middle East & Africa Electric Toothbrush Volume Share (%), by Application 2024 & 2032
- Figure 43: Middle East & Africa Electric Toothbrush Revenue (million), by Types 2024 & 2032
- Figure 44: Middle East & Africa Electric Toothbrush Volume (K), by Types 2024 & 2032
- Figure 45: Middle East & Africa Electric Toothbrush Revenue Share (%), by Types 2024 & 2032
- Figure 46: Middle East & Africa Electric Toothbrush Volume Share (%), by Types 2024 & 2032
- Figure 47: Middle East & Africa Electric Toothbrush Revenue (million), by Country 2024 & 2032
- Figure 48: Middle East & Africa Electric Toothbrush Volume (K), by Country 2024 & 2032
- Figure 49: Middle East & Africa Electric Toothbrush Revenue Share (%), by Country 2024 & 2032
- Figure 50: Middle East & Africa Electric Toothbrush Volume Share (%), by Country 2024 & 2032
- Figure 51: Asia Pacific Electric Toothbrush Revenue (million), by Application 2024 & 2032
- Figure 52: Asia Pacific Electric Toothbrush Volume (K), by Application 2024 & 2032
- Figure 53: Asia Pacific Electric Toothbrush Revenue Share (%), by Application 2024 & 2032
- Figure 54: Asia Pacific Electric Toothbrush Volume Share (%), by Application 2024 & 2032
- Figure 55: Asia Pacific Electric Toothbrush Revenue (million), by Types 2024 & 2032
- Figure 56: Asia Pacific Electric Toothbrush Volume (K), by Types 2024 & 2032
- Figure 57: Asia Pacific Electric Toothbrush Revenue Share (%), by Types 2024 & 2032
- Figure 58: Asia Pacific Electric Toothbrush Volume Share (%), by Types 2024 & 2032
- Figure 59: Asia Pacific Electric Toothbrush Revenue (million), by Country 2024 & 2032
- Figure 60: Asia Pacific Electric Toothbrush Volume (K), by Country 2024 & 2032
- Figure 61: Asia Pacific Electric Toothbrush Revenue Share (%), by Country 2024 & 2032
- Figure 62: Asia Pacific Electric Toothbrush Volume Share (%), by Country 2024 & 2032
List of Tables
- Table 1: Global Electric Toothbrush Revenue million Forecast, by Region 2019 & 2032
- Table 2: Global Electric Toothbrush Volume K Forecast, by Region 2019 & 2032
- Table 3: Global Electric Toothbrush Revenue million Forecast, by Application 2019 & 2032
- Table 4: Global Electric Toothbrush Volume K Forecast, by Application 2019 & 2032
- Table 5: Global Electric Toothbrush Revenue million Forecast, by Types 2019 & 2032
- Table 6: Global Electric Toothbrush Volume K Forecast, by Types 2019 & 2032
- Table 7: Global Electric Toothbrush Revenue million Forecast, by Region 2019 & 2032
- Table 8: Global Electric Toothbrush Volume K Forecast, by Region 2019 & 2032
- Table 9: Global Electric Toothbrush Revenue million Forecast, by Application 2019 & 2032
- Table 10: Global Electric Toothbrush Volume K Forecast, by Application 2019 & 2032
- Table 11: Global Electric Toothbrush Revenue million Forecast, by Types 2019 & 2032
- Table 12: Global Electric Toothbrush Volume K Forecast, by Types 2019 & 2032
- Table 13: Global Electric Toothbrush Revenue million Forecast, by Country 2019 & 2032
- Table 14: Global Electric Toothbrush Volume K Forecast, by Country 2019 & 2032
- Table 15: United States Electric Toothbrush Revenue (million) Forecast, by Application 2019 & 2032
- Table 16: United States Electric Toothbrush Volume (K) Forecast, by Application 2019 & 2032
- Table 17: Canada Electric Toothbrush Revenue (million) Forecast, by Application 2019 & 2032
- Table 18: Canada Electric Toothbrush Volume (K) Forecast, by Application 2019 & 2032
- Table 19: Mexico Electric Toothbrush Revenue (million) Forecast, by Application 2019 & 2032
- Table 20: Mexico Electric Toothbrush Volume (K) Forecast, by Application 2019 & 2032
- Table 21: Global Electric Toothbrush Revenue million Forecast, by Application 2019 & 2032
- Table 22: Global Electric Toothbrush Volume K Forecast, by Application 2019 & 2032
- Table 23: Global Electric Toothbrush Revenue million Forecast, by Types 2019 & 2032
- Table 24: Global Electric Toothbrush Volume K Forecast, by Types 2019 & 2032
- Table 25: Global Electric Toothbrush Revenue million Forecast, by Country 2019 & 2032
- Table 26: Global Electric Toothbrush Volume K Forecast, by Country 2019 & 2032
- Table 27: Brazil Electric Toothbrush Revenue (million) Forecast, by Application 2019 & 2032
- Table 28: Brazil Electric Toothbrush Volume (K) Forecast, by Application 2019 & 2032
- Table 29: Argentina Electric Toothbrush Revenue (million) Forecast, by Application 2019 & 2032
- Table 30: Argentina Electric Toothbrush Volume (K) Forecast, by Application 2019 & 2032
- Table 31: Rest of South America Electric Toothbrush Revenue (million) Forecast, by Application 2019 & 2032
- Table 32: Rest of South America Electric Toothbrush Volume (K) Forecast, by Application 2019 & 2032
- Table 33: Global Electric Toothbrush Revenue million Forecast, by Application 2019 & 2032
- Table 34: Global Electric Toothbrush Volume K Forecast, by Application 2019 & 2032
- Table 35: Global Electric Toothbrush Revenue million Forecast, by Types 2019 & 2032
- Table 36: Global Electric Toothbrush Volume K Forecast, by Types 2019 & 2032
- Table 37: Global Electric Toothbrush Revenue million Forecast, by Country 2019 & 2032
- Table 38: Global Electric Toothbrush Volume K Forecast, by Country 2019 & 2032
- Table 39: United Kingdom Electric Toothbrush Revenue (million) Forecast, by Application 2019 & 2032
- Table 40: United Kingdom Electric Toothbrush Volume (K) Forecast, by Application 2019 & 2032
- Table 41: Germany Electric Toothbrush Revenue (million) Forecast, by Application 2019 & 2032
- Table 42: Germany Electric Toothbrush Volume (K) Forecast, by Application 2019 & 2032
- Table 43: France Electric Toothbrush Revenue (million) Forecast, by Application 2019 & 2032
- Table 44: France Electric Toothbrush Volume (K) Forecast, by Application 2019 & 2032
- Table 45: Italy Electric Toothbrush Revenue (million) Forecast, by Application 2019 & 2032
- Table 46: Italy Electric Toothbrush Volume (K) Forecast, by Application 2019 & 2032
- Table 47: Spain Electric Toothbrush Revenue (million) Forecast, by Application 2019 & 2032
- Table 48: Spain Electric Toothbrush Volume (K) Forecast, by Application 2019 & 2032
- Table 49: Russia Electric Toothbrush Revenue (million) Forecast, by Application 2019 & 2032
- Table 50: Russia Electric Toothbrush Volume (K) Forecast, by Application 2019 & 2032
- Table 51: Benelux Electric Toothbrush Revenue (million) Forecast, by Application 2019 & 2032
- Table 52: Benelux Electric Toothbrush Volume (K) Forecast, by Application 2019 & 2032
- Table 53: Nordics Electric Toothbrush Revenue (million) Forecast, by Application 2019 & 2032
- Table 54: Nordics Electric Toothbrush Volume (K) Forecast, by Application 2019 & 2032
- Table 55: Rest of Europe Electric Toothbrush Revenue (million) Forecast, by Application 2019 & 2032
- Table 56: Rest of Europe Electric Toothbrush Volume (K) Forecast, by Application 2019 & 2032
- Table 57: Global Electric Toothbrush Revenue million Forecast, by Application 2019 & 2032
- Table 58: Global Electric Toothbrush Volume K Forecast, by Application 2019 & 2032
- Table 59: Global Electric Toothbrush Revenue million Forecast, by Types 2019 & 2032
- Table 60: Global Electric Toothbrush Volume K Forecast, by Types 2019 & 2032
- Table 61: Global Electric Toothbrush Revenue million Forecast, by Country 2019 & 2032
- Table 62: Global Electric Toothbrush Volume K Forecast, by Country 2019 & 2032
- Table 63: Turkey Electric Toothbrush Revenue (million) Forecast, by Application 2019 & 2032
- Table 64: Turkey Electric Toothbrush Volume (K) Forecast, by Application 2019 & 2032
- Table 65: Israel Electric Toothbrush Revenue (million) Forecast, by Application 2019 & 2032
- Table 66: Israel Electric Toothbrush Volume (K) Forecast, by Application 2019 & 2032
- Table 67: GCC Electric Toothbrush Revenue (million) Forecast, by Application 2019 & 2032
- Table 68: GCC Electric Toothbrush Volume (K) Forecast, by Application 2019 & 2032
- Table 69: North Africa Electric Toothbrush Revenue (million) Forecast, by Application 2019 & 2032
- Table 70: North Africa Electric Toothbrush Volume (K) Forecast, by Application 2019 & 2032
- Table 71: South Africa Electric Toothbrush Revenue (million) Forecast, by Application 2019 & 2032
- Table 72: South Africa Electric Toothbrush Volume (K) Forecast, by Application 2019 & 2032
- Table 73: Rest of Middle East & Africa Electric Toothbrush Revenue (million) Forecast, by Application 2019 & 2032
- Table 74: Rest of Middle East & Africa Electric Toothbrush Volume (K) Forecast, by Application 2019 & 2032
- Table 75: Global Electric Toothbrush Revenue million Forecast, by Application 2019 & 2032
- Table 76: Global Electric Toothbrush Volume K Forecast, by Application 2019 & 2032
- Table 77: Global Electric Toothbrush Revenue million Forecast, by Types 2019 & 2032
- Table 78: Global Electric Toothbrush Volume K Forecast, by Types 2019 & 2032
- Table 79: Global Electric Toothbrush Revenue million Forecast, by Country 2019 & 2032
- Table 80: Global Electric Toothbrush Volume K Forecast, by Country 2019 & 2032
- Table 81: China Electric Toothbrush Revenue (million) Forecast, by Application 2019 & 2032
- Table 82: China Electric Toothbrush Volume (K) Forecast, by Application 2019 & 2032
- Table 83: India Electric Toothbrush Revenue (million) Forecast, by Application 2019 & 2032
- Table 84: India Electric Toothbrush Volume (K) Forecast, by Application 2019 & 2032
- Table 85: Japan Electric Toothbrush Revenue (million) Forecast, by Application 2019 & 2032
- Table 86: Japan Electric Toothbrush Volume (K) Forecast, by Application 2019 & 2032
- Table 87: South Korea Electric Toothbrush Revenue (million) Forecast, by Application 2019 & 2032
- Table 88: South Korea Electric Toothbrush Volume (K) Forecast, by Application 2019 & 2032
- Table 89: ASEAN Electric Toothbrush Revenue (million) Forecast, by Application 2019 & 2032
- Table 90: ASEAN Electric Toothbrush Volume (K) Forecast, by Application 2019 & 2032
- Table 91: Oceania Electric Toothbrush Revenue (million) Forecast, by Application 2019 & 2032
- Table 92: Oceania Electric Toothbrush Volume (K) Forecast, by Application 2019 & 2032
- Table 93: Rest of Asia Pacific Electric Toothbrush Revenue (million) Forecast, by Application 2019 & 2032
- Table 94: Rest of Asia Pacific Electric Toothbrush Volume (K) Forecast, by Application 2019 & 2032
Frequently Asked Questions
1. What is the projected Compound Annual Growth Rate (CAGR) of the Electric Toothbrush?
The projected CAGR is approximately XX%.
2. Which companies are prominent players in the Electric Toothbrush?
Key companies in the market include Philips Sonicare, P&G (Oral-B and Crest), Panasonic, Colgate, Wellness Oral Care, Interplak(Conair), Church & Dwight (Arm & Hammer, Waterpik, Spinbrush), Lion, Lebond, Ningbo Seago Electric, Risun Technology, SEASTAR Corporation, Minimum, Dretec, JSB Healthcare, Brush Buddies (Soniclean), SONIC Chic, Brio Product, usmile, Saky, Xiaomi.
3. What are the main segments of the Electric Toothbrush?
The market segments include Application, Types.
4. Can you provide details about the market size?
The market size is estimated to be USD XXX million as of 2022.
5. What are some drivers contributing to market growth?
N/A
6. What are the notable trends driving market growth?
N/A
7. Are there any restraints impacting market growth?
N/A
8. Can you provide examples of recent developments in the market?
N/A
9. What pricing options are available for accessing the report?
Pricing options include single-user, multi-user, and enterprise licenses priced at USD 3350.00, USD 5025.00, and USD 6700.00 respectively.
10. Is the market size provided in terms of value or volume?
The market size is provided in terms of value, measured in million and volume, measured in K.
11. Are there any specific market keywords associated with the report?
Yes, the market keyword associated with the report is "Electric Toothbrush," which aids in identifying and referencing the specific market segment covered.
12. How do I determine which pricing option suits my needs best?
The pricing options vary based on user requirements and access needs. Individual users may opt for single-user licenses, while businesses requiring broader access may choose multi-user or enterprise licenses for cost-effective access to the report.
13. Are there any additional resources or data provided in the Electric Toothbrush report?
While the report offers comprehensive insights, it's advisable to review the specific contents or supplementary materials provided to ascertain if additional resources or data are available.
14. How can I stay updated on further developments or reports in the Electric Toothbrush?
To stay informed about further developments, trends, and reports in the Electric Toothbrush, consider subscribing to industry newsletters, following relevant companies and organizations, or regularly checking reputable industry news sources and publications.
Methodology
Step 1 - Identification of Relevant Samples Size from Population Database


Step 2 - Approaches for Defining Global Market Size (Value, Volume* & Price*)

Note*: In applicable scenarios
Step 3 - Data Sources
Primary Research
- Web Analytics
- Survey Reports
- Research Institute
- Latest Research Reports
- Opinion Leaders
Secondary Research
- Annual Reports
- White Paper
- Latest Press Release
- Industry Association
- Paid Database
- Investor Presentations

Step 4 - Data Triangulation
Involves using different sources of information in order to increase the validity of a study
These sources are likely to be stakeholders in a program - participants, other researchers, program staff, other community members, and so on.
Then we put all data in single framework & apply various statistical tools to find out the dynamic on the market.
During the analysis stage, feedback from the stakeholder groups would be compared to determine areas of agreement as well as areas of divergence
