

Key Insights
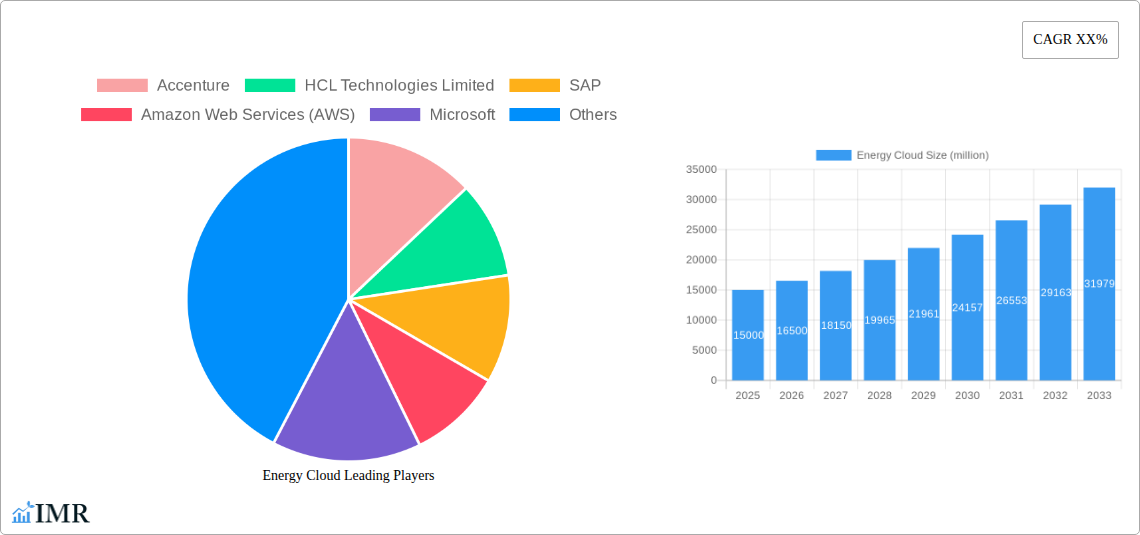
The Energy Cloud market is experiencing significant growth, driven by the increasing need for digital transformation within the energy sector. The convergence of cloud computing and the energy industry is fostering innovation across various sub-sectors, including renewable energy, oil and gas, and utilities. Companies are adopting cloud solutions to enhance operational efficiency, improve grid management, optimize resource allocation, and accelerate the integration of renewable energy sources. This transition is propelled by the need to reduce operational costs, improve reliability, and respond to the evolving demands of a decarbonizing energy landscape. Key drivers include the rising adoption of IoT devices, the need for advanced analytics for predictive maintenance, and the desire for enhanced cybersecurity in critical energy infrastructure. The market is witnessing a shift towards hybrid and multi-cloud deployments, reflecting a strategic approach to data management and security. Leading technology providers like Accenture, HCL Technologies, SAP, AWS, Microsoft, Google, Huawei, Tencent, Alibaba, Baidu, and Salesforce are actively contributing to this growth by offering specialized cloud solutions tailored to the specific needs of energy companies. We project a robust growth trajectory for the Energy Cloud market over the forecast period, fueled by ongoing technological advancements and the expanding adoption of digital strategies across the energy sector.
The competitive landscape is characterized by a mix of established technology giants and specialized energy solution providers. The market is witnessing strategic partnerships and acquisitions as companies strive to expand their market share and offer comprehensive solutions. The growth is not without its challenges; concerns surrounding data security, regulatory compliance, and the need for skilled workforce to manage these complex systems remain key restraints. However, the long-term prospects for the Energy Cloud market remain positive, with considerable potential for growth in emerging economies and the continued integration of advanced technologies like AI and machine learning. Further segmentation within the market (e.g., by cloud service model, deployment type, and application) will further refine the understanding of this dynamic and crucial sector. We anticipate a continued shift towards sustainable practices and enhanced grid modernization, further driving the adoption of Energy Cloud solutions.
Energy Cloud Market Report: 2019-2033 Forecast
This comprehensive report provides an in-depth analysis of the Energy Cloud market, encompassing market dynamics, growth trends, regional dominance, product landscape, key players, and future outlook. The study period covers 2019-2033, with a base year of 2025 and a forecast period of 2025-2033. The report leverages extensive data analysis to provide actionable insights for industry professionals, investors, and strategic decision-makers. Parent Market: Cloud Computing; Child Market: Energy Sector Cloud Solutions.
Energy Cloud Market Dynamics & Structure
The Energy Cloud market, valued at $XX million in 2024, is experiencing significant growth driven by technological advancements, increasing digitization within the energy sector, and stringent regulatory pressures for improved efficiency and sustainability. Market concentration is moderate, with key players like Accenture, HCL Technologies Limited, SAP, Amazon Web Services (AWS), Microsoft, Google, Huawei, Tencent, Alibaba (Ali), Baidu, and Salesforce vying for market share.
- Market Concentration: Moderate, with top 5 players holding approximately XX% of the market share in 2024.
- Technological Innovation: Advancements in AI, IoT, and blockchain are driving the adoption of sophisticated energy management solutions.
- Regulatory Frameworks: Government initiatives promoting renewable energy and energy efficiency are fostering market growth.
- Competitive Substitutes: On-premise energy management systems pose a competitive threat.
- End-User Demographics: Utilities, oil & gas companies, and renewable energy producers are the primary end-users.
- M&A Trends: A total of XX M&A deals were recorded during the historical period (2019-2024), indicating a consolidating market. The average deal size was $XX million.
Energy Cloud Growth Trends & Insights
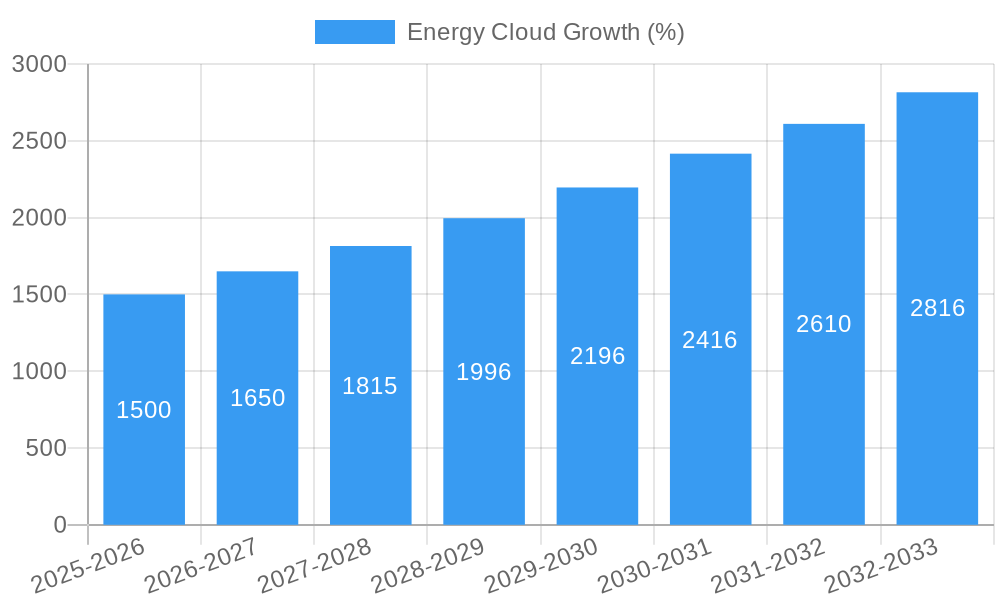
The Energy Cloud market exhibits a robust Compound Annual Growth Rate (CAGR) of XX% during the forecast period (2025-2033), driven by increasing energy demands, the need for improved grid management, and the proliferation of smart grids. Market penetration is expected to reach XX% by 2033, indicating significant growth potential. The transition to renewable energy sources is a key driver, as is the growing adoption of cloud-based solutions for improved operational efficiency and cost optimization. Technological disruptions, such as the integration of AI and machine learning for predictive maintenance and demand forecasting, further fuel market expansion. Consumer behavior shifts towards sustainable energy consumption and corporate sustainability goals are also influencing market adoption.
Dominant Regions, Countries, or Segments in Energy Cloud
North America currently holds the largest market share in the Energy Cloud sector, followed by Europe and Asia-Pacific. The dominance of North America is attributed to early adoption of cloud technologies, robust infrastructure, and supportive regulatory environments.
- Key Drivers in North America: Strong government support for renewable energy initiatives, advanced technological infrastructure, and a high concentration of major energy companies.
- Growth Potential in Asia-Pacific: Rapid economic growth, increasing energy demand, and government investments in smart grid technologies are driving market expansion in this region.
- Market Share: North America holds approximately XX% of the global market share in 2024.
Energy Cloud Product Landscape
Energy Cloud solutions encompass a range of products, including energy management systems, smart grid solutions, renewable energy integration platforms, and predictive maintenance tools. These solutions leverage advanced technologies like AI, machine learning, and IoT to optimize energy production, distribution, and consumption. Key features include enhanced data analytics, improved operational efficiency, and reduced carbon footprint. The unique selling propositions are focused on cost reduction, enhanced security, and scalability.
Key Drivers, Barriers & Challenges in Energy Cloud
Key Drivers:
- Increasing demand for renewable energy sources.
- Stringent environmental regulations promoting energy efficiency.
- Growing adoption of smart grids and IoT devices.
Challenges:
- Data security and privacy concerns.
- High initial investment costs for cloud infrastructure.
- Integration complexities with existing legacy systems. This has resulted in an estimated XX% project failure rate in 2024.
Emerging Opportunities in Energy Cloud
The market presents significant opportunities in areas such as microgrid management, distributed energy resource optimization, and the integration of blockchain technology for secure energy trading. Untapped markets in developing countries with growing energy demands also present significant growth prospects. The increasing focus on carbon neutrality presents a considerable opportunity for energy-efficient cloud solutions.
Growth Accelerators in the Energy Cloud Industry
Technological advancements, particularly in AI and machine learning, are major catalysts for long-term growth. Strategic partnerships between energy companies and technology providers are facilitating faster market penetration. Expansion into new geographical markets, especially in developing economies, presents significant growth potential.
Key Players Shaping the Energy Cloud Market
- Accenture
- HCL Technologies Limited
- SAP
- Amazon Web Services (AWS)
- Microsoft
- Huawei
- Tencent
- Alibaba (Ali)
- Baidu
- Salesforce
Notable Milestones in Energy Cloud Sector
- 2020: AWS launched its energy-focused cloud platform.
- 2021: Microsoft partnered with several energy companies to develop cloud-based solutions for renewable energy integration.
- 2022: Several major M&A deals consolidated market players.
- 2023: Significant advancements in AI-powered predictive maintenance tools were released.
In-Depth Energy Cloud Market Outlook
The Energy Cloud market is poised for sustained growth, driven by ongoing technological innovation, increasing adoption rates, and supportive regulatory environments. Strategic investments in renewable energy and the expansion of smart grids will further fuel market expansion. Companies focusing on innovative solutions and strategic partnerships will be best positioned to capture significant market share in the coming years. The market is expected to reach $XX million by 2033.
Energy Cloud Segmentation
-
1. Application
- 1.1. Oil Industry
- 1.2. Power Industry
- 1.3. Coal Industry
- 1.4. Others
-
2. Types
- 2.1. Software
- 2.2. Service
Energy Cloud Segmentation By Geography
-
1. North America
- 1.1. United States
- 1.2. Canada
- 1.3. Mexico
-
2. South America
- 2.1. Brazil
- 2.2. Argentina
- 2.3. Rest of South America
-
3. Europe
- 3.1. United Kingdom
- 3.2. Germany
- 3.3. France
- 3.4. Italy
- 3.5. Spain
- 3.6. Russia
- 3.7. Benelux
- 3.8. Nordics
- 3.9. Rest of Europe
-
4. Middle East & Africa
- 4.1. Turkey
- 4.2. Israel
- 4.3. GCC
- 4.4. North Africa
- 4.5. South Africa
- 4.6. Rest of Middle East & Africa
-
5. Asia Pacific
- 5.1. China
- 5.2. India
- 5.3. Japan
- 5.4. South Korea
- 5.5. ASEAN
- 5.6. Oceania
- 5.7. Rest of Asia Pacific

Energy Cloud REPORT HIGHLIGHTS
| Aspects | Details |
|---|---|
| Study Period | 2019-2033 |
| Base Year | 2024 |
| Estimated Year | 2025 |
| Forecast Period | 2025-2033 |
| Historical Period | 2019-2024 |
| Growth Rate | CAGR of XX% from 2019-2033 |
| Segmentation |
|
Table of Contents
- 1. Introduction
- 1.1. Research Scope
- 1.2. Market Segmentation
- 1.3. Research Methodology
- 1.4. Definitions and Assumptions
- 2. Executive Summary
- 2.1. Introduction
- 3. Market Dynamics
- 3.1. Introduction
- 3.2. Market Drivers
- 3.3. Market Restrains
- 3.4. Market Trends
- 4. Market Factor Analysis
- 4.1. Porters Five Forces
- 4.2. Supply/Value Chain
- 4.3. PESTEL analysis
- 4.4. Market Entropy
- 4.5. Patent/Trademark Analysis
- 5. Global Energy Cloud Analysis, Insights and Forecast, 2019-2031
- 5.1. Market Analysis, Insights and Forecast - by Application
- 5.1.1. Oil Industry
- 5.1.2. Power Industry
- 5.1.3. Coal Industry
- 5.1.4. Others
- 5.2. Market Analysis, Insights and Forecast - by Types
- 5.2.1. Software
- 5.2.2. Service
- 5.3. Market Analysis, Insights and Forecast - by Region
- 5.3.1. North America
- 5.3.2. South America
- 5.3.3. Europe
- 5.3.4. Middle East & Africa
- 5.3.5. Asia Pacific
- 5.1. Market Analysis, Insights and Forecast - by Application
- 6. North America Energy Cloud Analysis, Insights and Forecast, 2019-2031
- 6.1. Market Analysis, Insights and Forecast - by Application
- 6.1.1. Oil Industry
- 6.1.2. Power Industry
- 6.1.3. Coal Industry
- 6.1.4. Others
- 6.2. Market Analysis, Insights and Forecast - by Types
- 6.2.1. Software
- 6.2.2. Service
- 6.1. Market Analysis, Insights and Forecast - by Application
- 7. South America Energy Cloud Analysis, Insights and Forecast, 2019-2031
- 7.1. Market Analysis, Insights and Forecast - by Application
- 7.1.1. Oil Industry
- 7.1.2. Power Industry
- 7.1.3. Coal Industry
- 7.1.4. Others
- 7.2. Market Analysis, Insights and Forecast - by Types
- 7.2.1. Software
- 7.2.2. Service
- 7.1. Market Analysis, Insights and Forecast - by Application
- 8. Europe Energy Cloud Analysis, Insights and Forecast, 2019-2031
- 8.1. Market Analysis, Insights and Forecast - by Application
- 8.1.1. Oil Industry
- 8.1.2. Power Industry
- 8.1.3. Coal Industry
- 8.1.4. Others
- 8.2. Market Analysis, Insights and Forecast - by Types
- 8.2.1. Software
- 8.2.2. Service
- 8.1. Market Analysis, Insights and Forecast - by Application
- 9. Middle East & Africa Energy Cloud Analysis, Insights and Forecast, 2019-2031
- 9.1. Market Analysis, Insights and Forecast - by Application
- 9.1.1. Oil Industry
- 9.1.2. Power Industry
- 9.1.3. Coal Industry
- 9.1.4. Others
- 9.2. Market Analysis, Insights and Forecast - by Types
- 9.2.1. Software
- 9.2.2. Service
- 9.1. Market Analysis, Insights and Forecast - by Application
- 10. Asia Pacific Energy Cloud Analysis, Insights and Forecast, 2019-2031
- 10.1. Market Analysis, Insights and Forecast - by Application
- 10.1.1. Oil Industry
- 10.1.2. Power Industry
- 10.1.3. Coal Industry
- 10.1.4. Others
- 10.2. Market Analysis, Insights and Forecast - by Types
- 10.2.1. Software
- 10.2.2. Service
- 10.1. Market Analysis, Insights and Forecast - by Application
- 11. Competitive Analysis
- 11.1. Global Market Share Analysis 2024
- 11.2. Company Profiles
- 11.2.1 Accenture
- 11.2.1.1. Overview
- 11.2.1.2. Products
- 11.2.1.3. SWOT Analysis
- 11.2.1.4. Recent Developments
- 11.2.1.5. Financials (Based on Availability)
- 11.2.2 HCL Technologies Limited
- 11.2.2.1. Overview
- 11.2.2.2. Products
- 11.2.2.3. SWOT Analysis
- 11.2.2.4. Recent Developments
- 11.2.2.5. Financials (Based on Availability)
- 11.2.3 SAP
- 11.2.3.1. Overview
- 11.2.3.2. Products
- 11.2.3.3. SWOT Analysis
- 11.2.3.4. Recent Developments
- 11.2.3.5. Financials (Based on Availability)
- 11.2.4 Amazon Web Services (AWS)
- 11.2.4.1. Overview
- 11.2.4.2. Products
- 11.2.4.3. SWOT Analysis
- 11.2.4.4. Recent Developments
- 11.2.4.5. Financials (Based on Availability)
- 11.2.5 Microsoft
- 11.2.5.1. Overview
- 11.2.5.2. Products
- 11.2.5.3. SWOT Analysis
- 11.2.5.4. Recent Developments
- 11.2.5.5. Financials (Based on Availability)
- 11.2.6 Google
- 11.2.6.1. Overview
- 11.2.6.2. Products
- 11.2.6.3. SWOT Analysis
- 11.2.6.4. Recent Developments
- 11.2.6.5. Financials (Based on Availability)
- 11.2.7 Huawei
- 11.2.7.1. Overview
- 11.2.7.2. Products
- 11.2.7.3. SWOT Analysis
- 11.2.7.4. Recent Developments
- 11.2.7.5. Financials (Based on Availability)
- 11.2.8 Tecent
- 11.2.8.1. Overview
- 11.2.8.2. Products
- 11.2.8.3. SWOT Analysis
- 11.2.8.4. Recent Developments
- 11.2.8.5. Financials (Based on Availability)
- 11.2.9 Ali
- 11.2.9.1. Overview
- 11.2.9.2. Products
- 11.2.9.3. SWOT Analysis
- 11.2.9.4. Recent Developments
- 11.2.9.5. Financials (Based on Availability)
- 11.2.10 Baidu
- 11.2.10.1. Overview
- 11.2.10.2. Products
- 11.2.10.3. SWOT Analysis
- 11.2.10.4. Recent Developments
- 11.2.10.5. Financials (Based on Availability)
- 11.2.11 Saleforce
- 11.2.11.1. Overview
- 11.2.11.2. Products
- 11.2.11.3. SWOT Analysis
- 11.2.11.4. Recent Developments
- 11.2.11.5. Financials (Based on Availability)
- 11.2.1 Accenture
List of Figures
- Figure 1: Global Energy Cloud Revenue Breakdown (million, %) by Region 2024 & 2032
- Figure 2: North America Energy Cloud Revenue (million), by Application 2024 & 2032
- Figure 3: North America Energy Cloud Revenue Share (%), by Application 2024 & 2032
- Figure 4: North America Energy Cloud Revenue (million), by Types 2024 & 2032
- Figure 5: North America Energy Cloud Revenue Share (%), by Types 2024 & 2032
- Figure 6: North America Energy Cloud Revenue (million), by Country 2024 & 2032
- Figure 7: North America Energy Cloud Revenue Share (%), by Country 2024 & 2032
- Figure 8: South America Energy Cloud Revenue (million), by Application 2024 & 2032
- Figure 9: South America Energy Cloud Revenue Share (%), by Application 2024 & 2032
- Figure 10: South America Energy Cloud Revenue (million), by Types 2024 & 2032
- Figure 11: South America Energy Cloud Revenue Share (%), by Types 2024 & 2032
- Figure 12: South America Energy Cloud Revenue (million), by Country 2024 & 2032
- Figure 13: South America Energy Cloud Revenue Share (%), by Country 2024 & 2032
- Figure 14: Europe Energy Cloud Revenue (million), by Application 2024 & 2032
- Figure 15: Europe Energy Cloud Revenue Share (%), by Application 2024 & 2032
- Figure 16: Europe Energy Cloud Revenue (million), by Types 2024 & 2032
- Figure 17: Europe Energy Cloud Revenue Share (%), by Types 2024 & 2032
- Figure 18: Europe Energy Cloud Revenue (million), by Country 2024 & 2032
- Figure 19: Europe Energy Cloud Revenue Share (%), by Country 2024 & 2032
- Figure 20: Middle East & Africa Energy Cloud Revenue (million), by Application 2024 & 2032
- Figure 21: Middle East & Africa Energy Cloud Revenue Share (%), by Application 2024 & 2032
- Figure 22: Middle East & Africa Energy Cloud Revenue (million), by Types 2024 & 2032
- Figure 23: Middle East & Africa Energy Cloud Revenue Share (%), by Types 2024 & 2032
- Figure 24: Middle East & Africa Energy Cloud Revenue (million), by Country 2024 & 2032
- Figure 25: Middle East & Africa Energy Cloud Revenue Share (%), by Country 2024 & 2032
- Figure 26: Asia Pacific Energy Cloud Revenue (million), by Application 2024 & 2032
- Figure 27: Asia Pacific Energy Cloud Revenue Share (%), by Application 2024 & 2032
- Figure 28: Asia Pacific Energy Cloud Revenue (million), by Types 2024 & 2032
- Figure 29: Asia Pacific Energy Cloud Revenue Share (%), by Types 2024 & 2032
- Figure 30: Asia Pacific Energy Cloud Revenue (million), by Country 2024 & 2032
- Figure 31: Asia Pacific Energy Cloud Revenue Share (%), by Country 2024 & 2032
List of Tables
- Table 1: Global Energy Cloud Revenue million Forecast, by Region 2019 & 2032
- Table 2: Global Energy Cloud Revenue million Forecast, by Application 2019 & 2032
- Table 3: Global Energy Cloud Revenue million Forecast, by Types 2019 & 2032
- Table 4: Global Energy Cloud Revenue million Forecast, by Region 2019 & 2032
- Table 5: Global Energy Cloud Revenue million Forecast, by Application 2019 & 2032
- Table 6: Global Energy Cloud Revenue million Forecast, by Types 2019 & 2032
- Table 7: Global Energy Cloud Revenue million Forecast, by Country 2019 & 2032
- Table 8: United States Energy Cloud Revenue (million) Forecast, by Application 2019 & 2032
- Table 9: Canada Energy Cloud Revenue (million) Forecast, by Application 2019 & 2032
- Table 10: Mexico Energy Cloud Revenue (million) Forecast, by Application 2019 & 2032
- Table 11: Global Energy Cloud Revenue million Forecast, by Application 2019 & 2032
- Table 12: Global Energy Cloud Revenue million Forecast, by Types 2019 & 2032
- Table 13: Global Energy Cloud Revenue million Forecast, by Country 2019 & 2032
- Table 14: Brazil Energy Cloud Revenue (million) Forecast, by Application 2019 & 2032
- Table 15: Argentina Energy Cloud Revenue (million) Forecast, by Application 2019 & 2032
- Table 16: Rest of South America Energy Cloud Revenue (million) Forecast, by Application 2019 & 2032
- Table 17: Global Energy Cloud Revenue million Forecast, by Application 2019 & 2032
- Table 18: Global Energy Cloud Revenue million Forecast, by Types 2019 & 2032
- Table 19: Global Energy Cloud Revenue million Forecast, by Country 2019 & 2032
- Table 20: United Kingdom Energy Cloud Revenue (million) Forecast, by Application 2019 & 2032
- Table 21: Germany Energy Cloud Revenue (million) Forecast, by Application 2019 & 2032
- Table 22: France Energy Cloud Revenue (million) Forecast, by Application 2019 & 2032
- Table 23: Italy Energy Cloud Revenue (million) Forecast, by Application 2019 & 2032
- Table 24: Spain Energy Cloud Revenue (million) Forecast, by Application 2019 & 2032
- Table 25: Russia Energy Cloud Revenue (million) Forecast, by Application 2019 & 2032
- Table 26: Benelux Energy Cloud Revenue (million) Forecast, by Application 2019 & 2032
- Table 27: Nordics Energy Cloud Revenue (million) Forecast, by Application 2019 & 2032
- Table 28: Rest of Europe Energy Cloud Revenue (million) Forecast, by Application 2019 & 2032
- Table 29: Global Energy Cloud Revenue million Forecast, by Application 2019 & 2032
- Table 30: Global Energy Cloud Revenue million Forecast, by Types 2019 & 2032
- Table 31: Global Energy Cloud Revenue million Forecast, by Country 2019 & 2032
- Table 32: Turkey Energy Cloud Revenue (million) Forecast, by Application 2019 & 2032
- Table 33: Israel Energy Cloud Revenue (million) Forecast, by Application 2019 & 2032
- Table 34: GCC Energy Cloud Revenue (million) Forecast, by Application 2019 & 2032
- Table 35: North Africa Energy Cloud Revenue (million) Forecast, by Application 2019 & 2032
- Table 36: South Africa Energy Cloud Revenue (million) Forecast, by Application 2019 & 2032
- Table 37: Rest of Middle East & Africa Energy Cloud Revenue (million) Forecast, by Application 2019 & 2032
- Table 38: Global Energy Cloud Revenue million Forecast, by Application 2019 & 2032
- Table 39: Global Energy Cloud Revenue million Forecast, by Types 2019 & 2032
- Table 40: Global Energy Cloud Revenue million Forecast, by Country 2019 & 2032
- Table 41: China Energy Cloud Revenue (million) Forecast, by Application 2019 & 2032
- Table 42: India Energy Cloud Revenue (million) Forecast, by Application 2019 & 2032
- Table 43: Japan Energy Cloud Revenue (million) Forecast, by Application 2019 & 2032
- Table 44: South Korea Energy Cloud Revenue (million) Forecast, by Application 2019 & 2032
- Table 45: ASEAN Energy Cloud Revenue (million) Forecast, by Application 2019 & 2032
- Table 46: Oceania Energy Cloud Revenue (million) Forecast, by Application 2019 & 2032
- Table 47: Rest of Asia Pacific Energy Cloud Revenue (million) Forecast, by Application 2019 & 2032
Frequently Asked Questions
1. What is the projected Compound Annual Growth Rate (CAGR) of the Energy Cloud?
The projected CAGR is approximately XX%.
2. Which companies are prominent players in the Energy Cloud?
Key companies in the market include Accenture, HCL Technologies Limited, SAP, Amazon Web Services (AWS), Microsoft, Google, Huawei, Tecent, Ali, Baidu, Saleforce.
3. What are the main segments of the Energy Cloud?
The market segments include Application, Types.
4. Can you provide details about the market size?
The market size is estimated to be USD XXX million as of 2022.
5. What are some drivers contributing to market growth?
N/A
6. What are the notable trends driving market growth?
N/A
7. Are there any restraints impacting market growth?
N/A
8. Can you provide examples of recent developments in the market?
N/A
9. What pricing options are available for accessing the report?
Pricing options include single-user, multi-user, and enterprise licenses priced at USD 4900.00, USD 7350.00, and USD 9800.00 respectively.
10. Is the market size provided in terms of value or volume?
The market size is provided in terms of value, measured in million.
11. Are there any specific market keywords associated with the report?
Yes, the market keyword associated with the report is "Energy Cloud," which aids in identifying and referencing the specific market segment covered.
12. How do I determine which pricing option suits my needs best?
The pricing options vary based on user requirements and access needs. Individual users may opt for single-user licenses, while businesses requiring broader access may choose multi-user or enterprise licenses for cost-effective access to the report.
13. Are there any additional resources or data provided in the Energy Cloud report?
While the report offers comprehensive insights, it's advisable to review the specific contents or supplementary materials provided to ascertain if additional resources or data are available.
14. How can I stay updated on further developments or reports in the Energy Cloud?
To stay informed about further developments, trends, and reports in the Energy Cloud, consider subscribing to industry newsletters, following relevant companies and organizations, or regularly checking reputable industry news sources and publications.
Methodology
Step 1 - Identification of Relevant Samples Size from Population Database


Step 2 - Approaches for Defining Global Market Size (Value, Volume* & Price*)

Note*: In applicable scenarios
Step 3 - Data Sources
Primary Research
- Web Analytics
- Survey Reports
- Research Institute
- Latest Research Reports
- Opinion Leaders
Secondary Research
- Annual Reports
- White Paper
- Latest Press Release
- Industry Association
- Paid Database
- Investor Presentations

Step 4 - Data Triangulation
Involves using different sources of information in order to increase the validity of a study
These sources are likely to be stakeholders in a program - participants, other researchers, program staff, other community members, and so on.
Then we put all data in single framework & apply various statistical tools to find out the dynamic on the market.
During the analysis stage, feedback from the stakeholder groups would be compared to determine areas of agreement as well as areas of divergence
