

Key Insights
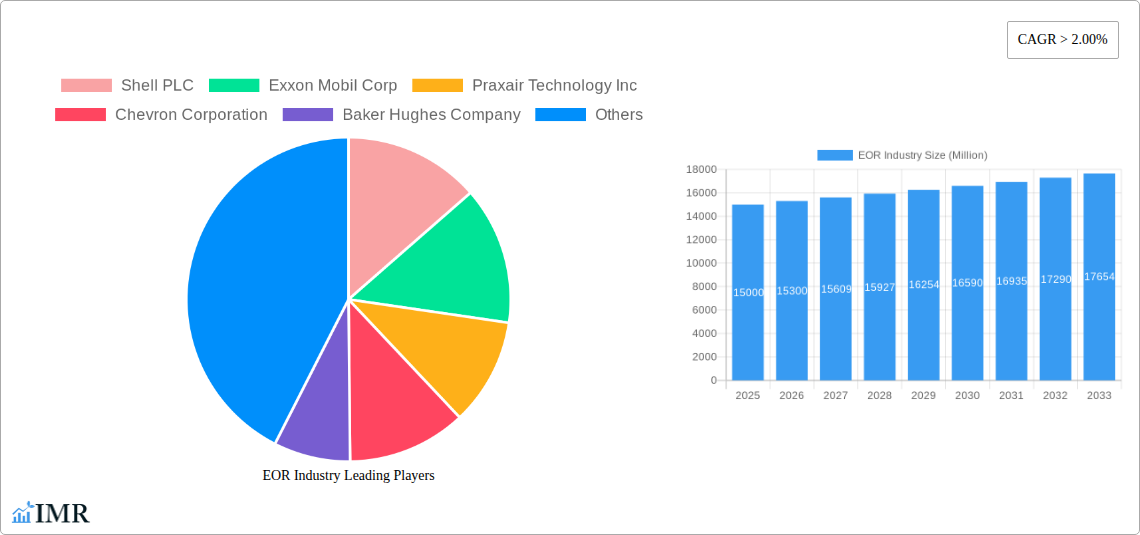
The Enhanced Oil Recovery (EOR) market is experiencing robust growth, driven by increasing global energy demand and dwindling conventional oil reserves. A CAGR exceeding 2.00% indicates a steadily expanding market, projected to reach significant value by 2033. Several factors contribute to this expansion. Firstly, technological advancements in techniques like gas injection, thermal injection, and chemical injection are improving recovery rates and making EOR economically viable in previously challenging reservoirs. Secondly, the rising prices of crude oil incentivize investment in EOR projects, making them more attractive despite the high initial capital costs. Finally, a growing focus on sustainable energy solutions and a shift toward reducing carbon emissions necessitates maximizing production from existing wells, further fueling EOR adoption. The market is segmented geographically, with North America and the Asia-Pacific region representing significant portions due to substantial oil reserves and ongoing exploration activities. Onshore projects currently dominate, but offshore EOR is gaining traction, especially with the development of improved technologies suited to the challenging offshore environments. Leading players in the EOR market, including Shell, ExxonMobil, and Schlumberger, are strategically investing in research and development to enhance their technological capabilities and expand their market share. These companies are also focused on collaborations and partnerships to access advanced technologies and optimize resource utilization.
Competition within the EOR market is intense, with established players and emerging technology providers vying for market share. The market faces challenges such as fluctuating oil prices, stringent environmental regulations, and the high capital expenditure required for EOR projects. Nevertheless, the long-term outlook remains positive due to the continued need for oil, the increasing efficiency of EOR techniques, and the potential for breakthroughs in microbial EOR, which presents a more environmentally friendly approach. The market's geographical diversity also offers considerable expansion opportunities, particularly in regions with underdeveloped oil fields and potential for EOR implementation. Furthermore, governments worldwide are actively promoting energy security through investment incentives and supportive policies for EOR projects, contributing to the market’s positive growth trajectory.
EOR Industry Market Report: 2019-2033
This comprehensive report provides a detailed analysis of the Enhanced Oil Recovery (EOR) industry, encompassing market dynamics, growth trends, regional insights, and key player strategies. The report covers the period from 2019 to 2033, with a focus on the forecast period from 2025 to 2033 and a base year of 2025. This in-depth analysis is crucial for industry professionals, investors, and stakeholders seeking to understand and capitalize on the evolving opportunities within this dynamic sector. The parent market is the Oil and Gas industry, and the child market is Enhanced Oil Recovery.
EOR Industry Market Dynamics & Structure
The EOR market is characterized by moderate concentration, with several major players holding significant market share. Technological innovation, particularly in chemical and microbial injection techniques, is a key driver. Stringent environmental regulations are shaping industry practices, while the availability of alternative energy sources presents a competitive challenge. End-user demographics largely consist of established oil and gas companies seeking to extend the lifespan of mature oil fields. M&A activity remains significant, with larger companies acquiring smaller technology providers to enhance their EOR capabilities.
- Market Concentration: Moderately concentrated, with top 5 companies holding approximately xx% market share in 2025.
- Technological Innovation: Focus on efficiency, cost reduction, and environmental impact mitigation drives innovation in chemical, microbial, and thermal injection.
- Regulatory Framework: Stringent environmental regulations influence technology adoption and operational practices.
- Competitive Substitutes: Alternative energy sources and declining oil prices pose competitive pressures.
- M&A Trends: Consistent M&A activity observed, with xx billion in deals recorded between 2019 and 2024.
- Innovation Barriers: High R&D costs, lengthy testing phases, and regulatory approvals pose challenges.
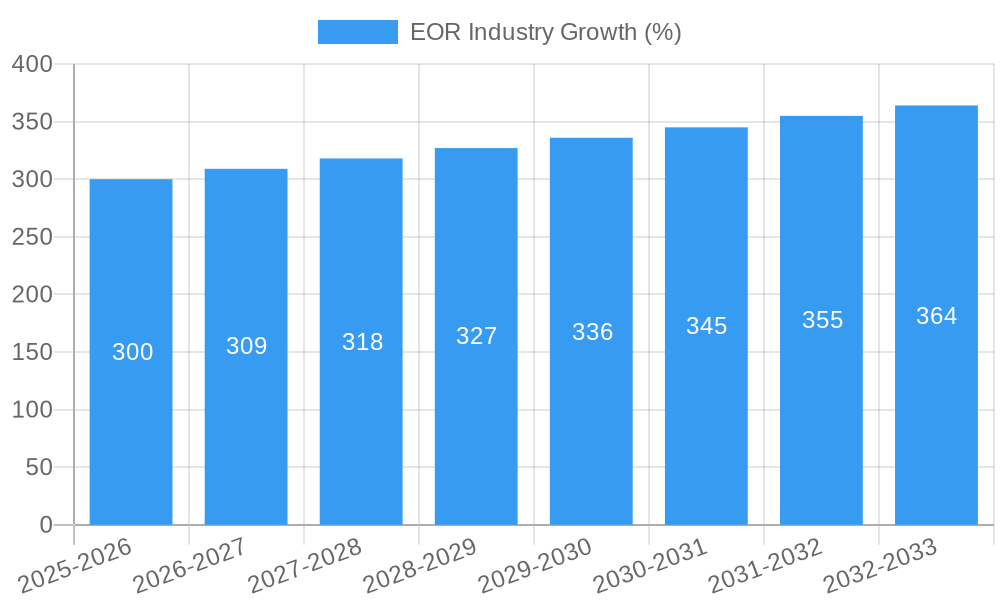
EOR Industry Growth Trends & Insights
The EOR market is projected to experience substantial growth during the forecast period. Driven by increasing demand for oil, the need to enhance production from mature fields, and technological advancements, the market is poised for significant expansion. Adoption rates for advanced EOR techniques are increasing gradually, although challenges associated with cost and complexity remain. Consumer behavior shifts toward environmentally friendly practices are influencing the adoption of cleaner EOR technologies.
The global EOR market size was valued at xx Million in 2024 and is projected to reach xx Million by 2033, exhibiting a CAGR of xx% during the forecast period. Market penetration of advanced EOR technologies is expected to increase from xx% in 2024 to xx% by 2033.
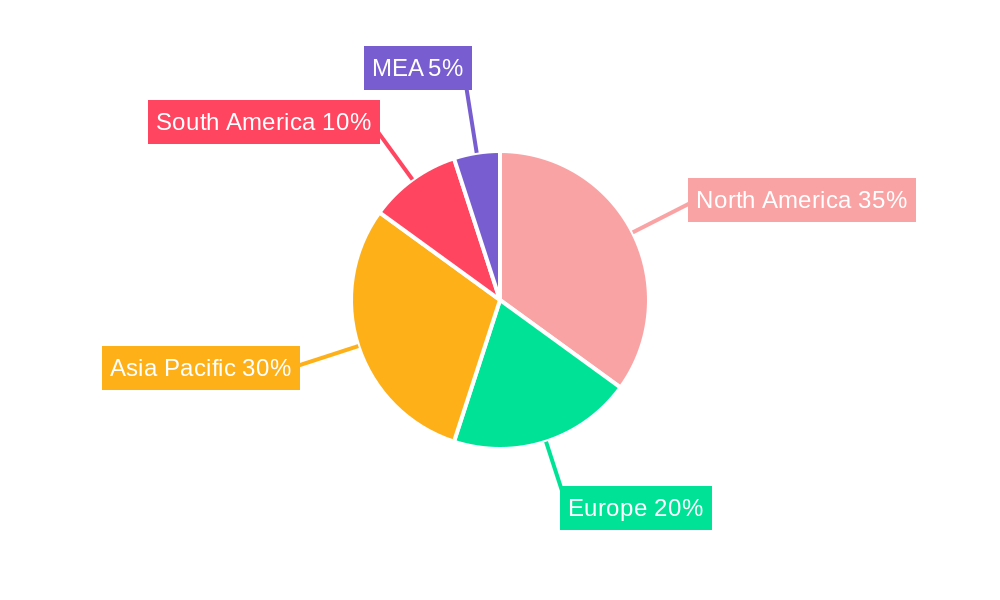
Dominant Regions, Countries, or Segments in EOR Industry
The Middle East and North America currently dominate the EOR market, driven by large oil reserves and established infrastructure. Onshore deployments represent the largest segment, though offshore EOR is growing rapidly, particularly in regions with significant offshore oil reserves. Chemical injection remains the dominant technology segment due to its established track record and relatively lower upfront cost. However, microbial injection and other emerging technologies are gaining traction due to their potential for improved efficiency and reduced environmental impact.
- Leading Region: Middle East and North America (xx% market share in 2025).
- Key Drivers: Large oil reserves, existing infrastructure, and supportive government policies.
- Onshore Dominance: Established infrastructure and lower deployment costs contribute to higher market share.
- Chemical Injection Leadership: Mature technology, cost-effectiveness, and proven results drive its wide adoption.
- Growth Potential: Offshore and emerging technologies like microbial injection offer high growth potential.
EOR Industry Product Landscape
The EOR product landscape is characterized by a wide range of chemicals, equipment, and services tailored to specific reservoir conditions. Recent innovations focus on improving the efficiency and effectiveness of existing techniques, as well as developing environmentally friendly alternatives. Unique selling propositions often center on enhanced performance metrics, reduced environmental footprint, and optimized cost-effectiveness. The focus is on improving recovery rates, reducing water usage, and minimizing the overall carbon footprint of oil extraction.
Key Drivers, Barriers & Challenges in EOR Industry
Key Drivers: The increasing demand for oil, the need to extract oil from mature fields, government incentives for enhanced oil recovery, and technological advancements in EOR technologies are the primary drivers. For instance, the growing global energy consumption continuously drives the need for efficient oil extraction methods.
Key Challenges and Restraints: High upfront costs associated with EOR projects, complex reservoir conditions, environmental regulations, and the availability of skilled labor represent significant challenges. The fluctuation in oil prices also creates uncertainty and can hinder investment in EOR projects. Supply chain disruptions can lead to project delays and increased costs. For example, the supply chain disruptions observed in recent years have impacted the availability of specialized equipment and chemicals, affecting EOR projects' timelines and budgets.
Emerging Opportunities in EOR Industry
Emerging opportunities in the EOR industry include the expansion into unconventional oil reservoirs, the development of more sustainable and environmentally friendly EOR techniques, and the application of advanced data analytics and machine learning to optimize EOR processes. Untapped markets in developing countries with significant oil reserves also present significant growth potential.
Growth Accelerators in the EOR Industry
Technological breakthroughs in areas such as nanotechnology, biotechnology, and advanced materials are playing a crucial role in boosting the EOR market's growth. Strategic partnerships between oil companies and technology providers are accelerating the development and deployment of innovative EOR techniques. The expansion into new geographical regions with significant oil reserves presents further growth opportunities. Further, government incentives and supportive regulatory frameworks are creating a favorable investment climate.
Key Players Shaping the EOR Industry Market
- Shell PLC
- Exxon Mobil Corp
- Praxair Technology Inc
- Chevron Corporation
- Baker Hughes Company
- TotalEnergies SE
- Halliburton Company
- Weatherford International PLC
- BP PLC
- Schlumberger Limited
Notable Milestones in EOR Industry Sector
- July 2021: Sinopec launched China's largest CCUS project, reinjecting CO2 for EOR.
- August 2021: J-Power and Schlumberger planned a joint study on CO2-free hydrogen production for EOR.
- October 2021: Gazprom Neft and Tatarstan signed an agreement on EOR technology development.
- October 2021: LUKOIL and Gazprom Neft agreed to cooperate on enhancing oil recovery projects.
In-Depth EOR Industry Market Outlook
The EOR market is poised for robust growth, driven by technological advancements, strategic partnerships, and increasing demand for oil. Opportunities abound in untapped markets, the development of sustainable EOR techniques, and the application of data analytics. Companies that proactively embrace innovation and strategic collaborations are best positioned to capitalize on the significant long-term potential of this sector. The focus on optimizing recovery rates and minimizing environmental impact will shape future market dynamics and drive investment in this crucial industry.
EOR Industry Segmentation
-
1. Technology
- 1.1. Gas Injection
- 1.2. Thermal Injection
- 1.3. Chemical Injection
- 1.4. Microbial Injection
- 1.5. Other Technologies
-
2. Location of Deployment
- 2.1. Onshore
- 2.2. Offshore
EOR Industry Segmentation By Geography
- 1. North America
- 2. Europe
- 3. Asia Pacific
- 4. South America
- 5. Middle East
EOR Industry REPORT HIGHLIGHTS
| Aspects | Details |
|---|---|
| Study Period | 2019-2033 |
| Base Year | 2024 |
| Estimated Year | 2025 |
| Forecast Period | 2025-2033 |
| Historical Period | 2019-2024 |
| Growth Rate | CAGR of > 2.00% from 2019-2033 |
| Segmentation |
|
Table of Contents
- 1. Introduction
- 1.1. Research Scope
- 1.2. Market Segmentation
- 1.3. Research Methodology
- 1.4. Definitions and Assumptions
- 2. Executive Summary
- 2.1. Introduction
- 3. Market Dynamics
- 3.1. Introduction
- 3.2. Market Drivers
- 3.2.1. 4.; Rapid Recovery in the Oil and Gas and Mining Industries4.; Surge in the Construction Industry
- 3.3. Market Restrains
- 3.3.1. 4.; High Maintenance and Operation Costs of Submersible Pump Restrain the Market
- 3.4. Market Trends
- 3.4.1. Gas Injection Technique to Dominate the Market
- 4. Market Factor Analysis
- 4.1. Porters Five Forces
- 4.2. Supply/Value Chain
- 4.3. PESTEL analysis
- 4.4. Market Entropy
- 4.5. Patent/Trademark Analysis
- 5. Global EOR Industry Analysis, Insights and Forecast, 2019-2031
- 5.1. Market Analysis, Insights and Forecast - by Technology
- 5.1.1. Gas Injection
- 5.1.2. Thermal Injection
- 5.1.3. Chemical Injection
- 5.1.4. Microbial Injection
- 5.1.5. Other Technologies
- 5.2. Market Analysis, Insights and Forecast - by Location of Deployment
- 5.2.1. Onshore
- 5.2.2. Offshore
- 5.3. Market Analysis, Insights and Forecast - by Region
- 5.3.1. North America
- 5.3.2. Europe
- 5.3.3. Asia Pacific
- 5.3.4. South America
- 5.3.5. Middle East
- 5.1. Market Analysis, Insights and Forecast - by Technology
- 6. North America EOR Industry Analysis, Insights and Forecast, 2019-2031
- 6.1. Market Analysis, Insights and Forecast - by Technology
- 6.1.1. Gas Injection
- 6.1.2. Thermal Injection
- 6.1.3. Chemical Injection
- 6.1.4. Microbial Injection
- 6.1.5. Other Technologies
- 6.2. Market Analysis, Insights and Forecast - by Location of Deployment
- 6.2.1. Onshore
- 6.2.2. Offshore
- 6.1. Market Analysis, Insights and Forecast - by Technology
- 7. Europe EOR Industry Analysis, Insights and Forecast, 2019-2031
- 7.1. Market Analysis, Insights and Forecast - by Technology
- 7.1.1. Gas Injection
- 7.1.2. Thermal Injection
- 7.1.3. Chemical Injection
- 7.1.4. Microbial Injection
- 7.1.5. Other Technologies
- 7.2. Market Analysis, Insights and Forecast - by Location of Deployment
- 7.2.1. Onshore
- 7.2.2. Offshore
- 7.1. Market Analysis, Insights and Forecast - by Technology
- 8. Asia Pacific EOR Industry Analysis, Insights and Forecast, 2019-2031
- 8.1. Market Analysis, Insights and Forecast - by Technology
- 8.1.1. Gas Injection
- 8.1.2. Thermal Injection
- 8.1.3. Chemical Injection
- 8.1.4. Microbial Injection
- 8.1.5. Other Technologies
- 8.2. Market Analysis, Insights and Forecast - by Location of Deployment
- 8.2.1. Onshore
- 8.2.2. Offshore
- 8.1. Market Analysis, Insights and Forecast - by Technology
- 9. South America EOR Industry Analysis, Insights and Forecast, 2019-2031
- 9.1. Market Analysis, Insights and Forecast - by Technology
- 9.1.1. Gas Injection
- 9.1.2. Thermal Injection
- 9.1.3. Chemical Injection
- 9.1.4. Microbial Injection
- 9.1.5. Other Technologies
- 9.2. Market Analysis, Insights and Forecast - by Location of Deployment
- 9.2.1. Onshore
- 9.2.2. Offshore
- 9.1. Market Analysis, Insights and Forecast - by Technology
- 10. Middle East EOR Industry Analysis, Insights and Forecast, 2019-2031
- 10.1. Market Analysis, Insights and Forecast - by Technology
- 10.1.1. Gas Injection
- 10.1.2. Thermal Injection
- 10.1.3. Chemical Injection
- 10.1.4. Microbial Injection
- 10.1.5. Other Technologies
- 10.2. Market Analysis, Insights and Forecast - by Location of Deployment
- 10.2.1. Onshore
- 10.2.2. Offshore
- 10.1. Market Analysis, Insights and Forecast - by Technology
- 11. North America EOR Industry Analysis, Insights and Forecast, 2019-2031
- 11.1. Market Analysis, Insights and Forecast - By Country/Sub-region
- 11.1.1 United States
- 11.1.2 Canada
- 11.1.3 Mexico
- 12. Europe EOR Industry Analysis, Insights and Forecast, 2019-2031
- 12.1. Market Analysis, Insights and Forecast - By Country/Sub-region
- 12.1.1 Germany
- 12.1.2 United Kingdom
- 12.1.3 France
- 12.1.4 Spain
- 12.1.5 Italy
- 12.1.6 Spain
- 12.1.7 Belgium
- 12.1.8 Netherland
- 12.1.9 Nordics
- 12.1.10 Rest of Europe
- 13. Asia Pacific EOR Industry Analysis, Insights and Forecast, 2019-2031
- 13.1. Market Analysis, Insights and Forecast - By Country/Sub-region
- 13.1.1 China
- 13.1.2 Japan
- 13.1.3 India
- 13.1.4 South Korea
- 13.1.5 Southeast Asia
- 13.1.6 Australia
- 13.1.7 Indonesia
- 13.1.8 Phillipes
- 13.1.9 Singapore
- 13.1.10 Thailandc
- 13.1.11 Rest of Asia Pacific
- 14. South America EOR Industry Analysis, Insights and Forecast, 2019-2031
- 14.1. Market Analysis, Insights and Forecast - By Country/Sub-region
- 14.1.1 Brazil
- 14.1.2 Argentina
- 14.1.3 Peru
- 14.1.4 Chile
- 14.1.5 Colombia
- 14.1.6 Ecuador
- 14.1.7 Venezuela
- 14.1.8 Rest of South America
- 15. North America EOR Industry Analysis, Insights and Forecast, 2019-2031
- 15.1. Market Analysis, Insights and Forecast - By Country/Sub-region
- 15.1.1 United States
- 15.1.2 Canada
- 15.1.3 Mexico
- 16. MEA EOR Industry Analysis, Insights and Forecast, 2019-2031
- 16.1. Market Analysis, Insights and Forecast - By Country/Sub-region
- 16.1.1 United Arab Emirates
- 16.1.2 Saudi Arabia
- 16.1.3 South Africa
- 16.1.4 Rest of Middle East and Africa
- 17. Competitive Analysis
- 17.1. Global Market Share Analysis 2024
- 17.2. Company Profiles
- 17.2.1 Shell PLC
- 17.2.1.1. Overview
- 17.2.1.2. Products
- 17.2.1.3. SWOT Analysis
- 17.2.1.4. Recent Developments
- 17.2.1.5. Financials (Based on Availability)
- 17.2.2 Exxon Mobil Corp
- 17.2.2.1. Overview
- 17.2.2.2. Products
- 17.2.2.3. SWOT Analysis
- 17.2.2.4. Recent Developments
- 17.2.2.5. Financials (Based on Availability)
- 17.2.3 Praxair Technology Inc
- 17.2.3.1. Overview
- 17.2.3.2. Products
- 17.2.3.3. SWOT Analysis
- 17.2.3.4. Recent Developments
- 17.2.3.5. Financials (Based on Availability)
- 17.2.4 Chevron Corporation
- 17.2.4.1. Overview
- 17.2.4.2. Products
- 17.2.4.3. SWOT Analysis
- 17.2.4.4. Recent Developments
- 17.2.4.5. Financials (Based on Availability)
- 17.2.5 Baker Hughes Company
- 17.2.5.1. Overview
- 17.2.5.2. Products
- 17.2.5.3. SWOT Analysis
- 17.2.5.4. Recent Developments
- 17.2.5.5. Financials (Based on Availability)
- 17.2.6 TotalEnergies SE
- 17.2.6.1. Overview
- 17.2.6.2. Products
- 17.2.6.3. SWOT Analysis
- 17.2.6.4. Recent Developments
- 17.2.6.5. Financials (Based on Availability)
- 17.2.7 Halliburton Company
- 17.2.7.1. Overview
- 17.2.7.2. Products
- 17.2.7.3. SWOT Analysis
- 17.2.7.4. Recent Developments
- 17.2.7.5. Financials (Based on Availability)
- 17.2.8 Weatherford International PLC*List Not Exhaustive
- 17.2.8.1. Overview
- 17.2.8.2. Products
- 17.2.8.3. SWOT Analysis
- 17.2.8.4. Recent Developments
- 17.2.8.5. Financials (Based on Availability)
- 17.2.9 BP PLC
- 17.2.9.1. Overview
- 17.2.9.2. Products
- 17.2.9.3. SWOT Analysis
- 17.2.9.4. Recent Developments
- 17.2.9.5. Financials (Based on Availability)
- 17.2.10 Schlumberger Limited
- 17.2.10.1. Overview
- 17.2.10.2. Products
- 17.2.10.3. SWOT Analysis
- 17.2.10.4. Recent Developments
- 17.2.10.5. Financials (Based on Availability)
- 17.2.1 Shell PLC
List of Figures
- Figure 1: Global EOR Industry Revenue Breakdown (Million, %) by Region 2024 & 2032
- Figure 2: North America EOR Industry Revenue (Million), by Country 2024 & 2032
- Figure 3: North America EOR Industry Revenue Share (%), by Country 2024 & 2032
- Figure 4: Europe EOR Industry Revenue (Million), by Country 2024 & 2032
- Figure 5: Europe EOR Industry Revenue Share (%), by Country 2024 & 2032
- Figure 6: Asia Pacific EOR Industry Revenue (Million), by Country 2024 & 2032
- Figure 7: Asia Pacific EOR Industry Revenue Share (%), by Country 2024 & 2032
- Figure 8: South America EOR Industry Revenue (Million), by Country 2024 & 2032
- Figure 9: South America EOR Industry Revenue Share (%), by Country 2024 & 2032
- Figure 10: North America EOR Industry Revenue (Million), by Country 2024 & 2032
- Figure 11: North America EOR Industry Revenue Share (%), by Country 2024 & 2032
- Figure 12: MEA EOR Industry Revenue (Million), by Country 2024 & 2032
- Figure 13: MEA EOR Industry Revenue Share (%), by Country 2024 & 2032
- Figure 14: North America EOR Industry Revenue (Million), by Technology 2024 & 2032
- Figure 15: North America EOR Industry Revenue Share (%), by Technology 2024 & 2032
- Figure 16: North America EOR Industry Revenue (Million), by Location of Deployment 2024 & 2032
- Figure 17: North America EOR Industry Revenue Share (%), by Location of Deployment 2024 & 2032
- Figure 18: North America EOR Industry Revenue (Million), by Country 2024 & 2032
- Figure 19: North America EOR Industry Revenue Share (%), by Country 2024 & 2032
- Figure 20: Europe EOR Industry Revenue (Million), by Technology 2024 & 2032
- Figure 21: Europe EOR Industry Revenue Share (%), by Technology 2024 & 2032
- Figure 22: Europe EOR Industry Revenue (Million), by Location of Deployment 2024 & 2032
- Figure 23: Europe EOR Industry Revenue Share (%), by Location of Deployment 2024 & 2032
- Figure 24: Europe EOR Industry Revenue (Million), by Country 2024 & 2032
- Figure 25: Europe EOR Industry Revenue Share (%), by Country 2024 & 2032
- Figure 26: Asia Pacific EOR Industry Revenue (Million), by Technology 2024 & 2032
- Figure 27: Asia Pacific EOR Industry Revenue Share (%), by Technology 2024 & 2032
- Figure 28: Asia Pacific EOR Industry Revenue (Million), by Location of Deployment 2024 & 2032
- Figure 29: Asia Pacific EOR Industry Revenue Share (%), by Location of Deployment 2024 & 2032
- Figure 30: Asia Pacific EOR Industry Revenue (Million), by Country 2024 & 2032
- Figure 31: Asia Pacific EOR Industry Revenue Share (%), by Country 2024 & 2032
- Figure 32: South America EOR Industry Revenue (Million), by Technology 2024 & 2032
- Figure 33: South America EOR Industry Revenue Share (%), by Technology 2024 & 2032
- Figure 34: South America EOR Industry Revenue (Million), by Location of Deployment 2024 & 2032
- Figure 35: South America EOR Industry Revenue Share (%), by Location of Deployment 2024 & 2032
- Figure 36: South America EOR Industry Revenue (Million), by Country 2024 & 2032
- Figure 37: South America EOR Industry Revenue Share (%), by Country 2024 & 2032
- Figure 38: Middle East EOR Industry Revenue (Million), by Technology 2024 & 2032
- Figure 39: Middle East EOR Industry Revenue Share (%), by Technology 2024 & 2032
- Figure 40: Middle East EOR Industry Revenue (Million), by Location of Deployment 2024 & 2032
- Figure 41: Middle East EOR Industry Revenue Share (%), by Location of Deployment 2024 & 2032
- Figure 42: Middle East EOR Industry Revenue (Million), by Country 2024 & 2032
- Figure 43: Middle East EOR Industry Revenue Share (%), by Country 2024 & 2032
List of Tables
- Table 1: Global EOR Industry Revenue Million Forecast, by Region 2019 & 2032
- Table 2: Global EOR Industry Revenue Million Forecast, by Technology 2019 & 2032
- Table 3: Global EOR Industry Revenue Million Forecast, by Location of Deployment 2019 & 2032
- Table 4: Global EOR Industry Revenue Million Forecast, by Region 2019 & 2032
- Table 5: Global EOR Industry Revenue Million Forecast, by Country 2019 & 2032
- Table 6: United States EOR Industry Revenue (Million) Forecast, by Application 2019 & 2032
- Table 7: Canada EOR Industry Revenue (Million) Forecast, by Application 2019 & 2032
- Table 8: Mexico EOR Industry Revenue (Million) Forecast, by Application 2019 & 2032
- Table 9: Global EOR Industry Revenue Million Forecast, by Country 2019 & 2032
- Table 10: Germany EOR Industry Revenue (Million) Forecast, by Application 2019 & 2032
- Table 11: United Kingdom EOR Industry Revenue (Million) Forecast, by Application 2019 & 2032
- Table 12: France EOR Industry Revenue (Million) Forecast, by Application 2019 & 2032
- Table 13: Spain EOR Industry Revenue (Million) Forecast, by Application 2019 & 2032
- Table 14: Italy EOR Industry Revenue (Million) Forecast, by Application 2019 & 2032
- Table 15: Spain EOR Industry Revenue (Million) Forecast, by Application 2019 & 2032
- Table 16: Belgium EOR Industry Revenue (Million) Forecast, by Application 2019 & 2032
- Table 17: Netherland EOR Industry Revenue (Million) Forecast, by Application 2019 & 2032
- Table 18: Nordics EOR Industry Revenue (Million) Forecast, by Application 2019 & 2032
- Table 19: Rest of Europe EOR Industry Revenue (Million) Forecast, by Application 2019 & 2032
- Table 20: Global EOR Industry Revenue Million Forecast, by Country 2019 & 2032
- Table 21: China EOR Industry Revenue (Million) Forecast, by Application 2019 & 2032
- Table 22: Japan EOR Industry Revenue (Million) Forecast, by Application 2019 & 2032
- Table 23: India EOR Industry Revenue (Million) Forecast, by Application 2019 & 2032
- Table 24: South Korea EOR Industry Revenue (Million) Forecast, by Application 2019 & 2032
- Table 25: Southeast Asia EOR Industry Revenue (Million) Forecast, by Application 2019 & 2032
- Table 26: Australia EOR Industry Revenue (Million) Forecast, by Application 2019 & 2032
- Table 27: Indonesia EOR Industry Revenue (Million) Forecast, by Application 2019 & 2032
- Table 28: Phillipes EOR Industry Revenue (Million) Forecast, by Application 2019 & 2032
- Table 29: Singapore EOR Industry Revenue (Million) Forecast, by Application 2019 & 2032
- Table 30: Thailandc EOR Industry Revenue (Million) Forecast, by Application 2019 & 2032
- Table 31: Rest of Asia Pacific EOR Industry Revenue (Million) Forecast, by Application 2019 & 2032
- Table 32: Global EOR Industry Revenue Million Forecast, by Country 2019 & 2032
- Table 33: Brazil EOR Industry Revenue (Million) Forecast, by Application 2019 & 2032
- Table 34: Argentina EOR Industry Revenue (Million) Forecast, by Application 2019 & 2032
- Table 35: Peru EOR Industry Revenue (Million) Forecast, by Application 2019 & 2032
- Table 36: Chile EOR Industry Revenue (Million) Forecast, by Application 2019 & 2032
- Table 37: Colombia EOR Industry Revenue (Million) Forecast, by Application 2019 & 2032
- Table 38: Ecuador EOR Industry Revenue (Million) Forecast, by Application 2019 & 2032
- Table 39: Venezuela EOR Industry Revenue (Million) Forecast, by Application 2019 & 2032
- Table 40: Rest of South America EOR Industry Revenue (Million) Forecast, by Application 2019 & 2032
- Table 41: Global EOR Industry Revenue Million Forecast, by Country 2019 & 2032
- Table 42: United States EOR Industry Revenue (Million) Forecast, by Application 2019 & 2032
- Table 43: Canada EOR Industry Revenue (Million) Forecast, by Application 2019 & 2032
- Table 44: Mexico EOR Industry Revenue (Million) Forecast, by Application 2019 & 2032
- Table 45: Global EOR Industry Revenue Million Forecast, by Country 2019 & 2032
- Table 46: United Arab Emirates EOR Industry Revenue (Million) Forecast, by Application 2019 & 2032
- Table 47: Saudi Arabia EOR Industry Revenue (Million) Forecast, by Application 2019 & 2032
- Table 48: South Africa EOR Industry Revenue (Million) Forecast, by Application 2019 & 2032
- Table 49: Rest of Middle East and Africa EOR Industry Revenue (Million) Forecast, by Application 2019 & 2032
- Table 50: Global EOR Industry Revenue Million Forecast, by Technology 2019 & 2032
- Table 51: Global EOR Industry Revenue Million Forecast, by Location of Deployment 2019 & 2032
- Table 52: Global EOR Industry Revenue Million Forecast, by Country 2019 & 2032
- Table 53: Global EOR Industry Revenue Million Forecast, by Technology 2019 & 2032
- Table 54: Global EOR Industry Revenue Million Forecast, by Location of Deployment 2019 & 2032
- Table 55: Global EOR Industry Revenue Million Forecast, by Country 2019 & 2032
- Table 56: Global EOR Industry Revenue Million Forecast, by Technology 2019 & 2032
- Table 57: Global EOR Industry Revenue Million Forecast, by Location of Deployment 2019 & 2032
- Table 58: Global EOR Industry Revenue Million Forecast, by Country 2019 & 2032
- Table 59: Global EOR Industry Revenue Million Forecast, by Technology 2019 & 2032
- Table 60: Global EOR Industry Revenue Million Forecast, by Location of Deployment 2019 & 2032
- Table 61: Global EOR Industry Revenue Million Forecast, by Country 2019 & 2032
- Table 62: Global EOR Industry Revenue Million Forecast, by Technology 2019 & 2032
- Table 63: Global EOR Industry Revenue Million Forecast, by Location of Deployment 2019 & 2032
- Table 64: Global EOR Industry Revenue Million Forecast, by Country 2019 & 2032
Frequently Asked Questions
1. What is the projected Compound Annual Growth Rate (CAGR) of the EOR Industry?
The projected CAGR is approximately > 2.00%.
2. Which companies are prominent players in the EOR Industry?
Key companies in the market include Shell PLC, Exxon Mobil Corp, Praxair Technology Inc, Chevron Corporation, Baker Hughes Company, TotalEnergies SE, Halliburton Company, Weatherford International PLC*List Not Exhaustive, BP PLC, Schlumberger Limited.
3. What are the main segments of the EOR Industry?
The market segments include Technology, Location of Deployment.
4. Can you provide details about the market size?
The market size is estimated to be USD XX Million as of 2022.
5. What are some drivers contributing to market growth?
4.; Rapid Recovery in the Oil and Gas and Mining Industries4.; Surge in the Construction Industry.
6. What are the notable trends driving market growth?
Gas Injection Technique to Dominate the Market.
7. Are there any restraints impacting market growth?
4.; High Maintenance and Operation Costs of Submersible Pump Restrain the Market.
8. Can you provide examples of recent developments in the market?
In July 2021, Sinopec launched China's largest carbon capture, storage, and utilization (CCUS) project. The scheme involves sending carbon dioxide captured at a petrochemical refinery to the Shengli oilfield, where it will be reinjected as part of the field's enhanced oil recovery program.
9. What pricing options are available for accessing the report?
Pricing options include single-user, multi-user, and enterprise licenses priced at USD 4750, USD 5250, and USD 8750 respectively.
10. Is the market size provided in terms of value or volume?
The market size is provided in terms of value, measured in Million.
11. Are there any specific market keywords associated with the report?
Yes, the market keyword associated with the report is "EOR Industry," which aids in identifying and referencing the specific market segment covered.
12. How do I determine which pricing option suits my needs best?
The pricing options vary based on user requirements and access needs. Individual users may opt for single-user licenses, while businesses requiring broader access may choose multi-user or enterprise licenses for cost-effective access to the report.
13. Are there any additional resources or data provided in the EOR Industry report?
While the report offers comprehensive insights, it's advisable to review the specific contents or supplementary materials provided to ascertain if additional resources or data are available.
14. How can I stay updated on further developments or reports in the EOR Industry?
To stay informed about further developments, trends, and reports in the EOR Industry, consider subscribing to industry newsletters, following relevant companies and organizations, or regularly checking reputable industry news sources and publications.
Methodology
Step 1 - Identification of Relevant Samples Size from Population Database


Step 2 - Approaches for Defining Global Market Size (Value, Volume* & Price*)

Note*: In applicable scenarios
Step 3 - Data Sources
Primary Research
- Web Analytics
- Survey Reports
- Research Institute
- Latest Research Reports
- Opinion Leaders
Secondary Research
- Annual Reports
- White Paper
- Latest Press Release
- Industry Association
- Paid Database
- Investor Presentations

Step 4 - Data Triangulation
Involves using different sources of information in order to increase the validity of a study
These sources are likely to be stakeholders in a program - participants, other researchers, program staff, other community members, and so on.
Then we put all data in single framework & apply various statistical tools to find out the dynamic on the market.
During the analysis stage, feedback from the stakeholder groups would be compared to determine areas of agreement as well as areas of divergence
