

Key Insights
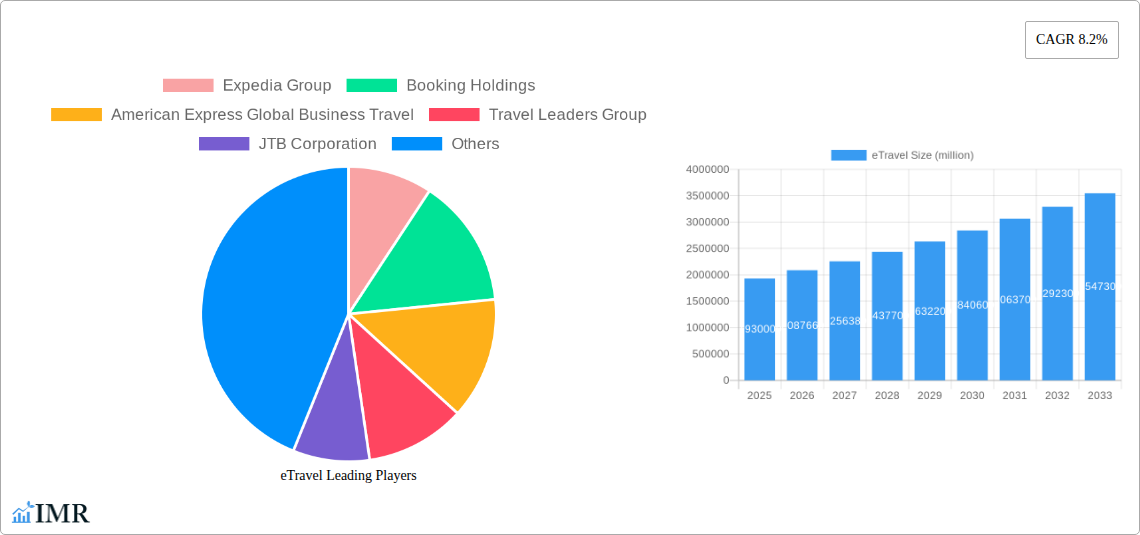
The global eTravel market, valued at $1,930,000 million in 2025, is projected to experience robust growth, driven by increasing internet and smartphone penetration, the rising preference for online booking convenience, and the expanding adoption of mobile travel applications. The 8.2% Compound Annual Growth Rate (CAGR) signifies a consistently expanding market, particularly fueled by the post-pandemic surge in travel demand and the continuous innovation within the sector. Key players like Expedia Group, Booking Holdings, and Trip.com Group Ltd. are leveraging technological advancements such as AI-powered personalization and dynamic pricing strategies to enhance customer experience and capture market share. Furthermore, the market's growth is being propelled by the increasing popularity of travel aggregators, offering a wide range of choices and competitive pricing, alongside the expansion of niche travel segments such as sustainable and adventure tourism.
However, the eTravel market also faces challenges. Economic fluctuations, geopolitical instability, and potential cybersecurity threats can impact consumer spending and confidence. Competition within the industry remains fierce, requiring continuous investment in technology and marketing to maintain a competitive edge. Furthermore, regulatory changes pertaining to data privacy and consumer protection will continue to shape the market landscape. Despite these restraints, the long-term outlook for the eTravel market remains positive, projecting substantial growth over the forecast period (2025-2033). The market will likely see further consolidation among major players and a continued focus on providing personalized and seamless travel experiences to cater to the evolving needs of the modern traveler.
eTravel Market Report: 2019-2033 - A Comprehensive Analysis
This comprehensive report provides an in-depth analysis of the eTravel market, covering the period 2019-2033, with a focus on the estimated year 2025. It examines market dynamics, growth trends, dominant players, and future opportunities within the parent market of travel and tourism and the child market of online travel agencies (OTAs). The report leverages proprietary data and industry expertise to deliver actionable insights for industry professionals, investors, and strategic decision-makers. The global eTravel market is projected to reach xx million by 2033.
eTravel Market Dynamics & Structure
This section analyzes the eTravel market's competitive landscape, technological advancements, regulatory influences, and market trends. The analysis encompasses market concentration, highlighting the dominant players and their respective market shares. It also examines the impact of mergers and acquisitions (M&A) activity on the market structure.
- Market Concentration: Expedia Group and Booking Holdings hold a significant market share, estimated at xx% and xx% respectively in 2025, creating a duopoly. Other players such as Trip.com Group Ltd and Etraveli Group hold a smaller but considerable share.
- Technological Innovation: The market is driven by advancements in AI-powered recommendation engines, personalized travel experiences, and mobile-first strategies. However, integration challenges and data security concerns pose barriers to innovation.
- Regulatory Frameworks: Data privacy regulations (GDPR, CCPA) and consumer protection laws significantly influence market operations and necessitate compliance measures.
- Competitive Product Substitutes: The rise of niche travel platforms and direct bookings from airlines and hotels presents competitive pressure to traditional OTAs.
- End-User Demographics: Millennials and Gen Z are driving the growth of eTravel, favoring mobile bookings and curated travel experiences.
- M&A Trends: The past five years have seen xx M&A deals in the eTravel sector, primarily focused on consolidating market share and expanding into new geographic regions. The average deal size was approximately xx million.
eTravel Growth Trends & Insights
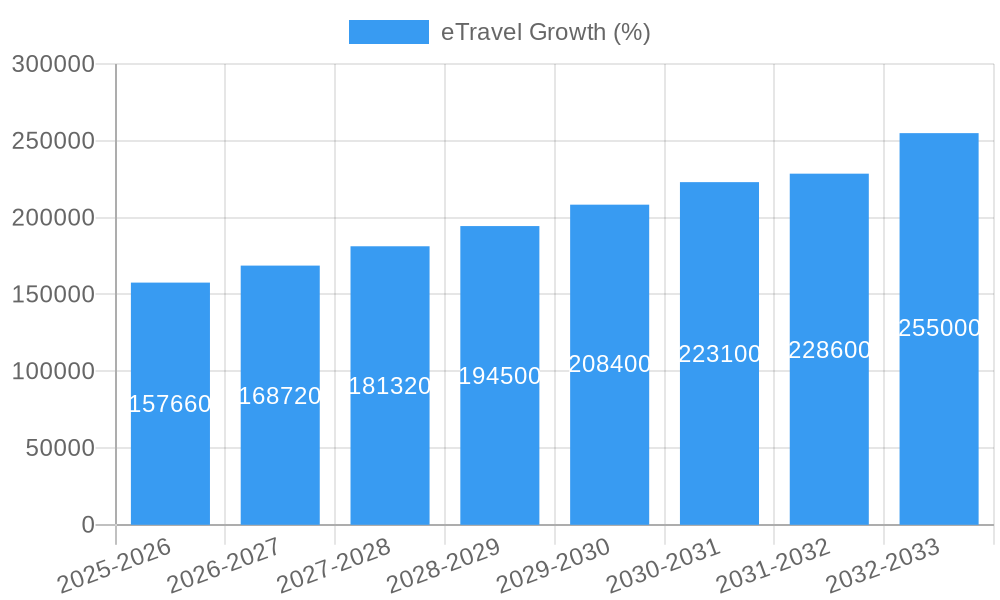
This section provides a detailed analysis of the eTravel market's growth trajectory, utilizing proprietary data and industry benchmarks. We analyze market size evolution, adoption rates, technological disruptions, and shifting consumer behavior. The report employs statistical models to predict future growth and identifies key factors influencing market expansion. The Compound Annual Growth Rate (CAGR) for the forecast period (2025-2033) is estimated at xx%.
Dominant Regions, Countries, or Segments in eTravel
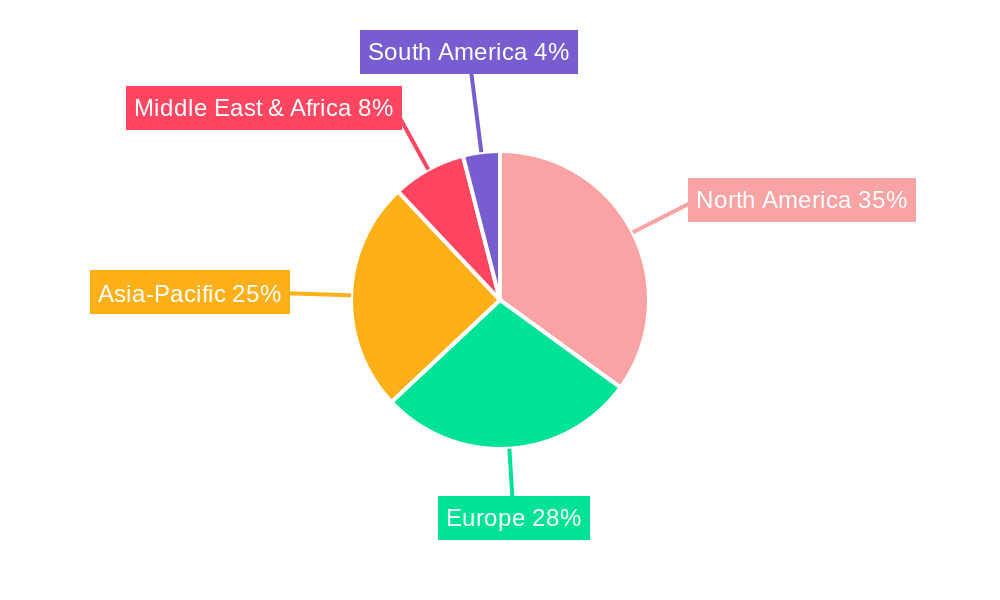
This section identifies leading regions and segments driving market growth, focusing on factors such as economic strength, infrastructure development, and regulatory frameworks. Detailed analysis explains the market share and growth potential of these regions and segments.
- North America: Dominates the market due to high internet penetration, strong disposable income, and a large outbound travel market.
- Asia-Pacific: Shows rapid growth driven by rising middle-class incomes and increasing internet and smartphone adoption in countries like China and India.
- Europe: A mature market with strong online travel adoption but facing challenges from economic fluctuations and Brexit-related uncertainties.
- Segments: The business travel segment is expected to experience significant recovery post-pandemic, while leisure travel continues to be a dominant force.
eTravel Product Landscape
The eTravel market showcases continuous product innovation, focusing on enhanced user experiences, personalized recommendations, and seamless integration of services. Advancements include AI-powered chatbots for customer support, dynamic pricing models, and virtual reality (VR) tools for immersive travel planning. This creates a competitive landscape where unique selling propositions (USPs) and technological edge become critical success factors.
Key Drivers, Barriers & Challenges in eTravel
Key Drivers:
- Increasing smartphone penetration and internet access.
- Growing preference for online booking convenience and price comparison.
- Rise of mobile-first travel applications and personalized travel experiences.
Challenges and Restraints:
- Cybersecurity threats and data breaches impacting consumer trust.
- Fluctuations in global economic conditions impacting travel spending.
- Stringent regulations and compliance requirements in data privacy. Non-compliance can result in fines reaching xx million per incident.
Emerging Opportunities in eTravel
The eTravel market presents significant opportunities in untapped markets, particularly in developing economies with rising middle classes and increasing internet penetration. The integration of blockchain technology for secure transactions and the development of sustainable travel options are emerging trends that present unique business opportunities. Personalization and AI-driven travel planning represent significant growth areas.
Growth Accelerators in the eTravel Industry
Long-term growth in the eTravel industry is fueled by technological breakthroughs in AI and machine learning, enabling improved personalization and dynamic pricing. Strategic partnerships between OTAs and airlines or hotels further expand market reach and offer bundled services. Expansion into emerging markets and developing innovative products that cater to niche travel preferences are also growth catalysts.
Key Players Shaping the eTravel Market
- Expedia Group
- Booking Holdings
- American Express Global Business Travel
- Travel Leaders Group
- JTB Corporation
- Frosch
- AndBeyond
- Intrepid Travel
- Travelopia
- Etraveli Group
- Qunar
- Trip.com Group Ltd
Notable Milestones in eTravel Sector
- 2020 (March): The COVID-19 pandemic triggered a significant decline in eTravel bookings.
- 2021 (Q3): A gradual recovery in the eTravel sector was observed as vaccination rates increased.
- 2022 (Q4): Increased investment in technology solutions to enhance customer experience and personalize services.
- 2023 (Ongoing): Focus on sustainable and responsible travel options gains momentum.
In-Depth eTravel Market Outlook
The eTravel market is poised for continued growth, driven by technological advancements, changing consumer preferences, and the expansion into emerging markets. Strategic partnerships and investments in innovative technologies are key to capitalizing on future opportunities. The market is expected to reach xx million by 2033, showcasing significant potential for players who effectively adapt to the evolving market dynamics.
eTravel Segmentation
-
1. Application
- 1.1. Domestic
- 1.2. International
-
2. Types
- 2.1. Plane Tickets
- 2.2. Hotel Bookings
- 2.3. Train Tickets
- 2.4. Tours
- 2.5. Other
eTravel Segmentation By Geography
-
1. North America
- 1.1. United States
- 1.2. Canada
- 1.3. Mexico
-
2. South America
- 2.1. Brazil
- 2.2. Argentina
- 2.3. Rest of South America
-
3. Europe
- 3.1. United Kingdom
- 3.2. Germany
- 3.3. France
- 3.4. Italy
- 3.5. Spain
- 3.6. Russia
- 3.7. Benelux
- 3.8. Nordics
- 3.9. Rest of Europe
-
4. Middle East & Africa
- 4.1. Turkey
- 4.2. Israel
- 4.3. GCC
- 4.4. North Africa
- 4.5. South Africa
- 4.6. Rest of Middle East & Africa
-
5. Asia Pacific
- 5.1. China
- 5.2. India
- 5.3. Japan
- 5.4. South Korea
- 5.5. ASEAN
- 5.6. Oceania
- 5.7. Rest of Asia Pacific
eTravel REPORT HIGHLIGHTS
| Aspects | Details |
|---|---|
| Study Period | 2019-2033 |
| Base Year | 2024 |
| Estimated Year | 2025 |
| Forecast Period | 2025-2033 |
| Historical Period | 2019-2024 |
| Growth Rate | CAGR of 8.2% from 2019-2033 |
| Segmentation |
|
Table of Contents
- 1. Introduction
- 1.1. Research Scope
- 1.2. Market Segmentation
- 1.3. Research Methodology
- 1.4. Definitions and Assumptions
- 2. Executive Summary
- 2.1. Introduction
- 3. Market Dynamics
- 3.1. Introduction
- 3.2. Market Drivers
- 3.3. Market Restrains
- 3.4. Market Trends
- 4. Market Factor Analysis
- 4.1. Porters Five Forces
- 4.2. Supply/Value Chain
- 4.3. PESTEL analysis
- 4.4. Market Entropy
- 4.5. Patent/Trademark Analysis
- 5. Global eTravel Analysis, Insights and Forecast, 2019-2031
- 5.1. Market Analysis, Insights and Forecast - by Application
- 5.1.1. Domestic
- 5.1.2. International
- 5.2. Market Analysis, Insights and Forecast - by Types
- 5.2.1. Plane Tickets
- 5.2.2. Hotel Bookings
- 5.2.3. Train Tickets
- 5.2.4. Tours
- 5.2.5. Other
- 5.3. Market Analysis, Insights and Forecast - by Region
- 5.3.1. North America
- 5.3.2. South America
- 5.3.3. Europe
- 5.3.4. Middle East & Africa
- 5.3.5. Asia Pacific
- 5.1. Market Analysis, Insights and Forecast - by Application
- 6. North America eTravel Analysis, Insights and Forecast, 2019-2031
- 6.1. Market Analysis, Insights and Forecast - by Application
- 6.1.1. Domestic
- 6.1.2. International
- 6.2. Market Analysis, Insights and Forecast - by Types
- 6.2.1. Plane Tickets
- 6.2.2. Hotel Bookings
- 6.2.3. Train Tickets
- 6.2.4. Tours
- 6.2.5. Other
- 6.1. Market Analysis, Insights and Forecast - by Application
- 7. South America eTravel Analysis, Insights and Forecast, 2019-2031
- 7.1. Market Analysis, Insights and Forecast - by Application
- 7.1.1. Domestic
- 7.1.2. International
- 7.2. Market Analysis, Insights and Forecast - by Types
- 7.2.1. Plane Tickets
- 7.2.2. Hotel Bookings
- 7.2.3. Train Tickets
- 7.2.4. Tours
- 7.2.5. Other
- 7.1. Market Analysis, Insights and Forecast - by Application
- 8. Europe eTravel Analysis, Insights and Forecast, 2019-2031
- 8.1. Market Analysis, Insights and Forecast - by Application
- 8.1.1. Domestic
- 8.1.2. International
- 8.2. Market Analysis, Insights and Forecast - by Types
- 8.2.1. Plane Tickets
- 8.2.2. Hotel Bookings
- 8.2.3. Train Tickets
- 8.2.4. Tours
- 8.2.5. Other
- 8.1. Market Analysis, Insights and Forecast - by Application
- 9. Middle East & Africa eTravel Analysis, Insights and Forecast, 2019-2031
- 9.1. Market Analysis, Insights and Forecast - by Application
- 9.1.1. Domestic
- 9.1.2. International
- 9.2. Market Analysis, Insights and Forecast - by Types
- 9.2.1. Plane Tickets
- 9.2.2. Hotel Bookings
- 9.2.3. Train Tickets
- 9.2.4. Tours
- 9.2.5. Other
- 9.1. Market Analysis, Insights and Forecast - by Application
- 10. Asia Pacific eTravel Analysis, Insights and Forecast, 2019-2031
- 10.1. Market Analysis, Insights and Forecast - by Application
- 10.1.1. Domestic
- 10.1.2. International
- 10.2. Market Analysis, Insights and Forecast - by Types
- 10.2.1. Plane Tickets
- 10.2.2. Hotel Bookings
- 10.2.3. Train Tickets
- 10.2.4. Tours
- 10.2.5. Other
- 10.1. Market Analysis, Insights and Forecast - by Application
- 11. Competitive Analysis
- 11.1. Global Market Share Analysis 2024
- 11.2. Company Profiles
- 11.2.1 Expedia Group
- 11.2.1.1. Overview
- 11.2.1.2. Products
- 11.2.1.3. SWOT Analysis
- 11.2.1.4. Recent Developments
- 11.2.1.5. Financials (Based on Availability)
- 11.2.2 Booking Holdings
- 11.2.2.1. Overview
- 11.2.2.2. Products
- 11.2.2.3. SWOT Analysis
- 11.2.2.4. Recent Developments
- 11.2.2.5. Financials (Based on Availability)
- 11.2.3 American Express Global Business Travel
- 11.2.3.1. Overview
- 11.2.3.2. Products
- 11.2.3.3. SWOT Analysis
- 11.2.3.4. Recent Developments
- 11.2.3.5. Financials (Based on Availability)
- 11.2.4 Travel Leaders Group
- 11.2.4.1. Overview
- 11.2.4.2. Products
- 11.2.4.3. SWOT Analysis
- 11.2.4.4. Recent Developments
- 11.2.4.5. Financials (Based on Availability)
- 11.2.5 JTB Corporation
- 11.2.5.1. Overview
- 11.2.5.2. Products
- 11.2.5.3. SWOT Analysis
- 11.2.5.4. Recent Developments
- 11.2.5.5. Financials (Based on Availability)
- 11.2.6 Frosch
- 11.2.6.1. Overview
- 11.2.6.2. Products
- 11.2.6.3. SWOT Analysis
- 11.2.6.4. Recent Developments
- 11.2.6.5. Financials (Based on Availability)
- 11.2.7 AndBeyond
- 11.2.7.1. Overview
- 11.2.7.2. Products
- 11.2.7.3. SWOT Analysis
- 11.2.7.4. Recent Developments
- 11.2.7.5. Financials (Based on Availability)
- 11.2.8 Intrepid travel
- 11.2.8.1. Overview
- 11.2.8.2. Products
- 11.2.8.3. SWOT Analysis
- 11.2.8.4. Recent Developments
- 11.2.8.5. Financials (Based on Availability)
- 11.2.9 Travelopia
- 11.2.9.1. Overview
- 11.2.9.2. Products
- 11.2.9.3. SWOT Analysis
- 11.2.9.4. Recent Developments
- 11.2.9.5. Financials (Based on Availability)
- 11.2.10 Etraveli Group
- 11.2.10.1. Overview
- 11.2.10.2. Products
- 11.2.10.3. SWOT Analysis
- 11.2.10.4. Recent Developments
- 11.2.10.5. Financials (Based on Availability)
- 11.2.11 Qunar
- 11.2.11.1. Overview
- 11.2.11.2. Products
- 11.2.11.3. SWOT Analysis
- 11.2.11.4. Recent Developments
- 11.2.11.5. Financials (Based on Availability)
- 11.2.12 Trip.com Group Ltd
- 11.2.12.1. Overview
- 11.2.12.2. Products
- 11.2.12.3. SWOT Analysis
- 11.2.12.4. Recent Developments
- 11.2.12.5. Financials (Based on Availability)
- 11.2.1 Expedia Group
List of Figures
- Figure 1: Global eTravel Revenue Breakdown (million, %) by Region 2024 & 2032
- Figure 2: North America eTravel Revenue (million), by Application 2024 & 2032
- Figure 3: North America eTravel Revenue Share (%), by Application 2024 & 2032
- Figure 4: North America eTravel Revenue (million), by Types 2024 & 2032
- Figure 5: North America eTravel Revenue Share (%), by Types 2024 & 2032
- Figure 6: North America eTravel Revenue (million), by Country 2024 & 2032
- Figure 7: North America eTravel Revenue Share (%), by Country 2024 & 2032
- Figure 8: South America eTravel Revenue (million), by Application 2024 & 2032
- Figure 9: South America eTravel Revenue Share (%), by Application 2024 & 2032
- Figure 10: South America eTravel Revenue (million), by Types 2024 & 2032
- Figure 11: South America eTravel Revenue Share (%), by Types 2024 & 2032
- Figure 12: South America eTravel Revenue (million), by Country 2024 & 2032
- Figure 13: South America eTravel Revenue Share (%), by Country 2024 & 2032
- Figure 14: Europe eTravel Revenue (million), by Application 2024 & 2032
- Figure 15: Europe eTravel Revenue Share (%), by Application 2024 & 2032
- Figure 16: Europe eTravel Revenue (million), by Types 2024 & 2032
- Figure 17: Europe eTravel Revenue Share (%), by Types 2024 & 2032
- Figure 18: Europe eTravel Revenue (million), by Country 2024 & 2032
- Figure 19: Europe eTravel Revenue Share (%), by Country 2024 & 2032
- Figure 20: Middle East & Africa eTravel Revenue (million), by Application 2024 & 2032
- Figure 21: Middle East & Africa eTravel Revenue Share (%), by Application 2024 & 2032
- Figure 22: Middle East & Africa eTravel Revenue (million), by Types 2024 & 2032
- Figure 23: Middle East & Africa eTravel Revenue Share (%), by Types 2024 & 2032
- Figure 24: Middle East & Africa eTravel Revenue (million), by Country 2024 & 2032
- Figure 25: Middle East & Africa eTravel Revenue Share (%), by Country 2024 & 2032
- Figure 26: Asia Pacific eTravel Revenue (million), by Application 2024 & 2032
- Figure 27: Asia Pacific eTravel Revenue Share (%), by Application 2024 & 2032
- Figure 28: Asia Pacific eTravel Revenue (million), by Types 2024 & 2032
- Figure 29: Asia Pacific eTravel Revenue Share (%), by Types 2024 & 2032
- Figure 30: Asia Pacific eTravel Revenue (million), by Country 2024 & 2032
- Figure 31: Asia Pacific eTravel Revenue Share (%), by Country 2024 & 2032
List of Tables
- Table 1: Global eTravel Revenue million Forecast, by Region 2019 & 2032
- Table 2: Global eTravel Revenue million Forecast, by Application 2019 & 2032
- Table 3: Global eTravel Revenue million Forecast, by Types 2019 & 2032
- Table 4: Global eTravel Revenue million Forecast, by Region 2019 & 2032
- Table 5: Global eTravel Revenue million Forecast, by Application 2019 & 2032
- Table 6: Global eTravel Revenue million Forecast, by Types 2019 & 2032
- Table 7: Global eTravel Revenue million Forecast, by Country 2019 & 2032
- Table 8: United States eTravel Revenue (million) Forecast, by Application 2019 & 2032
- Table 9: Canada eTravel Revenue (million) Forecast, by Application 2019 & 2032
- Table 10: Mexico eTravel Revenue (million) Forecast, by Application 2019 & 2032
- Table 11: Global eTravel Revenue million Forecast, by Application 2019 & 2032
- Table 12: Global eTravel Revenue million Forecast, by Types 2019 & 2032
- Table 13: Global eTravel Revenue million Forecast, by Country 2019 & 2032
- Table 14: Brazil eTravel Revenue (million) Forecast, by Application 2019 & 2032
- Table 15: Argentina eTravel Revenue (million) Forecast, by Application 2019 & 2032
- Table 16: Rest of South America eTravel Revenue (million) Forecast, by Application 2019 & 2032
- Table 17: Global eTravel Revenue million Forecast, by Application 2019 & 2032
- Table 18: Global eTravel Revenue million Forecast, by Types 2019 & 2032
- Table 19: Global eTravel Revenue million Forecast, by Country 2019 & 2032
- Table 20: United Kingdom eTravel Revenue (million) Forecast, by Application 2019 & 2032
- Table 21: Germany eTravel Revenue (million) Forecast, by Application 2019 & 2032
- Table 22: France eTravel Revenue (million) Forecast, by Application 2019 & 2032
- Table 23: Italy eTravel Revenue (million) Forecast, by Application 2019 & 2032
- Table 24: Spain eTravel Revenue (million) Forecast, by Application 2019 & 2032
- Table 25: Russia eTravel Revenue (million) Forecast, by Application 2019 & 2032
- Table 26: Benelux eTravel Revenue (million) Forecast, by Application 2019 & 2032
- Table 27: Nordics eTravel Revenue (million) Forecast, by Application 2019 & 2032
- Table 28: Rest of Europe eTravel Revenue (million) Forecast, by Application 2019 & 2032
- Table 29: Global eTravel Revenue million Forecast, by Application 2019 & 2032
- Table 30: Global eTravel Revenue million Forecast, by Types 2019 & 2032
- Table 31: Global eTravel Revenue million Forecast, by Country 2019 & 2032
- Table 32: Turkey eTravel Revenue (million) Forecast, by Application 2019 & 2032
- Table 33: Israel eTravel Revenue (million) Forecast, by Application 2019 & 2032
- Table 34: GCC eTravel Revenue (million) Forecast, by Application 2019 & 2032
- Table 35: North Africa eTravel Revenue (million) Forecast, by Application 2019 & 2032
- Table 36: South Africa eTravel Revenue (million) Forecast, by Application 2019 & 2032
- Table 37: Rest of Middle East & Africa eTravel Revenue (million) Forecast, by Application 2019 & 2032
- Table 38: Global eTravel Revenue million Forecast, by Application 2019 & 2032
- Table 39: Global eTravel Revenue million Forecast, by Types 2019 & 2032
- Table 40: Global eTravel Revenue million Forecast, by Country 2019 & 2032
- Table 41: China eTravel Revenue (million) Forecast, by Application 2019 & 2032
- Table 42: India eTravel Revenue (million) Forecast, by Application 2019 & 2032
- Table 43: Japan eTravel Revenue (million) Forecast, by Application 2019 & 2032
- Table 44: South Korea eTravel Revenue (million) Forecast, by Application 2019 & 2032
- Table 45: ASEAN eTravel Revenue (million) Forecast, by Application 2019 & 2032
- Table 46: Oceania eTravel Revenue (million) Forecast, by Application 2019 & 2032
- Table 47: Rest of Asia Pacific eTravel Revenue (million) Forecast, by Application 2019 & 2032
Frequently Asked Questions
1. What is the projected Compound Annual Growth Rate (CAGR) of the eTravel?
The projected CAGR is approximately 8.2%.
2. Which companies are prominent players in the eTravel?
Key companies in the market include Expedia Group, Booking Holdings, American Express Global Business Travel, Travel Leaders Group, JTB Corporation, Frosch, AndBeyond, Intrepid travel, Travelopia, Etraveli Group, Qunar, Trip.com Group Ltd.
3. What are the main segments of the eTravel?
The market segments include Application, Types.
4. Can you provide details about the market size?
The market size is estimated to be USD 1930000 million as of 2022.
5. What are some drivers contributing to market growth?
N/A
6. What are the notable trends driving market growth?
N/A
7. Are there any restraints impacting market growth?
N/A
8. Can you provide examples of recent developments in the market?
N/A
9. What pricing options are available for accessing the report?
Pricing options include single-user, multi-user, and enterprise licenses priced at USD 2900.00, USD 4350.00, and USD 5800.00 respectively.
10. Is the market size provided in terms of value or volume?
The market size is provided in terms of value, measured in million.
11. Are there any specific market keywords associated with the report?
Yes, the market keyword associated with the report is "eTravel," which aids in identifying and referencing the specific market segment covered.
12. How do I determine which pricing option suits my needs best?
The pricing options vary based on user requirements and access needs. Individual users may opt for single-user licenses, while businesses requiring broader access may choose multi-user or enterprise licenses for cost-effective access to the report.
13. Are there any additional resources or data provided in the eTravel report?
While the report offers comprehensive insights, it's advisable to review the specific contents or supplementary materials provided to ascertain if additional resources or data are available.
14. How can I stay updated on further developments or reports in the eTravel?
To stay informed about further developments, trends, and reports in the eTravel, consider subscribing to industry newsletters, following relevant companies and organizations, or regularly checking reputable industry news sources and publications.
Methodology
Step 1 - Identification of Relevant Samples Size from Population Database


Step 2 - Approaches for Defining Global Market Size (Value, Volume* & Price*)

Note*: In applicable scenarios
Step 3 - Data Sources
Primary Research
- Web Analytics
- Survey Reports
- Research Institute
- Latest Research Reports
- Opinion Leaders
Secondary Research
- Annual Reports
- White Paper
- Latest Press Release
- Industry Association
- Paid Database
- Investor Presentations

Step 4 - Data Triangulation
Involves using different sources of information in order to increase the validity of a study
These sources are likely to be stakeholders in a program - participants, other researchers, program staff, other community members, and so on.
Then we put all data in single framework & apply various statistical tools to find out the dynamic on the market.
During the analysis stage, feedback from the stakeholder groups would be compared to determine areas of agreement as well as areas of divergence
