

Key Insights
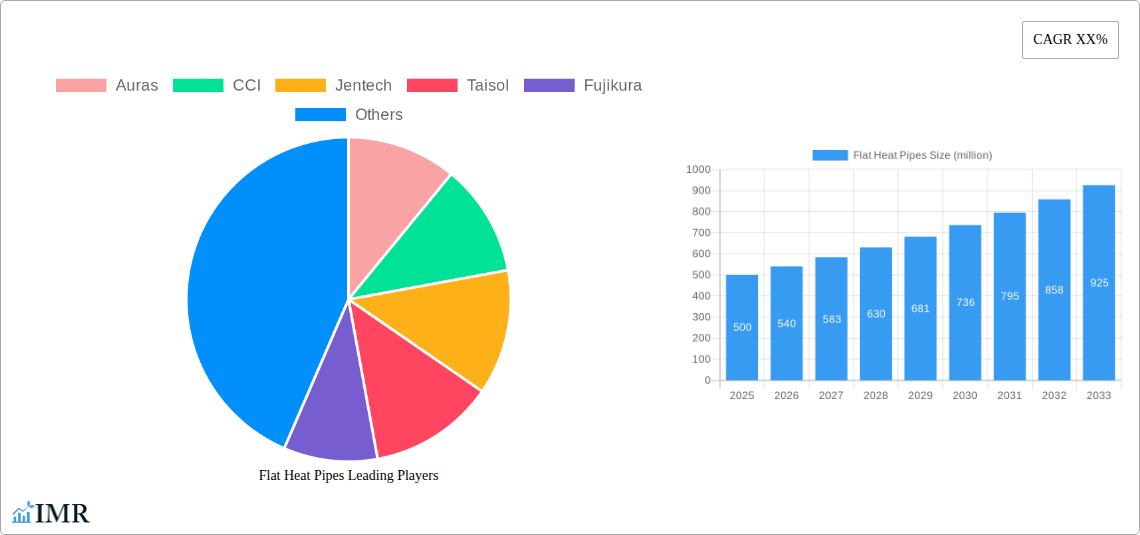
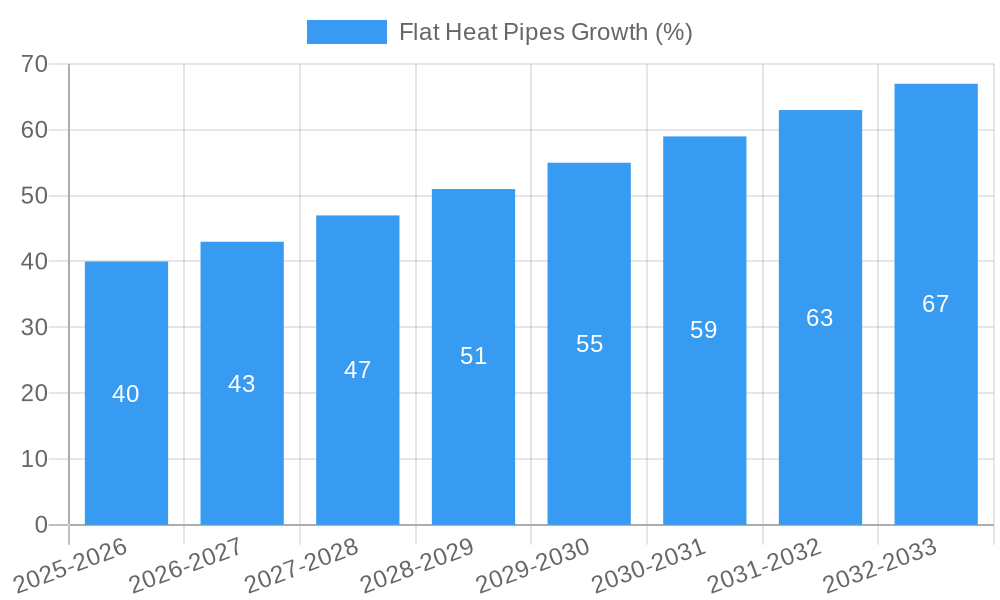
The flat heat pipe market is experiencing robust growth, driven by increasing demand for efficient thermal management solutions across diverse sectors. The market, estimated at $500 million in 2025, is projected to exhibit a Compound Annual Growth Rate (CAGR) of 8% from 2025 to 2033, reaching approximately $950 million by 2033. This growth is fueled by several key factors. The rise of high-performance computing (HPC), data centers, and advanced electronics necessitates sophisticated cooling systems to prevent overheating and ensure optimal performance. Furthermore, the automotive industry's push towards electric vehicles (EVs) and hybrid vehicles, demanding efficient battery thermal management, is significantly boosting demand. Miniaturization trends in electronics, coupled with the increasing power density of devices, necessitate efficient and compact heat dissipation solutions, making flat heat pipes an attractive choice. Leading companies like Auras, CCI, Jentech, and Fujikura are at the forefront of innovation, focusing on enhancing thermal conductivity, durability, and cost-effectiveness of their products to remain competitive in this dynamic market.
Despite the positive outlook, market expansion faces some constraints. The relatively high initial investment cost for implementing flat heat pipe systems can deter some smaller companies. The market is also influenced by fluctuating raw material prices, particularly for metals used in heat pipe manufacturing. Technological advancements focusing on alternative cooling solutions, such as liquid cooling and thermoelectric coolers, could present potential challenges to market growth. However, the ongoing technological progress in flat heat pipe technology itself, including improved designs and the development of innovative materials, is expected to mitigate these challenges and sustain the overall market growth trajectory. Segmentation analysis, while not fully specified, suggests variations in demand based on application type (e.g., electronics cooling, automotive applications), with certain segments exhibiting faster growth rates than others.
Flat Heat Pipes Market Report: A Comprehensive Analysis (2019-2033)
This in-depth report provides a comprehensive analysis of the global Flat Heat Pipes market, encompassing market dynamics, growth trends, regional insights, competitive landscape, and future outlook. The study period covers 2019-2033, with 2025 as the base and estimated year. The forecast period extends from 2025 to 2033, while the historical period analyzed is 2019-2024. The report is invaluable for industry professionals, investors, and researchers seeking to understand this dynamic market. The total market size in 2025 is estimated at $XX million.
Flat Heat Pipes Market Dynamics & Structure
The global Flat Heat Pipes market exhibits a moderately consolidated structure, with key players like Auras, CCI, Jentech, Taisol, and Fujikura holding significant market share (estimated at xx% combined in 2025). Technological innovation, particularly in materials science and manufacturing processes, is a primary growth driver. Stringent environmental regulations promoting energy efficiency are also shaping market dynamics. Competitive substitutes, such as other heat dissipation technologies, pose challenges. The end-user demographics are diverse, spanning electronics, automotive, and industrial applications. M&A activity in the sector has been moderate (xx deals in the past 5 years), with strategic acquisitions focused on expanding product portfolios and geographical reach.
- Market Concentration: Moderately consolidated, with top 5 players holding xx% market share in 2025.
- Technological Innovation: Advancements in materials and manufacturing drive efficiency and performance improvements.
- Regulatory Framework: Stringent environmental regulations favor energy-efficient heat pipe solutions.
- Competitive Substitutes: Competition from other heat dissipation technologies influences market growth.
- End-User Demographics: Diverse applications in electronics, automotive, and industrial sectors.
- M&A Trends: Moderate M&A activity, driven by expansion strategies and technological acquisitions.
Flat Heat Pipes Growth Trends & Insights
The Flat Heat Pipes market experienced significant growth during the historical period (2019-2024), driven by increasing demand from the electronics and automotive industries. The market size grew from $XX million in 2019 to an estimated $XX million in 2024, registering a CAGR of xx%. Adoption rates are expected to rise further, fueled by the growing need for efficient thermal management in high-performance electronics and electric vehicles. Technological advancements, such as the development of enhanced materials and improved manufacturing techniques, contribute to higher performance and reduced costs. Shifting consumer preferences towards smaller, lighter, and more efficient electronic devices are also contributing factors. The market is projected to reach $XX million by 2033, with a forecasted CAGR of xx% during the period 2025-2033. Market penetration is currently at xx% and expected to reach xx% by 2033.
Dominant Regions, Countries, or Segments in Flat Heat Pipes
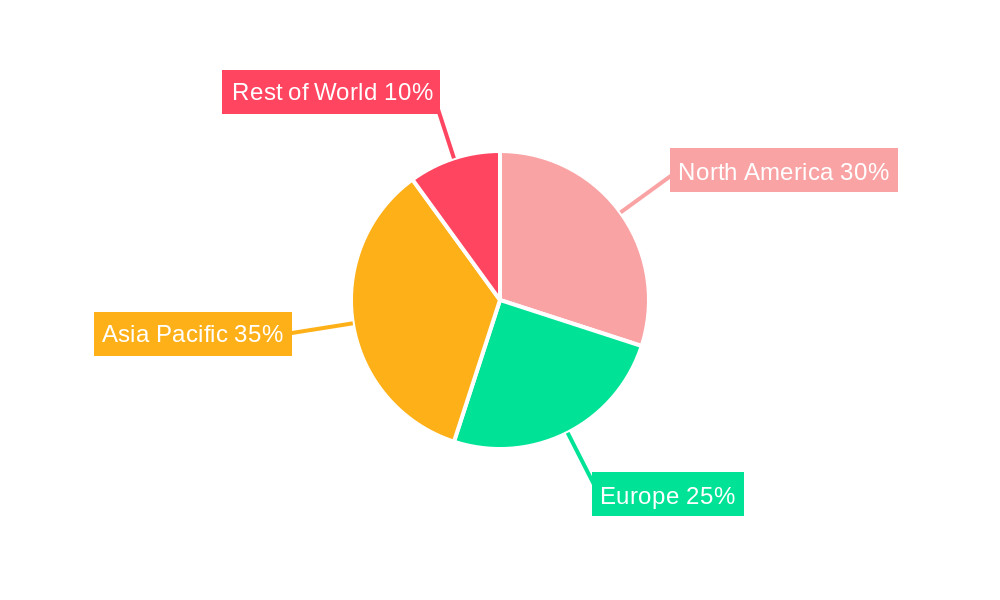
The Asia-Pacific region is currently the dominant market for Flat Heat Pipes, driven by the burgeoning electronics manufacturing sector in countries like China, Japan, and South Korea. High growth potential exists in emerging economies, fueled by increasing industrialization and rising disposable incomes. North America and Europe also contribute significantly to market growth, supported by strong demand from the automotive and industrial sectors.
- Key Drivers in Asia-Pacific: Robust electronics manufacturing, increasing industrialization, and government initiatives promoting technological advancement.
- Growth Potential in Emerging Economies: Rising disposable incomes, expanding industrial base, and supportive government policies.
- North America and Europe: Steady growth driven by demand from automotive and industrial sectors.
- Market Share: Asia-Pacific holds the largest market share (xx% in 2025), followed by North America (xx%) and Europe (xx%).
Flat Heat Pipes Product Landscape
Flat heat pipes are evolving beyond traditional designs, integrating advanced materials like copper and aluminum alloys for enhanced heat transfer capabilities. Applications range from consumer electronics and high-performance computing to automotive and industrial systems. Innovative designs focus on minimizing size and weight while maximizing thermal efficiency. Unique selling propositions include improved heat dissipation, enhanced durability, and cost-effectiveness compared to traditional heat sinks. The ongoing development of micro-channel heat pipes further enhances thermal performance.
Key Drivers, Barriers & Challenges in Flat Heat Pipes
Key Drivers: Increasing demand for efficient thermal management in high-power electronics, rising adoption of electric vehicles, and government regulations promoting energy efficiency are key drivers. The miniaturization trend in electronics also fuels the demand for compact and efficient heat dissipation solutions.
Challenges: High initial investment costs for manufacturing advanced heat pipes, competition from alternative cooling technologies, and supply chain disruptions impacting material availability can hinder market growth. Furthermore, stringent regulatory compliance requirements and potential environmental concerns related to material sourcing and disposal can pose challenges. The global supply chain disruptions in recent years have created significant cost increases and delivery delays (estimated xx% increase in 2022).
Emerging Opportunities in Flat Heat Pipes
Emerging opportunities lie in the development of high-performance heat pipes for next-generation electronics, including 5G infrastructure, data centers, and electric vehicles. Untapped markets exist in developing economies with rapidly expanding industrial bases and growing demand for advanced thermal management solutions. The integration of heat pipes into wearable technology and other miniaturized devices offers promising avenues for growth. Furthermore, the development of sustainable and environmentally friendly materials for heat pipe manufacturing represents a major opportunity.
Growth Accelerators in the Flat Heat Pipes Industry
Technological breakthroughs in material science, leading to the development of highly efficient and durable heat pipes, are a key growth accelerator. Strategic partnerships and collaborations between manufacturers, material suppliers, and end-users foster innovation and market expansion. Continued miniaturization in electronics, coupled with the increasing demand for thermal management in high-power applications, fuels significant growth in the market.
Key Players Shaping the Flat Heat Pipes Market
- Auras
- CCI
- Jentech
- Taisol
- Fujikura
- Forcecon Tech
- Delta Electronics
- Jones Tech
- Celsia
- Tanyuan Technology
- Wakefield Vette
- AVC
- Specialcoolest Technology
- Aavid
Notable Milestones in Flat Heat Pipes Sector
- 2020: Introduction of a new generation of copper-based flat heat pipes with enhanced thermal conductivity by Auras.
- 2021: Strategic partnership between Taisol and a major automotive manufacturer to develop customized heat pipe solutions for electric vehicles.
- 2022: Acquisition of a smaller heat pipe manufacturer by Fujikura to expand its product portfolio and market reach.
- 2023: Launch of a new line of high-performance flat heat pipes for data centers by Delta Electronics.
In-Depth Flat Heat Pipes Market Outlook
The Flat Heat Pipes market is poised for robust growth in the coming years, driven by several factors including the continued miniaturization of electronics, the increasing adoption of electric vehicles, and the growing demand for efficient thermal management solutions across various industries. Strategic investments in research and development, coupled with strategic partnerships and acquisitions, are set to further drive innovation and market expansion. The market's future potential is significant, with opportunities for both established players and new entrants to capture market share. The continued development of sustainable and efficient heat pipe technologies will play a crucial role in shaping the future landscape of the market.
Flat Heat Pipes Segmentation
-
1. Application
- 1.1. Phone
- 1.2. Computer
-
2. Types
- 2.1. Ultra Thin
- 2.2. Standard
Flat Heat Pipes Segmentation By Geography
-
1. North America
- 1.1. United States
- 1.2. Canada
- 1.3. Mexico
-
2. South America
- 2.1. Brazil
- 2.2. Argentina
- 2.3. Rest of South America
-
3. Europe
- 3.1. United Kingdom
- 3.2. Germany
- 3.3. France
- 3.4. Italy
- 3.5. Spain
- 3.6. Russia
- 3.7. Benelux
- 3.8. Nordics
- 3.9. Rest of Europe
-
4. Middle East & Africa
- 4.1. Turkey
- 4.2. Israel
- 4.3. GCC
- 4.4. North Africa
- 4.5. South Africa
- 4.6. Rest of Middle East & Africa
-
5. Asia Pacific
- 5.1. China
- 5.2. India
- 5.3. Japan
- 5.4. South Korea
- 5.5. ASEAN
- 5.6. Oceania
- 5.7. Rest of Asia Pacific
Flat Heat Pipes REPORT HIGHLIGHTS
| Aspects | Details |
|---|---|
| Study Period | 2019-2033 |
| Base Year | 2024 |
| Estimated Year | 2025 |
| Forecast Period | 2025-2033 |
| Historical Period | 2019-2024 |
| Growth Rate | CAGR of XX% from 2019-2033 |
| Segmentation |
|
Table of Contents
- 1. Introduction
- 1.1. Research Scope
- 1.2. Market Segmentation
- 1.3. Research Methodology
- 1.4. Definitions and Assumptions
- 2. Executive Summary
- 2.1. Introduction
- 3. Market Dynamics
- 3.1. Introduction
- 3.2. Market Drivers
- 3.3. Market Restrains
- 3.4. Market Trends
- 4. Market Factor Analysis
- 4.1. Porters Five Forces
- 4.2. Supply/Value Chain
- 4.3. PESTEL analysis
- 4.4. Market Entropy
- 4.5. Patent/Trademark Analysis
- 5. Global Flat Heat Pipes Analysis, Insights and Forecast, 2019-2031
- 5.1. Market Analysis, Insights and Forecast - by Application
- 5.1.1. Phone
- 5.1.2. Computer
- 5.2. Market Analysis, Insights and Forecast - by Types
- 5.2.1. Ultra Thin
- 5.2.2. Standard
- 5.3. Market Analysis, Insights and Forecast - by Region
- 5.3.1. North America
- 5.3.2. South America
- 5.3.3. Europe
- 5.3.4. Middle East & Africa
- 5.3.5. Asia Pacific
- 5.1. Market Analysis, Insights and Forecast - by Application
- 6. North America Flat Heat Pipes Analysis, Insights and Forecast, 2019-2031
- 6.1. Market Analysis, Insights and Forecast - by Application
- 6.1.1. Phone
- 6.1.2. Computer
- 6.2. Market Analysis, Insights and Forecast - by Types
- 6.2.1. Ultra Thin
- 6.2.2. Standard
- 6.1. Market Analysis, Insights and Forecast - by Application
- 7. South America Flat Heat Pipes Analysis, Insights and Forecast, 2019-2031
- 7.1. Market Analysis, Insights and Forecast - by Application
- 7.1.1. Phone
- 7.1.2. Computer
- 7.2. Market Analysis, Insights and Forecast - by Types
- 7.2.1. Ultra Thin
- 7.2.2. Standard
- 7.1. Market Analysis, Insights and Forecast - by Application
- 8. Europe Flat Heat Pipes Analysis, Insights and Forecast, 2019-2031
- 8.1. Market Analysis, Insights and Forecast - by Application
- 8.1.1. Phone
- 8.1.2. Computer
- 8.2. Market Analysis, Insights and Forecast - by Types
- 8.2.1. Ultra Thin
- 8.2.2. Standard
- 8.1. Market Analysis, Insights and Forecast - by Application
- 9. Middle East & Africa Flat Heat Pipes Analysis, Insights and Forecast, 2019-2031
- 9.1. Market Analysis, Insights and Forecast - by Application
- 9.1.1. Phone
- 9.1.2. Computer
- 9.2. Market Analysis, Insights and Forecast - by Types
- 9.2.1. Ultra Thin
- 9.2.2. Standard
- 9.1. Market Analysis, Insights and Forecast - by Application
- 10. Asia Pacific Flat Heat Pipes Analysis, Insights and Forecast, 2019-2031
- 10.1. Market Analysis, Insights and Forecast - by Application
- 10.1.1. Phone
- 10.1.2. Computer
- 10.2. Market Analysis, Insights and Forecast - by Types
- 10.2.1. Ultra Thin
- 10.2.2. Standard
- 10.1. Market Analysis, Insights and Forecast - by Application
- 11. Competitive Analysis
- 11.1. Global Market Share Analysis 2024
- 11.2. Company Profiles
- 11.2.1 Auras
- 11.2.1.1. Overview
- 11.2.1.2. Products
- 11.2.1.3. SWOT Analysis
- 11.2.1.4. Recent Developments
- 11.2.1.5. Financials (Based on Availability)
- 11.2.2 CCI
- 11.2.2.1. Overview
- 11.2.2.2. Products
- 11.2.2.3. SWOT Analysis
- 11.2.2.4. Recent Developments
- 11.2.2.5. Financials (Based on Availability)
- 11.2.3 Jentech
- 11.2.3.1. Overview
- 11.2.3.2. Products
- 11.2.3.3. SWOT Analysis
- 11.2.3.4. Recent Developments
- 11.2.3.5. Financials (Based on Availability)
- 11.2.4 Taisol
- 11.2.4.1. Overview
- 11.2.4.2. Products
- 11.2.4.3. SWOT Analysis
- 11.2.4.4. Recent Developments
- 11.2.4.5. Financials (Based on Availability)
- 11.2.5 Fujikura
- 11.2.5.1. Overview
- 11.2.5.2. Products
- 11.2.5.3. SWOT Analysis
- 11.2.5.4. Recent Developments
- 11.2.5.5. Financials (Based on Availability)
- 11.2.6 Forcecon Tech
- 11.2.6.1. Overview
- 11.2.6.2. Products
- 11.2.6.3. SWOT Analysis
- 11.2.6.4. Recent Developments
- 11.2.6.5. Financials (Based on Availability)
- 11.2.7 Delta Electronics
- 11.2.7.1. Overview
- 11.2.7.2. Products
- 11.2.7.3. SWOT Analysis
- 11.2.7.4. Recent Developments
- 11.2.7.5. Financials (Based on Availability)
- 11.2.8 Jones Tech
- 11.2.8.1. Overview
- 11.2.8.2. Products
- 11.2.8.3. SWOT Analysis
- 11.2.8.4. Recent Developments
- 11.2.8.5. Financials (Based on Availability)
- 11.2.9 Celsia
- 11.2.9.1. Overview
- 11.2.9.2. Products
- 11.2.9.3. SWOT Analysis
- 11.2.9.4. Recent Developments
- 11.2.9.5. Financials (Based on Availability)
- 11.2.10 Tanyuan Technology
- 11.2.10.1. Overview
- 11.2.10.2. Products
- 11.2.10.3. SWOT Analysis
- 11.2.10.4. Recent Developments
- 11.2.10.5. Financials (Based on Availability)
- 11.2.11 Wakefield Vette
- 11.2.11.1. Overview
- 11.2.11.2. Products
- 11.2.11.3. SWOT Analysis
- 11.2.11.4. Recent Developments
- 11.2.11.5. Financials (Based on Availability)
- 11.2.12 AVC
- 11.2.12.1. Overview
- 11.2.12.2. Products
- 11.2.12.3. SWOT Analysis
- 11.2.12.4. Recent Developments
- 11.2.12.5. Financials (Based on Availability)
- 11.2.13 Specialcoolest Technology
- 11.2.13.1. Overview
- 11.2.13.2. Products
- 11.2.13.3. SWOT Analysis
- 11.2.13.4. Recent Developments
- 11.2.13.5. Financials (Based on Availability)
- 11.2.14 Aavid
- 11.2.14.1. Overview
- 11.2.14.2. Products
- 11.2.14.3. SWOT Analysis
- 11.2.14.4. Recent Developments
- 11.2.14.5. Financials (Based on Availability)
- 11.2.1 Auras
List of Figures
- Figure 1: Global Flat Heat Pipes Revenue Breakdown (million, %) by Region 2024 & 2032
- Figure 2: Global Flat Heat Pipes Volume Breakdown (K, %) by Region 2024 & 2032
- Figure 3: North America Flat Heat Pipes Revenue (million), by Application 2024 & 2032
- Figure 4: North America Flat Heat Pipes Volume (K), by Application 2024 & 2032
- Figure 5: North America Flat Heat Pipes Revenue Share (%), by Application 2024 & 2032
- Figure 6: North America Flat Heat Pipes Volume Share (%), by Application 2024 & 2032
- Figure 7: North America Flat Heat Pipes Revenue (million), by Types 2024 & 2032
- Figure 8: North America Flat Heat Pipes Volume (K), by Types 2024 & 2032
- Figure 9: North America Flat Heat Pipes Revenue Share (%), by Types 2024 & 2032
- Figure 10: North America Flat Heat Pipes Volume Share (%), by Types 2024 & 2032
- Figure 11: North America Flat Heat Pipes Revenue (million), by Country 2024 & 2032
- Figure 12: North America Flat Heat Pipes Volume (K), by Country 2024 & 2032
- Figure 13: North America Flat Heat Pipes Revenue Share (%), by Country 2024 & 2032
- Figure 14: North America Flat Heat Pipes Volume Share (%), by Country 2024 & 2032
- Figure 15: South America Flat Heat Pipes Revenue (million), by Application 2024 & 2032
- Figure 16: South America Flat Heat Pipes Volume (K), by Application 2024 & 2032
- Figure 17: South America Flat Heat Pipes Revenue Share (%), by Application 2024 & 2032
- Figure 18: South America Flat Heat Pipes Volume Share (%), by Application 2024 & 2032
- Figure 19: South America Flat Heat Pipes Revenue (million), by Types 2024 & 2032
- Figure 20: South America Flat Heat Pipes Volume (K), by Types 2024 & 2032
- Figure 21: South America Flat Heat Pipes Revenue Share (%), by Types 2024 & 2032
- Figure 22: South America Flat Heat Pipes Volume Share (%), by Types 2024 & 2032
- Figure 23: South America Flat Heat Pipes Revenue (million), by Country 2024 & 2032
- Figure 24: South America Flat Heat Pipes Volume (K), by Country 2024 & 2032
- Figure 25: South America Flat Heat Pipes Revenue Share (%), by Country 2024 & 2032
- Figure 26: South America Flat Heat Pipes Volume Share (%), by Country 2024 & 2032
- Figure 27: Europe Flat Heat Pipes Revenue (million), by Application 2024 & 2032
- Figure 28: Europe Flat Heat Pipes Volume (K), by Application 2024 & 2032
- Figure 29: Europe Flat Heat Pipes Revenue Share (%), by Application 2024 & 2032
- Figure 30: Europe Flat Heat Pipes Volume Share (%), by Application 2024 & 2032
- Figure 31: Europe Flat Heat Pipes Revenue (million), by Types 2024 & 2032
- Figure 32: Europe Flat Heat Pipes Volume (K), by Types 2024 & 2032
- Figure 33: Europe Flat Heat Pipes Revenue Share (%), by Types 2024 & 2032
- Figure 34: Europe Flat Heat Pipes Volume Share (%), by Types 2024 & 2032
- Figure 35: Europe Flat Heat Pipes Revenue (million), by Country 2024 & 2032
- Figure 36: Europe Flat Heat Pipes Volume (K), by Country 2024 & 2032
- Figure 37: Europe Flat Heat Pipes Revenue Share (%), by Country 2024 & 2032
- Figure 38: Europe Flat Heat Pipes Volume Share (%), by Country 2024 & 2032
- Figure 39: Middle East & Africa Flat Heat Pipes Revenue (million), by Application 2024 & 2032
- Figure 40: Middle East & Africa Flat Heat Pipes Volume (K), by Application 2024 & 2032
- Figure 41: Middle East & Africa Flat Heat Pipes Revenue Share (%), by Application 2024 & 2032
- Figure 42: Middle East & Africa Flat Heat Pipes Volume Share (%), by Application 2024 & 2032
- Figure 43: Middle East & Africa Flat Heat Pipes Revenue (million), by Types 2024 & 2032
- Figure 44: Middle East & Africa Flat Heat Pipes Volume (K), by Types 2024 & 2032
- Figure 45: Middle East & Africa Flat Heat Pipes Revenue Share (%), by Types 2024 & 2032
- Figure 46: Middle East & Africa Flat Heat Pipes Volume Share (%), by Types 2024 & 2032
- Figure 47: Middle East & Africa Flat Heat Pipes Revenue (million), by Country 2024 & 2032
- Figure 48: Middle East & Africa Flat Heat Pipes Volume (K), by Country 2024 & 2032
- Figure 49: Middle East & Africa Flat Heat Pipes Revenue Share (%), by Country 2024 & 2032
- Figure 50: Middle East & Africa Flat Heat Pipes Volume Share (%), by Country 2024 & 2032
- Figure 51: Asia Pacific Flat Heat Pipes Revenue (million), by Application 2024 & 2032
- Figure 52: Asia Pacific Flat Heat Pipes Volume (K), by Application 2024 & 2032
- Figure 53: Asia Pacific Flat Heat Pipes Revenue Share (%), by Application 2024 & 2032
- Figure 54: Asia Pacific Flat Heat Pipes Volume Share (%), by Application 2024 & 2032
- Figure 55: Asia Pacific Flat Heat Pipes Revenue (million), by Types 2024 & 2032
- Figure 56: Asia Pacific Flat Heat Pipes Volume (K), by Types 2024 & 2032
- Figure 57: Asia Pacific Flat Heat Pipes Revenue Share (%), by Types 2024 & 2032
- Figure 58: Asia Pacific Flat Heat Pipes Volume Share (%), by Types 2024 & 2032
- Figure 59: Asia Pacific Flat Heat Pipes Revenue (million), by Country 2024 & 2032
- Figure 60: Asia Pacific Flat Heat Pipes Volume (K), by Country 2024 & 2032
- Figure 61: Asia Pacific Flat Heat Pipes Revenue Share (%), by Country 2024 & 2032
- Figure 62: Asia Pacific Flat Heat Pipes Volume Share (%), by Country 2024 & 2032
List of Tables
- Table 1: Global Flat Heat Pipes Revenue million Forecast, by Region 2019 & 2032
- Table 2: Global Flat Heat Pipes Volume K Forecast, by Region 2019 & 2032
- Table 3: Global Flat Heat Pipes Revenue million Forecast, by Application 2019 & 2032
- Table 4: Global Flat Heat Pipes Volume K Forecast, by Application 2019 & 2032
- Table 5: Global Flat Heat Pipes Revenue million Forecast, by Types 2019 & 2032
- Table 6: Global Flat Heat Pipes Volume K Forecast, by Types 2019 & 2032
- Table 7: Global Flat Heat Pipes Revenue million Forecast, by Region 2019 & 2032
- Table 8: Global Flat Heat Pipes Volume K Forecast, by Region 2019 & 2032
- Table 9: Global Flat Heat Pipes Revenue million Forecast, by Application 2019 & 2032
- Table 10: Global Flat Heat Pipes Volume K Forecast, by Application 2019 & 2032
- Table 11: Global Flat Heat Pipes Revenue million Forecast, by Types 2019 & 2032
- Table 12: Global Flat Heat Pipes Volume K Forecast, by Types 2019 & 2032
- Table 13: Global Flat Heat Pipes Revenue million Forecast, by Country 2019 & 2032
- Table 14: Global Flat Heat Pipes Volume K Forecast, by Country 2019 & 2032
- Table 15: United States Flat Heat Pipes Revenue (million) Forecast, by Application 2019 & 2032
- Table 16: United States Flat Heat Pipes Volume (K) Forecast, by Application 2019 & 2032
- Table 17: Canada Flat Heat Pipes Revenue (million) Forecast, by Application 2019 & 2032
- Table 18: Canada Flat Heat Pipes Volume (K) Forecast, by Application 2019 & 2032
- Table 19: Mexico Flat Heat Pipes Revenue (million) Forecast, by Application 2019 & 2032
- Table 20: Mexico Flat Heat Pipes Volume (K) Forecast, by Application 2019 & 2032
- Table 21: Global Flat Heat Pipes Revenue million Forecast, by Application 2019 & 2032
- Table 22: Global Flat Heat Pipes Volume K Forecast, by Application 2019 & 2032
- Table 23: Global Flat Heat Pipes Revenue million Forecast, by Types 2019 & 2032
- Table 24: Global Flat Heat Pipes Volume K Forecast, by Types 2019 & 2032
- Table 25: Global Flat Heat Pipes Revenue million Forecast, by Country 2019 & 2032
- Table 26: Global Flat Heat Pipes Volume K Forecast, by Country 2019 & 2032
- Table 27: Brazil Flat Heat Pipes Revenue (million) Forecast, by Application 2019 & 2032
- Table 28: Brazil Flat Heat Pipes Volume (K) Forecast, by Application 2019 & 2032
- Table 29: Argentina Flat Heat Pipes Revenue (million) Forecast, by Application 2019 & 2032
- Table 30: Argentina Flat Heat Pipes Volume (K) Forecast, by Application 2019 & 2032
- Table 31: Rest of South America Flat Heat Pipes Revenue (million) Forecast, by Application 2019 & 2032
- Table 32: Rest of South America Flat Heat Pipes Volume (K) Forecast, by Application 2019 & 2032
- Table 33: Global Flat Heat Pipes Revenue million Forecast, by Application 2019 & 2032
- Table 34: Global Flat Heat Pipes Volume K Forecast, by Application 2019 & 2032
- Table 35: Global Flat Heat Pipes Revenue million Forecast, by Types 2019 & 2032
- Table 36: Global Flat Heat Pipes Volume K Forecast, by Types 2019 & 2032
- Table 37: Global Flat Heat Pipes Revenue million Forecast, by Country 2019 & 2032
- Table 38: Global Flat Heat Pipes Volume K Forecast, by Country 2019 & 2032
- Table 39: United Kingdom Flat Heat Pipes Revenue (million) Forecast, by Application 2019 & 2032
- Table 40: United Kingdom Flat Heat Pipes Volume (K) Forecast, by Application 2019 & 2032
- Table 41: Germany Flat Heat Pipes Revenue (million) Forecast, by Application 2019 & 2032
- Table 42: Germany Flat Heat Pipes Volume (K) Forecast, by Application 2019 & 2032
- Table 43: France Flat Heat Pipes Revenue (million) Forecast, by Application 2019 & 2032
- Table 44: France Flat Heat Pipes Volume (K) Forecast, by Application 2019 & 2032
- Table 45: Italy Flat Heat Pipes Revenue (million) Forecast, by Application 2019 & 2032
- Table 46: Italy Flat Heat Pipes Volume (K) Forecast, by Application 2019 & 2032
- Table 47: Spain Flat Heat Pipes Revenue (million) Forecast, by Application 2019 & 2032
- Table 48: Spain Flat Heat Pipes Volume (K) Forecast, by Application 2019 & 2032
- Table 49: Russia Flat Heat Pipes Revenue (million) Forecast, by Application 2019 & 2032
- Table 50: Russia Flat Heat Pipes Volume (K) Forecast, by Application 2019 & 2032
- Table 51: Benelux Flat Heat Pipes Revenue (million) Forecast, by Application 2019 & 2032
- Table 52: Benelux Flat Heat Pipes Volume (K) Forecast, by Application 2019 & 2032
- Table 53: Nordics Flat Heat Pipes Revenue (million) Forecast, by Application 2019 & 2032
- Table 54: Nordics Flat Heat Pipes Volume (K) Forecast, by Application 2019 & 2032
- Table 55: Rest of Europe Flat Heat Pipes Revenue (million) Forecast, by Application 2019 & 2032
- Table 56: Rest of Europe Flat Heat Pipes Volume (K) Forecast, by Application 2019 & 2032
- Table 57: Global Flat Heat Pipes Revenue million Forecast, by Application 2019 & 2032
- Table 58: Global Flat Heat Pipes Volume K Forecast, by Application 2019 & 2032
- Table 59: Global Flat Heat Pipes Revenue million Forecast, by Types 2019 & 2032
- Table 60: Global Flat Heat Pipes Volume K Forecast, by Types 2019 & 2032
- Table 61: Global Flat Heat Pipes Revenue million Forecast, by Country 2019 & 2032
- Table 62: Global Flat Heat Pipes Volume K Forecast, by Country 2019 & 2032
- Table 63: Turkey Flat Heat Pipes Revenue (million) Forecast, by Application 2019 & 2032
- Table 64: Turkey Flat Heat Pipes Volume (K) Forecast, by Application 2019 & 2032
- Table 65: Israel Flat Heat Pipes Revenue (million) Forecast, by Application 2019 & 2032
- Table 66: Israel Flat Heat Pipes Volume (K) Forecast, by Application 2019 & 2032
- Table 67: GCC Flat Heat Pipes Revenue (million) Forecast, by Application 2019 & 2032
- Table 68: GCC Flat Heat Pipes Volume (K) Forecast, by Application 2019 & 2032
- Table 69: North Africa Flat Heat Pipes Revenue (million) Forecast, by Application 2019 & 2032
- Table 70: North Africa Flat Heat Pipes Volume (K) Forecast, by Application 2019 & 2032
- Table 71: South Africa Flat Heat Pipes Revenue (million) Forecast, by Application 2019 & 2032
- Table 72: South Africa Flat Heat Pipes Volume (K) Forecast, by Application 2019 & 2032
- Table 73: Rest of Middle East & Africa Flat Heat Pipes Revenue (million) Forecast, by Application 2019 & 2032
- Table 74: Rest of Middle East & Africa Flat Heat Pipes Volume (K) Forecast, by Application 2019 & 2032
- Table 75: Global Flat Heat Pipes Revenue million Forecast, by Application 2019 & 2032
- Table 76: Global Flat Heat Pipes Volume K Forecast, by Application 2019 & 2032
- Table 77: Global Flat Heat Pipes Revenue million Forecast, by Types 2019 & 2032
- Table 78: Global Flat Heat Pipes Volume K Forecast, by Types 2019 & 2032
- Table 79: Global Flat Heat Pipes Revenue million Forecast, by Country 2019 & 2032
- Table 80: Global Flat Heat Pipes Volume K Forecast, by Country 2019 & 2032
- Table 81: China Flat Heat Pipes Revenue (million) Forecast, by Application 2019 & 2032
- Table 82: China Flat Heat Pipes Volume (K) Forecast, by Application 2019 & 2032
- Table 83: India Flat Heat Pipes Revenue (million) Forecast, by Application 2019 & 2032
- Table 84: India Flat Heat Pipes Volume (K) Forecast, by Application 2019 & 2032
- Table 85: Japan Flat Heat Pipes Revenue (million) Forecast, by Application 2019 & 2032
- Table 86: Japan Flat Heat Pipes Volume (K) Forecast, by Application 2019 & 2032
- Table 87: South Korea Flat Heat Pipes Revenue (million) Forecast, by Application 2019 & 2032
- Table 88: South Korea Flat Heat Pipes Volume (K) Forecast, by Application 2019 & 2032
- Table 89: ASEAN Flat Heat Pipes Revenue (million) Forecast, by Application 2019 & 2032
- Table 90: ASEAN Flat Heat Pipes Volume (K) Forecast, by Application 2019 & 2032
- Table 91: Oceania Flat Heat Pipes Revenue (million) Forecast, by Application 2019 & 2032
- Table 92: Oceania Flat Heat Pipes Volume (K) Forecast, by Application 2019 & 2032
- Table 93: Rest of Asia Pacific Flat Heat Pipes Revenue (million) Forecast, by Application 2019 & 2032
- Table 94: Rest of Asia Pacific Flat Heat Pipes Volume (K) Forecast, by Application 2019 & 2032
Frequently Asked Questions
1. What is the projected Compound Annual Growth Rate (CAGR) of the Flat Heat Pipes?
The projected CAGR is approximately XX%.
2. Which companies are prominent players in the Flat Heat Pipes?
Key companies in the market include Auras, CCI, Jentech, Taisol, Fujikura, Forcecon Tech, Delta Electronics, Jones Tech, Celsia, Tanyuan Technology, Wakefield Vette, AVC, Specialcoolest Technology, Aavid.
3. What are the main segments of the Flat Heat Pipes?
The market segments include Application, Types.
4. Can you provide details about the market size?
The market size is estimated to be USD XXX million as of 2022.
5. What are some drivers contributing to market growth?
N/A
6. What are the notable trends driving market growth?
N/A
7. Are there any restraints impacting market growth?
N/A
8. Can you provide examples of recent developments in the market?
N/A
9. What pricing options are available for accessing the report?
Pricing options include single-user, multi-user, and enterprise licenses priced at USD 3350.00, USD 5025.00, and USD 6700.00 respectively.
10. Is the market size provided in terms of value or volume?
The market size is provided in terms of value, measured in million and volume, measured in K.
11. Are there any specific market keywords associated with the report?
Yes, the market keyword associated with the report is "Flat Heat Pipes," which aids in identifying and referencing the specific market segment covered.
12. How do I determine which pricing option suits my needs best?
The pricing options vary based on user requirements and access needs. Individual users may opt for single-user licenses, while businesses requiring broader access may choose multi-user or enterprise licenses for cost-effective access to the report.
13. Are there any additional resources or data provided in the Flat Heat Pipes report?
While the report offers comprehensive insights, it's advisable to review the specific contents or supplementary materials provided to ascertain if additional resources or data are available.
14. How can I stay updated on further developments or reports in the Flat Heat Pipes?
To stay informed about further developments, trends, and reports in the Flat Heat Pipes, consider subscribing to industry newsletters, following relevant companies and organizations, or regularly checking reputable industry news sources and publications.
Methodology
Step 1 - Identification of Relevant Samples Size from Population Database


Step 2 - Approaches for Defining Global Market Size (Value, Volume* & Price*)

Note*: In applicable scenarios
Step 3 - Data Sources
Primary Research
- Web Analytics
- Survey Reports
- Research Institute
- Latest Research Reports
- Opinion Leaders
Secondary Research
- Annual Reports
- White Paper
- Latest Press Release
- Industry Association
- Paid Database
- Investor Presentations

Step 4 - Data Triangulation
Involves using different sources of information in order to increase the validity of a study
These sources are likely to be stakeholders in a program - participants, other researchers, program staff, other community members, and so on.
Then we put all data in single framework & apply various statistical tools to find out the dynamic on the market.
During the analysis stage, feedback from the stakeholder groups would be compared to determine areas of agreement as well as areas of divergence
