

Key Insights
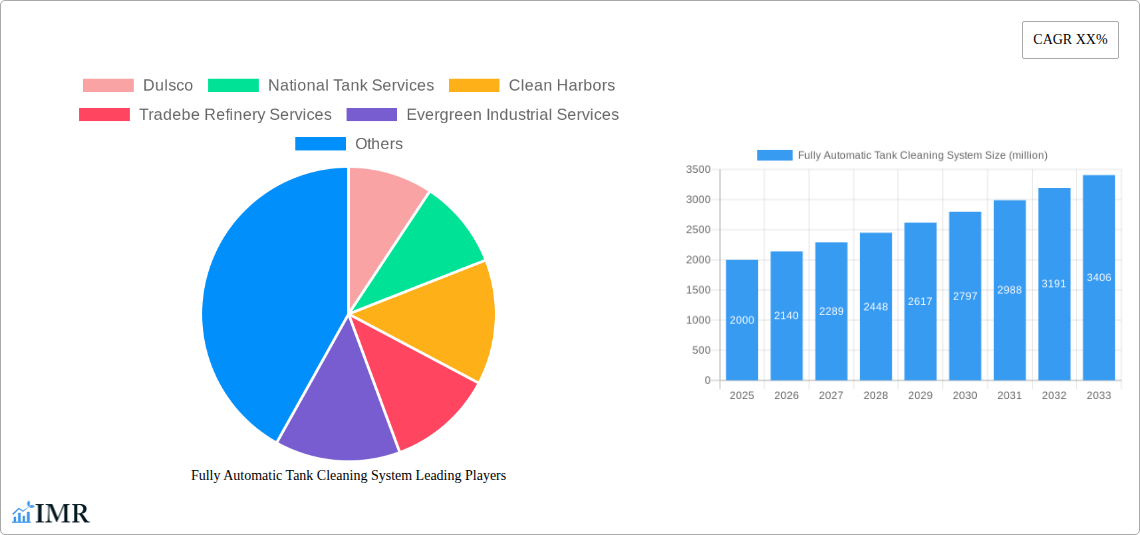
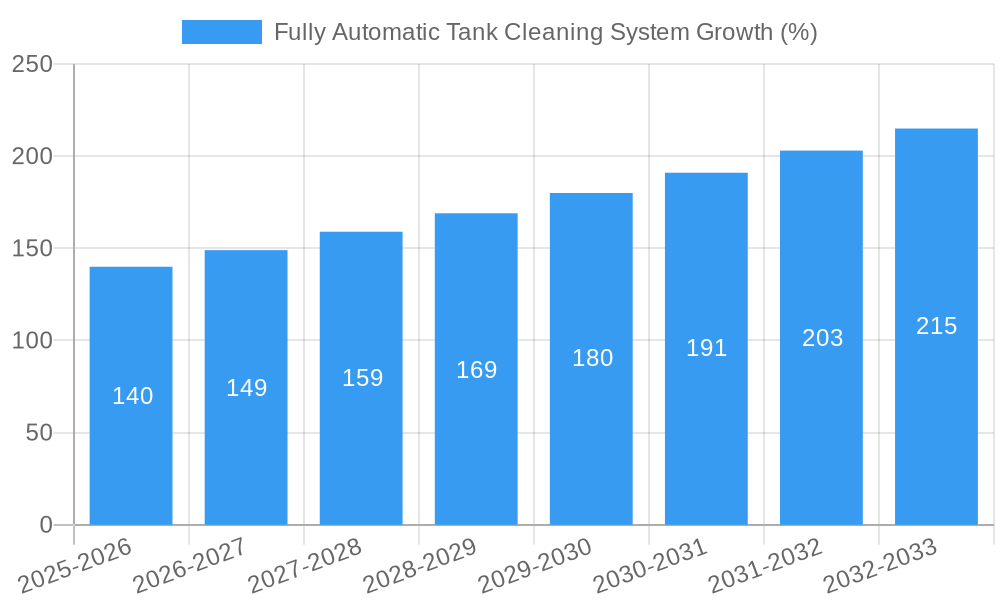
The global fully automatic tank cleaning system market is experiencing robust growth, driven by increasing demand for efficient and safe cleaning solutions across various industries. Stringent environmental regulations and the rising need to minimize downtime in operations are key factors propelling market expansion. The market's value, estimated at $2 billion in 2025, is projected to witness a Compound Annual Growth Rate (CAGR) of 7% between 2025 and 2033, reaching approximately $3.5 billion by 2033. This growth is fueled by technological advancements leading to the development of more efficient and environmentally friendly systems, as well as the increasing adoption of automation across industrial sectors. Major players like Dulsco, National Tank Services, and Clean Harbors are significantly contributing to market growth through their innovative product offerings and strategic partnerships. Market segmentation reveals a strong demand across regions like North America and Europe, driven by established industrial bases and stringent regulatory frameworks.
However, high initial investment costs for fully automatic tank cleaning systems and the requirement for specialized technical expertise can pose challenges for market penetration. Furthermore, the availability of alternative, albeit less efficient, cleaning methods may also limit the adoption of fully automatic systems in some sectors. Despite these restraints, the long-term benefits of enhanced safety, reduced environmental impact, and improved operational efficiency are expected to drive continuous growth in the market. The ongoing trend towards automation and digitalization across industrial processes will further boost the demand for sophisticated tank cleaning solutions, shaping future market dynamics. The focus on developing systems with superior cleaning capabilities and minimal water usage will play a crucial role in shaping the future of the market.
Fully Automatic Tank Cleaning System Market Report: 2019-2033
This comprehensive report provides an in-depth analysis of the Fully Automatic Tank Cleaning System market, encompassing market dynamics, growth trends, regional dominance, product landscape, challenges, opportunities, and key players. The study period covers 2019-2033, with 2025 as the base and estimated year, and a forecast period of 2025-2033. The historical period analyzed is 2019-2024. The report caters to industry professionals, investors, and businesses seeking to understand this rapidly evolving market valued at xx million USD in 2025 and projected to reach xx million USD by 2033. Parent markets include industrial cleaning and environmental services, while child markets encompass oil & gas, chemical, and food processing industries.
Fully Automatic Tank Cleaning System Market Dynamics & Structure
The Fully Automatic Tank Cleaning System market is characterized by moderate concentration, with a few major players holding significant market share. Technological innovation, driven by advancements in robotics, automation, and cleaning solutions, is a primary growth driver. Stringent environmental regulations regarding waste disposal and emission control further fuel market expansion. Competitive substitutes include manual cleaning methods, but their inefficiency and safety concerns limit their appeal. End-users primarily consist of industrial facilities requiring efficient and safe tank cleaning. M&A activity has been moderate, with approximately xx deals recorded in the past five years, primarily focused on expanding geographic reach and service offerings.
- Market Concentration: Moderately concentrated, with top 5 players holding approximately xx% market share in 2025.
- Technological Innovation: Focus on AI-powered systems, advanced nozzle designs, and remote monitoring capabilities.
- Regulatory Landscape: Stringent environmental regulations drive demand for automated, efficient solutions.
- Competitive Substitutes: Manual cleaning methods face limitations due to safety, efficiency, and environmental concerns.
- End-User Demographics: Primarily industrial facilities in oil & gas, chemicals, and food processing sectors.
- M&A Trends: Moderate activity, with a focus on expansion and diversification.
Fully Automatic Tank Cleaning System Growth Trends & Insights
The Fully Automatic Tank Cleaning System market exhibits robust growth, driven by increasing demand for efficient and safe tank cleaning solutions across various industries. The market size experienced a CAGR of xx% during the historical period (2019-2024) and is projected to grow at a CAGR of xx% during the forecast period (2025-2033). This growth is fueled by rising automation adoption rates, particularly in sectors with stringent safety and environmental regulations. Technological disruptions, such as the introduction of AI-powered systems and improved cleaning agents, enhance efficiency and reduce operational costs. Consumer behavior shifts towards prioritizing safety and sustainability are also contributing factors. Market penetration is estimated at xx% in 2025, with significant potential for future growth in untapped markets.
Dominant Regions, Countries, or Segments in Fully Automatic Tank Cleaning System
North America currently holds the largest market share, driven by a robust industrial base, stringent environmental regulations, and high adoption rates of advanced technologies. Europe follows closely, propelled by similar factors. Asia-Pacific is expected to witness the fastest growth, fueled by rapid industrialization and expanding oil & gas and chemical sectors.
- North America: High market share due to strong regulatory environment and industrial development.
- Europe: Significant market size driven by advanced technologies and strict environmental policies.
- Asia-Pacific: Fastest-growing region due to rapid industrialization and increasing investment in infrastructure.
- Key Drivers: Stringent environmental regulations, rising safety concerns, and technological advancements.
Fully Automatic Tank Cleaning System Product Landscape
The market features a range of systems varying in capacity, automation levels, and cleaning methods. Innovations focus on enhancing cleaning efficiency, reducing water and chemical consumption, and improving safety features. These systems incorporate advanced sensors, robotic arms, and intelligent control systems for optimized performance. Unique selling propositions include reduced downtime, improved safety, and lower operational costs. Technological advancements continue to drive improvements in cleaning speed, efficiency, and environmental impact.
Key Drivers, Barriers & Challenges in Fully Automatic Tank Cleaning System
Key Drivers:
- Increasing demand for efficient and safe cleaning solutions.
- Stringent environmental regulations and safety standards.
- Technological advancements in automation and robotics.
Challenges & Restraints:
- High initial investment costs for fully automated systems.
- Potential integration challenges with existing infrastructure.
- Limited skilled labor for system operation and maintenance (estimated impact: xx% reduction in adoption rate).
Emerging Opportunities in Fully Automatic Tank Cleaning System
Emerging opportunities include expanding into untapped markets in developing economies, integrating advanced analytics for predictive maintenance and optimization, and developing eco-friendly cleaning solutions. The development of specialized systems for unique tank configurations and materials presents further opportunities. Growing focus on sustainability will drive the demand for environmentally friendly cleaning agents and processes.
Growth Accelerators in the Fully Automatic Tank Cleaning System Industry
Technological breakthroughs in robotics, AI, and sensor technologies are accelerating market growth. Strategic partnerships between equipment manufacturers and service providers are expanding market reach and enhancing service capabilities. Expansion into new geographical markets, particularly in developing economies, will further fuel growth.
Key Players Shaping the Fully Automatic Tank Cleaning System Market
- Dulsco
- National Tank Services
- Clean Harbors
- Tradebe Refinery Services
- Evergreen Industrial Services
- ARKOIL Technologies
- SWS Environmental Services
- System Kikou Co
- Thompson Industrial Services LLC
- HTS
- Bluestar
- Midwestern Services Inc
- Veolia Environment
- Dynea
- Jereh Group
- STS
- Kanganyouguan
- Yongxin Cleaning
Notable Milestones in Fully Automatic Tank Cleaning System Sector
- 2020: Introduction of AI-powered tank cleaning system by [Company Name].
- 2022: Merger between [Company A] and [Company B], expanding market reach.
- 2023: Launch of eco-friendly cleaning agent by [Company Name].
In-Depth Fully Automatic Tank Cleaning System Market Outlook
The Fully Automatic Tank Cleaning System market is poised for continued strong growth, driven by technological advancements, stringent regulations, and increasing awareness of safety and environmental concerns. Strategic partnerships, market expansions, and innovations in cleaning technologies will unlock significant future potential, creating substantial opportunities for market participants.
Fully Automatic Tank Cleaning System Segmentation
-
1. Application
- 1.1. Crude Oil Tanks
- 1.2. Refinery Tanks
- 1.3. Commercial Tank
- 1.4. Other
-
2. Types
- 2.1. Split Type
- 2.2. One-piece Type
Fully Automatic Tank Cleaning System Segmentation By Geography
-
1. North America
- 1.1. United States
- 1.2. Canada
- 1.3. Mexico
-
2. South America
- 2.1. Brazil
- 2.2. Argentina
- 2.3. Rest of South America
-
3. Europe
- 3.1. United Kingdom
- 3.2. Germany
- 3.3. France
- 3.4. Italy
- 3.5. Spain
- 3.6. Russia
- 3.7. Benelux
- 3.8. Nordics
- 3.9. Rest of Europe
-
4. Middle East & Africa
- 4.1. Turkey
- 4.2. Israel
- 4.3. GCC
- 4.4. North Africa
- 4.5. South Africa
- 4.6. Rest of Middle East & Africa
-
5. Asia Pacific
- 5.1. China
- 5.2. India
- 5.3. Japan
- 5.4. South Korea
- 5.5. ASEAN
- 5.6. Oceania
- 5.7. Rest of Asia Pacific

Fully Automatic Tank Cleaning System REPORT HIGHLIGHTS
| Aspects | Details |
|---|---|
| Study Period | 2019-2033 |
| Base Year | 2024 |
| Estimated Year | 2025 |
| Forecast Period | 2025-2033 |
| Historical Period | 2019-2024 |
| Growth Rate | CAGR of XX% from 2019-2033 |
| Segmentation |
|
Table of Contents
- 1. Introduction
- 1.1. Research Scope
- 1.2. Market Segmentation
- 1.3. Research Methodology
- 1.4. Definitions and Assumptions
- 2. Executive Summary
- 2.1. Introduction
- 3. Market Dynamics
- 3.1. Introduction
- 3.2. Market Drivers
- 3.3. Market Restrains
- 3.4. Market Trends
- 4. Market Factor Analysis
- 4.1. Porters Five Forces
- 4.2. Supply/Value Chain
- 4.3. PESTEL analysis
- 4.4. Market Entropy
- 4.5. Patent/Trademark Analysis
- 5. Global Fully Automatic Tank Cleaning System Analysis, Insights and Forecast, 2019-2031
- 5.1. Market Analysis, Insights and Forecast - by Application
- 5.1.1. Crude Oil Tanks
- 5.1.2. Refinery Tanks
- 5.1.3. Commercial Tank
- 5.1.4. Other
- 5.2. Market Analysis, Insights and Forecast - by Types
- 5.2.1. Split Type
- 5.2.2. One-piece Type
- 5.3. Market Analysis, Insights and Forecast - by Region
- 5.3.1. North America
- 5.3.2. South America
- 5.3.3. Europe
- 5.3.4. Middle East & Africa
- 5.3.5. Asia Pacific
- 5.1. Market Analysis, Insights and Forecast - by Application
- 6. North America Fully Automatic Tank Cleaning System Analysis, Insights and Forecast, 2019-2031
- 6.1. Market Analysis, Insights and Forecast - by Application
- 6.1.1. Crude Oil Tanks
- 6.1.2. Refinery Tanks
- 6.1.3. Commercial Tank
- 6.1.4. Other
- 6.2. Market Analysis, Insights and Forecast - by Types
- 6.2.1. Split Type
- 6.2.2. One-piece Type
- 6.1. Market Analysis, Insights and Forecast - by Application
- 7. South America Fully Automatic Tank Cleaning System Analysis, Insights and Forecast, 2019-2031
- 7.1. Market Analysis, Insights and Forecast - by Application
- 7.1.1. Crude Oil Tanks
- 7.1.2. Refinery Tanks
- 7.1.3. Commercial Tank
- 7.1.4. Other
- 7.2. Market Analysis, Insights and Forecast - by Types
- 7.2.1. Split Type
- 7.2.2. One-piece Type
- 7.1. Market Analysis, Insights and Forecast - by Application
- 8. Europe Fully Automatic Tank Cleaning System Analysis, Insights and Forecast, 2019-2031
- 8.1. Market Analysis, Insights and Forecast - by Application
- 8.1.1. Crude Oil Tanks
- 8.1.2. Refinery Tanks
- 8.1.3. Commercial Tank
- 8.1.4. Other
- 8.2. Market Analysis, Insights and Forecast - by Types
- 8.2.1. Split Type
- 8.2.2. One-piece Type
- 8.1. Market Analysis, Insights and Forecast - by Application
- 9. Middle East & Africa Fully Automatic Tank Cleaning System Analysis, Insights and Forecast, 2019-2031
- 9.1. Market Analysis, Insights and Forecast - by Application
- 9.1.1. Crude Oil Tanks
- 9.1.2. Refinery Tanks
- 9.1.3. Commercial Tank
- 9.1.4. Other
- 9.2. Market Analysis, Insights and Forecast - by Types
- 9.2.1. Split Type
- 9.2.2. One-piece Type
- 9.1. Market Analysis, Insights and Forecast - by Application
- 10. Asia Pacific Fully Automatic Tank Cleaning System Analysis, Insights and Forecast, 2019-2031
- 10.1. Market Analysis, Insights and Forecast - by Application
- 10.1.1. Crude Oil Tanks
- 10.1.2. Refinery Tanks
- 10.1.3. Commercial Tank
- 10.1.4. Other
- 10.2. Market Analysis, Insights and Forecast - by Types
- 10.2.1. Split Type
- 10.2.2. One-piece Type
- 10.1. Market Analysis, Insights and Forecast - by Application
- 11. Competitive Analysis
- 11.1. Global Market Share Analysis 2024
- 11.2. Company Profiles
- 11.2.1 Dulsco
- 11.2.1.1. Overview
- 11.2.1.2. Products
- 11.2.1.3. SWOT Analysis
- 11.2.1.4. Recent Developments
- 11.2.1.5. Financials (Based on Availability)
- 11.2.2 National Tank Services
- 11.2.2.1. Overview
- 11.2.2.2. Products
- 11.2.2.3. SWOT Analysis
- 11.2.2.4. Recent Developments
- 11.2.2.5. Financials (Based on Availability)
- 11.2.3 Clean Harbors
- 11.2.3.1. Overview
- 11.2.3.2. Products
- 11.2.3.3. SWOT Analysis
- 11.2.3.4. Recent Developments
- 11.2.3.5. Financials (Based on Availability)
- 11.2.4 Tradebe Refinery Services
- 11.2.4.1. Overview
- 11.2.4.2. Products
- 11.2.4.3. SWOT Analysis
- 11.2.4.4. Recent Developments
- 11.2.4.5. Financials (Based on Availability)
- 11.2.5 Evergreen Industrial Services
- 11.2.5.1. Overview
- 11.2.5.2. Products
- 11.2.5.3. SWOT Analysis
- 11.2.5.4. Recent Developments
- 11.2.5.5. Financials (Based on Availability)
- 11.2.6 ARKOIL Technologies
- 11.2.6.1. Overview
- 11.2.6.2. Products
- 11.2.6.3. SWOT Analysis
- 11.2.6.4. Recent Developments
- 11.2.6.5. Financials (Based on Availability)
- 11.2.7 SWS Environmental Services
- 11.2.7.1. Overview
- 11.2.7.2. Products
- 11.2.7.3. SWOT Analysis
- 11.2.7.4. Recent Developments
- 11.2.7.5. Financials (Based on Availability)
- 11.2.8 System Kikou Co
- 11.2.8.1. Overview
- 11.2.8.2. Products
- 11.2.8.3. SWOT Analysis
- 11.2.8.4. Recent Developments
- 11.2.8.5. Financials (Based on Availability)
- 11.2.9 Thompson Industrial Services LLC
- 11.2.9.1. Overview
- 11.2.9.2. Products
- 11.2.9.3. SWOT Analysis
- 11.2.9.4. Recent Developments
- 11.2.9.5. Financials (Based on Availability)
- 11.2.10 HTS
- 11.2.10.1. Overview
- 11.2.10.2. Products
- 11.2.10.3. SWOT Analysis
- 11.2.10.4. Recent Developments
- 11.2.10.5. Financials (Based on Availability)
- 11.2.11 Bluestar
- 11.2.11.1. Overview
- 11.2.11.2. Products
- 11.2.11.3. SWOT Analysis
- 11.2.11.4. Recent Developments
- 11.2.11.5. Financials (Based on Availability)
- 11.2.12 Midwestern Services Inc
- 11.2.12.1. Overview
- 11.2.12.2. Products
- 11.2.12.3. SWOT Analysis
- 11.2.12.4. Recent Developments
- 11.2.12.5. Financials (Based on Availability)
- 11.2.13 Veolia Environment
- 11.2.13.1. Overview
- 11.2.13.2. Products
- 11.2.13.3. SWOT Analysis
- 11.2.13.4. Recent Developments
- 11.2.13.5. Financials (Based on Availability)
- 11.2.14 Dynea
- 11.2.14.1. Overview
- 11.2.14.2. Products
- 11.2.14.3. SWOT Analysis
- 11.2.14.4. Recent Developments
- 11.2.14.5. Financials (Based on Availability)
- 11.2.15 Jereh Group
- 11.2.15.1. Overview
- 11.2.15.2. Products
- 11.2.15.3. SWOT Analysis
- 11.2.15.4. Recent Developments
- 11.2.15.5. Financials (Based on Availability)
- 11.2.16 STS
- 11.2.16.1. Overview
- 11.2.16.2. Products
- 11.2.16.3. SWOT Analysis
- 11.2.16.4. Recent Developments
- 11.2.16.5. Financials (Based on Availability)
- 11.2.17 Kanganyouguan
- 11.2.17.1. Overview
- 11.2.17.2. Products
- 11.2.17.3. SWOT Analysis
- 11.2.17.4. Recent Developments
- 11.2.17.5. Financials (Based on Availability)
- 11.2.18 Yongxin Cleaning
- 11.2.18.1. Overview
- 11.2.18.2. Products
- 11.2.18.3. SWOT Analysis
- 11.2.18.4. Recent Developments
- 11.2.18.5. Financials (Based on Availability)
- 11.2.1 Dulsco
List of Figures
- Figure 1: Global Fully Automatic Tank Cleaning System Revenue Breakdown (million, %) by Region 2024 & 2032
- Figure 2: North America Fully Automatic Tank Cleaning System Revenue (million), by Application 2024 & 2032
- Figure 3: North America Fully Automatic Tank Cleaning System Revenue Share (%), by Application 2024 & 2032
- Figure 4: North America Fully Automatic Tank Cleaning System Revenue (million), by Types 2024 & 2032
- Figure 5: North America Fully Automatic Tank Cleaning System Revenue Share (%), by Types 2024 & 2032
- Figure 6: North America Fully Automatic Tank Cleaning System Revenue (million), by Country 2024 & 2032
- Figure 7: North America Fully Automatic Tank Cleaning System Revenue Share (%), by Country 2024 & 2032
- Figure 8: South America Fully Automatic Tank Cleaning System Revenue (million), by Application 2024 & 2032
- Figure 9: South America Fully Automatic Tank Cleaning System Revenue Share (%), by Application 2024 & 2032
- Figure 10: South America Fully Automatic Tank Cleaning System Revenue (million), by Types 2024 & 2032
- Figure 11: South America Fully Automatic Tank Cleaning System Revenue Share (%), by Types 2024 & 2032
- Figure 12: South America Fully Automatic Tank Cleaning System Revenue (million), by Country 2024 & 2032
- Figure 13: South America Fully Automatic Tank Cleaning System Revenue Share (%), by Country 2024 & 2032
- Figure 14: Europe Fully Automatic Tank Cleaning System Revenue (million), by Application 2024 & 2032
- Figure 15: Europe Fully Automatic Tank Cleaning System Revenue Share (%), by Application 2024 & 2032
- Figure 16: Europe Fully Automatic Tank Cleaning System Revenue (million), by Types 2024 & 2032
- Figure 17: Europe Fully Automatic Tank Cleaning System Revenue Share (%), by Types 2024 & 2032
- Figure 18: Europe Fully Automatic Tank Cleaning System Revenue (million), by Country 2024 & 2032
- Figure 19: Europe Fully Automatic Tank Cleaning System Revenue Share (%), by Country 2024 & 2032
- Figure 20: Middle East & Africa Fully Automatic Tank Cleaning System Revenue (million), by Application 2024 & 2032
- Figure 21: Middle East & Africa Fully Automatic Tank Cleaning System Revenue Share (%), by Application 2024 & 2032
- Figure 22: Middle East & Africa Fully Automatic Tank Cleaning System Revenue (million), by Types 2024 & 2032
- Figure 23: Middle East & Africa Fully Automatic Tank Cleaning System Revenue Share (%), by Types 2024 & 2032
- Figure 24: Middle East & Africa Fully Automatic Tank Cleaning System Revenue (million), by Country 2024 & 2032
- Figure 25: Middle East & Africa Fully Automatic Tank Cleaning System Revenue Share (%), by Country 2024 & 2032
- Figure 26: Asia Pacific Fully Automatic Tank Cleaning System Revenue (million), by Application 2024 & 2032
- Figure 27: Asia Pacific Fully Automatic Tank Cleaning System Revenue Share (%), by Application 2024 & 2032
- Figure 28: Asia Pacific Fully Automatic Tank Cleaning System Revenue (million), by Types 2024 & 2032
- Figure 29: Asia Pacific Fully Automatic Tank Cleaning System Revenue Share (%), by Types 2024 & 2032
- Figure 30: Asia Pacific Fully Automatic Tank Cleaning System Revenue (million), by Country 2024 & 2032
- Figure 31: Asia Pacific Fully Automatic Tank Cleaning System Revenue Share (%), by Country 2024 & 2032
List of Tables
- Table 1: Global Fully Automatic Tank Cleaning System Revenue million Forecast, by Region 2019 & 2032
- Table 2: Global Fully Automatic Tank Cleaning System Revenue million Forecast, by Application 2019 & 2032
- Table 3: Global Fully Automatic Tank Cleaning System Revenue million Forecast, by Types 2019 & 2032
- Table 4: Global Fully Automatic Tank Cleaning System Revenue million Forecast, by Region 2019 & 2032
- Table 5: Global Fully Automatic Tank Cleaning System Revenue million Forecast, by Application 2019 & 2032
- Table 6: Global Fully Automatic Tank Cleaning System Revenue million Forecast, by Types 2019 & 2032
- Table 7: Global Fully Automatic Tank Cleaning System Revenue million Forecast, by Country 2019 & 2032
- Table 8: United States Fully Automatic Tank Cleaning System Revenue (million) Forecast, by Application 2019 & 2032
- Table 9: Canada Fully Automatic Tank Cleaning System Revenue (million) Forecast, by Application 2019 & 2032
- Table 10: Mexico Fully Automatic Tank Cleaning System Revenue (million) Forecast, by Application 2019 & 2032
- Table 11: Global Fully Automatic Tank Cleaning System Revenue million Forecast, by Application 2019 & 2032
- Table 12: Global Fully Automatic Tank Cleaning System Revenue million Forecast, by Types 2019 & 2032
- Table 13: Global Fully Automatic Tank Cleaning System Revenue million Forecast, by Country 2019 & 2032
- Table 14: Brazil Fully Automatic Tank Cleaning System Revenue (million) Forecast, by Application 2019 & 2032
- Table 15: Argentina Fully Automatic Tank Cleaning System Revenue (million) Forecast, by Application 2019 & 2032
- Table 16: Rest of South America Fully Automatic Tank Cleaning System Revenue (million) Forecast, by Application 2019 & 2032
- Table 17: Global Fully Automatic Tank Cleaning System Revenue million Forecast, by Application 2019 & 2032
- Table 18: Global Fully Automatic Tank Cleaning System Revenue million Forecast, by Types 2019 & 2032
- Table 19: Global Fully Automatic Tank Cleaning System Revenue million Forecast, by Country 2019 & 2032
- Table 20: United Kingdom Fully Automatic Tank Cleaning System Revenue (million) Forecast, by Application 2019 & 2032
- Table 21: Germany Fully Automatic Tank Cleaning System Revenue (million) Forecast, by Application 2019 & 2032
- Table 22: France Fully Automatic Tank Cleaning System Revenue (million) Forecast, by Application 2019 & 2032
- Table 23: Italy Fully Automatic Tank Cleaning System Revenue (million) Forecast, by Application 2019 & 2032
- Table 24: Spain Fully Automatic Tank Cleaning System Revenue (million) Forecast, by Application 2019 & 2032
- Table 25: Russia Fully Automatic Tank Cleaning System Revenue (million) Forecast, by Application 2019 & 2032
- Table 26: Benelux Fully Automatic Tank Cleaning System Revenue (million) Forecast, by Application 2019 & 2032
- Table 27: Nordics Fully Automatic Tank Cleaning System Revenue (million) Forecast, by Application 2019 & 2032
- Table 28: Rest of Europe Fully Automatic Tank Cleaning System Revenue (million) Forecast, by Application 2019 & 2032
- Table 29: Global Fully Automatic Tank Cleaning System Revenue million Forecast, by Application 2019 & 2032
- Table 30: Global Fully Automatic Tank Cleaning System Revenue million Forecast, by Types 2019 & 2032
- Table 31: Global Fully Automatic Tank Cleaning System Revenue million Forecast, by Country 2019 & 2032
- Table 32: Turkey Fully Automatic Tank Cleaning System Revenue (million) Forecast, by Application 2019 & 2032
- Table 33: Israel Fully Automatic Tank Cleaning System Revenue (million) Forecast, by Application 2019 & 2032
- Table 34: GCC Fully Automatic Tank Cleaning System Revenue (million) Forecast, by Application 2019 & 2032
- Table 35: North Africa Fully Automatic Tank Cleaning System Revenue (million) Forecast, by Application 2019 & 2032
- Table 36: South Africa Fully Automatic Tank Cleaning System Revenue (million) Forecast, by Application 2019 & 2032
- Table 37: Rest of Middle East & Africa Fully Automatic Tank Cleaning System Revenue (million) Forecast, by Application 2019 & 2032
- Table 38: Global Fully Automatic Tank Cleaning System Revenue million Forecast, by Application 2019 & 2032
- Table 39: Global Fully Automatic Tank Cleaning System Revenue million Forecast, by Types 2019 & 2032
- Table 40: Global Fully Automatic Tank Cleaning System Revenue million Forecast, by Country 2019 & 2032
- Table 41: China Fully Automatic Tank Cleaning System Revenue (million) Forecast, by Application 2019 & 2032
- Table 42: India Fully Automatic Tank Cleaning System Revenue (million) Forecast, by Application 2019 & 2032
- Table 43: Japan Fully Automatic Tank Cleaning System Revenue (million) Forecast, by Application 2019 & 2032
- Table 44: South Korea Fully Automatic Tank Cleaning System Revenue (million) Forecast, by Application 2019 & 2032
- Table 45: ASEAN Fully Automatic Tank Cleaning System Revenue (million) Forecast, by Application 2019 & 2032
- Table 46: Oceania Fully Automatic Tank Cleaning System Revenue (million) Forecast, by Application 2019 & 2032
- Table 47: Rest of Asia Pacific Fully Automatic Tank Cleaning System Revenue (million) Forecast, by Application 2019 & 2032
Frequently Asked Questions
1. What is the projected Compound Annual Growth Rate (CAGR) of the Fully Automatic Tank Cleaning System?
The projected CAGR is approximately XX%.
2. Which companies are prominent players in the Fully Automatic Tank Cleaning System?
Key companies in the market include Dulsco, National Tank Services, Clean Harbors, Tradebe Refinery Services, Evergreen Industrial Services, ARKOIL Technologies, SWS Environmental Services, System Kikou Co, Thompson Industrial Services LLC, HTS, Bluestar, Midwestern Services Inc, Veolia Environment, Dynea, Jereh Group, STS, Kanganyouguan, Yongxin Cleaning.
3. What are the main segments of the Fully Automatic Tank Cleaning System?
The market segments include Application, Types.
4. Can you provide details about the market size?
The market size is estimated to be USD XXX million as of 2022.
5. What are some drivers contributing to market growth?
N/A
6. What are the notable trends driving market growth?
N/A
7. Are there any restraints impacting market growth?
N/A
8. Can you provide examples of recent developments in the market?
N/A
9. What pricing options are available for accessing the report?
Pricing options include single-user, multi-user, and enterprise licenses priced at USD 4900.00, USD 7350.00, and USD 9800.00 respectively.
10. Is the market size provided in terms of value or volume?
The market size is provided in terms of value, measured in million.
11. Are there any specific market keywords associated with the report?
Yes, the market keyword associated with the report is "Fully Automatic Tank Cleaning System," which aids in identifying and referencing the specific market segment covered.
12. How do I determine which pricing option suits my needs best?
The pricing options vary based on user requirements and access needs. Individual users may opt for single-user licenses, while businesses requiring broader access may choose multi-user or enterprise licenses for cost-effective access to the report.
13. Are there any additional resources or data provided in the Fully Automatic Tank Cleaning System report?
While the report offers comprehensive insights, it's advisable to review the specific contents or supplementary materials provided to ascertain if additional resources or data are available.
14. How can I stay updated on further developments or reports in the Fully Automatic Tank Cleaning System?
To stay informed about further developments, trends, and reports in the Fully Automatic Tank Cleaning System, consider subscribing to industry newsletters, following relevant companies and organizations, or regularly checking reputable industry news sources and publications.
Methodology
Step 1 - Identification of Relevant Samples Size from Population Database


Step 2 - Approaches for Defining Global Market Size (Value, Volume* & Price*)

Note*: In applicable scenarios
Step 3 - Data Sources
Primary Research
- Web Analytics
- Survey Reports
- Research Institute
- Latest Research Reports
- Opinion Leaders
Secondary Research
- Annual Reports
- White Paper
- Latest Press Release
- Industry Association
- Paid Database
- Investor Presentations

Step 4 - Data Triangulation
Involves using different sources of information in order to increase the validity of a study
These sources are likely to be stakeholders in a program - participants, other researchers, program staff, other community members, and so on.
Then we put all data in single framework & apply various statistical tools to find out the dynamic on the market.
During the analysis stage, feedback from the stakeholder groups would be compared to determine areas of agreement as well as areas of divergence
