

Key Insights
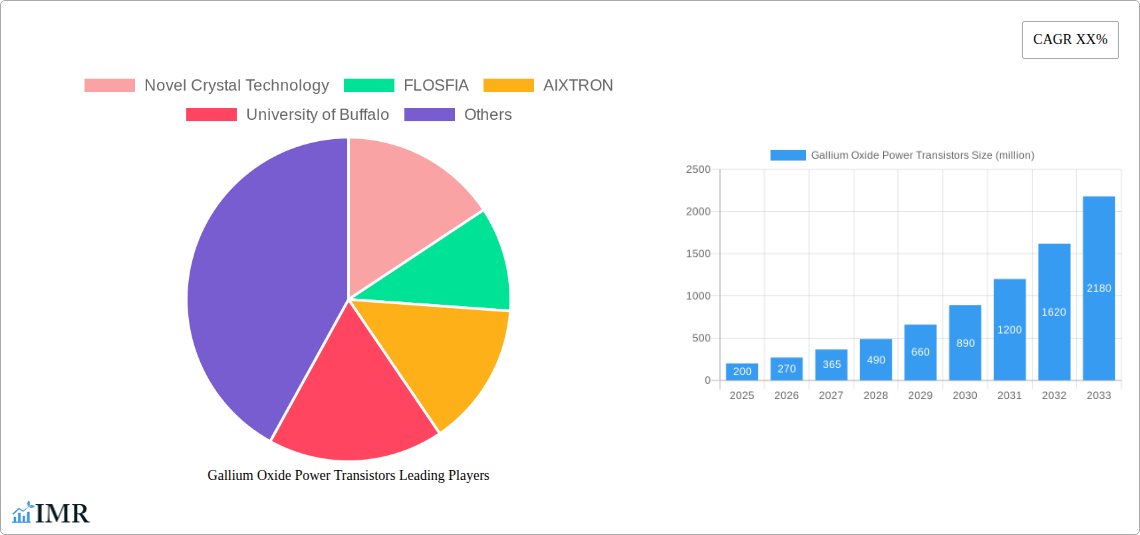
The Gallium Oxide (Ga2O3) power transistor market is poised for significant growth, driven by its superior material properties compared to silicon and silicon carbide. Ga2O3 offers higher breakdown voltage, lower on-resistance, and greater efficiency, making it ideal for high-power applications in electric vehicles (EVs), renewable energy systems, and industrial automation. The market's Compound Annual Growth Rate (CAGR) is estimated at 35% from 2025 to 2033, propelled by increasing demand for efficient power electronics in these sectors. While the market is currently in its nascent stage, key players like Novel Crystal Technology, FLOSFIA, AIXTRON, and research institutions such as the University of Buffalo are actively contributing to technological advancements and driving adoption. The largest market segments are projected to be those serving the EV and renewable energy sectors, with North America and Asia-Pacific expected to dominate regional market share due to strong government support for clean energy initiatives and a flourishing EV manufacturing base. Challenges include the high cost of Ga2O3 material and the need for further research and development to optimize device performance and manufacturing processes for mass production.
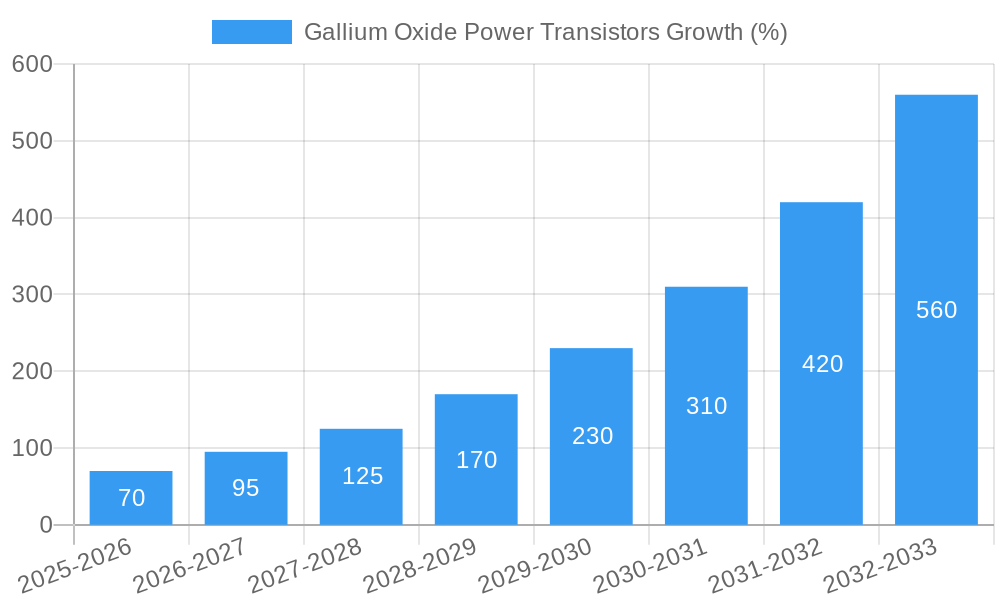
This rapid expansion is expected to continue through 2033, as technological advancements address current limitations and manufacturing scales up. The reduction in cost per unit will be a key driver of wider adoption. The market segmentation will see a shift towards higher power applications as the technology matures, pushing the boundaries of what's possible in power electronics. Continued collaboration between industry players and research institutions will be crucial in accelerating the market's growth trajectory and establishing Ga2O3 as the leading material for next-generation power transistors. The market size in 2025 is estimated at $200 million, projected to reach over $2 billion by 2033 based on the CAGR.
Gallium Oxide Power Transistors Market Report: 2019-2033
This comprehensive report provides an in-depth analysis of the Gallium Oxide Power Transistors market, encompassing market dynamics, growth trends, regional dominance, product landscape, key players, and future outlook. The report covers the period 2019-2033, with a focus on the forecast period 2025-2033, using 2025 as the base and estimated year. This report is invaluable for industry professionals, investors, and researchers seeking a detailed understanding of this rapidly evolving sector within the broader power semiconductor market.
Gallium Oxide Power Transistors Market Dynamics & Structure
This section analyzes the competitive landscape, technological advancements, regulatory influences, and market trends shaping the Gallium Oxide Power Transistors market. The market is currently experiencing significant growth driven by the increasing demand for high-power, high-efficiency electronic devices across various end-use sectors. The study period (2019-2024) saw significant investment in R&D and manufacturing capacity, leading to an expanding product portfolio and improved performance metrics.
- Market Concentration: The market is characterized by a moderately concentrated structure with several key players holding significant market share. The top five companies hold approximately xx% of the global market share in 2025, with further consolidation expected in the forecast period.
- Technological Innovation: Continuous advancements in gallium oxide material science and device fabrication techniques are driving the development of more efficient and reliable power transistors. The focus is on reducing on-resistance, improving switching speeds, and enhancing thermal management.
- Regulatory Frameworks: Government initiatives promoting energy efficiency and the adoption of renewable energy technologies are indirectly supporting the growth of the Gallium Oxide Power Transistors market. Stringent environmental regulations are further incentivizing the adoption of high-efficiency power electronics.
- Competitive Product Substitutes: Silicon carbide (SiC) and silicon (Si) power transistors are the primary competitors. However, Gallium Oxide (Ga2O3) offers superior performance advantages in high-power applications. This advantage is fueling the Ga2O3 market's growth.
- End-User Demographics: The key end-use sectors for Gallium Oxide Power Transistors include renewable energy (solar inverters, wind turbines), electric vehicles (EV chargers, power inverters), industrial automation, and data centers. The growing demand for these applications is driving market growth.
- M&A Trends: The number of mergers and acquisitions (M&A) deals in the Ga2O3 power transistor sector has increased significantly in recent years. Consolidation amongst companies is expected to continue, leading to a further shaping of the competitive landscape. In 2024, approximately xx M&A deals were recorded, indicating a rising trend.
Gallium Oxide Power Transistors Growth Trends & Insights
The global Gallium Oxide Power Transistors market is projected to experience robust growth during the forecast period (2025-2033). Driven by increasing demand for higher power density and efficiency in various applications, the market is anticipated to reach xx million units by 2033, exhibiting a CAGR of xx% from 2025 to 2033. This growth is fueled by technological advancements, including improved material quality, advanced manufacturing processes, and the development of new device architectures leading to higher switching frequencies and lower power losses. The adoption rate is increasing across key end-user segments, particularly in the renewable energy and electric vehicle sectors. Market penetration is expected to increase significantly in developing economies due to rising electrification and investments in renewable energy infrastructure. Technological disruptions, such as the development of next-generation Ga2O3 devices and manufacturing processes, will further accelerate market growth. Consumer behavior is also shifting towards more energy-efficient and environmentally friendly products, fostering the adoption of Ga2O3-based power electronics.
Dominant Regions, Countries, or Segments in Gallium Oxide Power Transistors
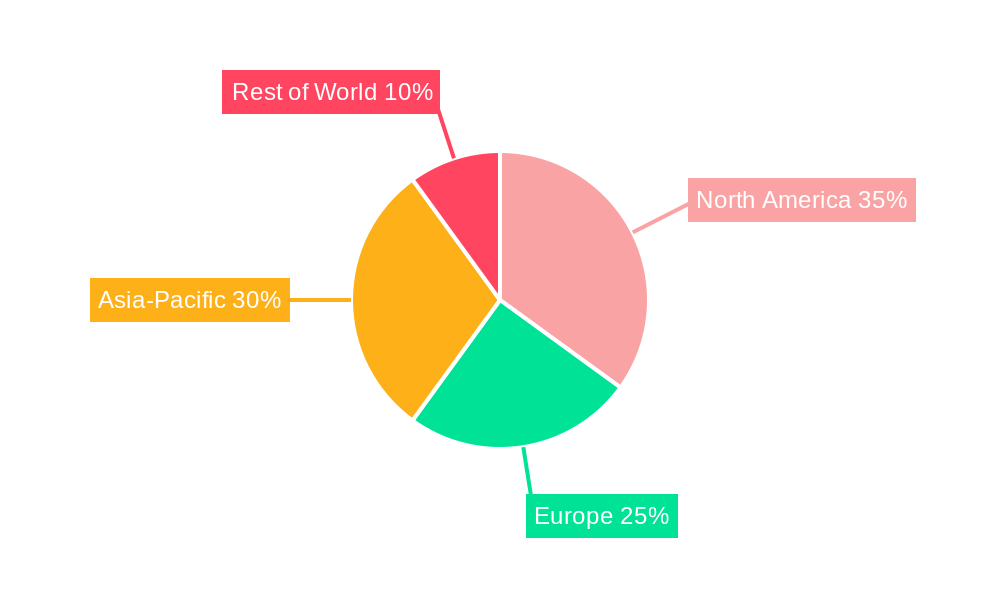
The North American region is expected to maintain its leading position in the Gallium Oxide Power Transistors market throughout the forecast period, driven by robust investments in renewable energy and electric vehicle infrastructure. Asia-Pacific is also expected to show significant growth, with China, Japan, and South Korea emerging as key players. The growth in these regions is attributed to:
- Government Policies: Supportive government policies and financial incentives promoting renewable energy adoption and electric vehicle penetration are driving the demand for high-efficiency power transistors.
- Technological Advancements: Advanced manufacturing capabilities and strong research and development activities are enhancing the competitiveness of these regions.
- Infrastructure Development: Significant investments in power grid modernization and electric vehicle charging infrastructure are fueling the market.
Europe is also a significant market, driven by stringent environmental regulations and a focus on sustainable technologies. Within the various market segments, high-power applications (e.g., renewable energy, industrial drives) are experiencing the highest growth rates due to their superior performance characteristics compared to traditional silicon-based transistors.
Gallium Oxide Power Transistors Product Landscape
Gallium Oxide power transistors are characterized by their superior performance attributes, including high breakdown voltage, low on-resistance, and fast switching speeds. These advantages make them ideal for high-power applications requiring superior efficiency and reliability. Ongoing innovations focus on improving device architecture, material quality, and manufacturing processes to further enhance performance and reduce costs. Specific advancements include the development of advanced packaging techniques and the integration of Ga2O3 transistors with other semiconductor devices to create more efficient power modules. The unique selling proposition of Ga2O3 transistors lies in their ability to handle higher voltages and currents at lower on-resistance compared to alternative technologies, resulting in significant efficiency gains and reduced energy losses.
Key Drivers, Barriers & Challenges in Gallium Oxide Power Transistors
Key Drivers: The primary drivers for market growth are the increasing demand for high-efficiency power electronics, driven by the proliferation of renewable energy sources and electric vehicles. Government regulations promoting energy efficiency and reducing carbon emissions are also contributing factors. Technological advancements such as improved material quality and manufacturing processes are making Ga2O3 transistors more competitive.
Key Challenges and Restraints: High manufacturing costs remain a major hurdle to wider adoption. The relatively nascent supply chain for Ga2O3 materials and devices also poses a challenge. Competition from mature silicon carbide and silicon technologies presents a significant barrier, particularly in lower-power applications. Furthermore, the limited availability of skilled labor in Ga2O3 device manufacturing slows down the industry's growth. These factors are expected to impact the market with approximately a xx% reduction in growth rate during the forecast period.
Emerging Opportunities in Gallium Oxide Power Transistors
Significant opportunities lie in emerging applications like data centers, industrial automation, and space exploration. The development of new device architectures, such as cascode and multi-chip modules, will lead to higher power densities and enhanced performance capabilities. Expanding into niche applications and exploring strategic partnerships with key players in end-user industries can unlock further market potential. The exploration of Ga2O3 in high-frequency applications, such as 5G infrastructure and millimeter-wave radar, represents a promising avenue for future growth.
Growth Accelerators in the Gallium Oxide Power Transistors Industry
Technological breakthroughs in Ga2O3 materials science, coupled with advancements in manufacturing processes, will accelerate growth. Strategic partnerships and collaborations among material suppliers, device manufacturers, and end-users will foster innovation and accelerate market penetration. Expanding into new geographical markets and investing in R&D to further enhance the performance of Ga2O3 power transistors are other factors driving long-term growth.
Key Players Shaping the Gallium Oxide Power Transistors Market
- Novel Crystal Technology
- FLOSFIA
- AIXTRON
- University of Buffalo
Notable Milestones in Gallium Oxide Power Transistors Sector
- 2020: Novel Crystal Technology announces the development of high-quality Ga2O3 single crystals.
- 2021: FLOSFIA launches its first commercial Ga2O3 power transistors.
- 2022: AIXTRON introduces a new MOCVD system optimized for Ga2O3 growth.
- 2023: University of Buffalo publishes research on advanced Ga2O3 device architectures.
In-Depth Gallium Oxide Power Transistors Market Outlook
The Gallium Oxide Power Transistors market is poised for substantial growth driven by technological advancements, increasing demand from key end-user sectors, and supportive government policies. Strategic investments in research and development, coupled with strategic partnerships, will further accelerate market penetration and expansion. The development of new applications and the continuous improvement of Ga2O3 material quality and device performance will unlock significant long-term opportunities. The market presents attractive prospects for investors and industry players seeking to capitalize on this rapidly growing segment of the power electronics industry.
Gallium Oxide Power Transistors Segmentation
-
1. Application
- 1.1. Telecom
- 1.2. Automobile
- 1.3. Aerospace
- 1.4. Energy
- 1.5. Other
-
2. Types
- 2.1. MOSFET
- 2.2. Other
Gallium Oxide Power Transistors Segmentation By Geography
-
1. North America
- 1.1. United States
- 1.2. Canada
- 1.3. Mexico
-
2. South America
- 2.1. Brazil
- 2.2. Argentina
- 2.3. Rest of South America
-
3. Europe
- 3.1. United Kingdom
- 3.2. Germany
- 3.3. France
- 3.4. Italy
- 3.5. Spain
- 3.6. Russia
- 3.7. Benelux
- 3.8. Nordics
- 3.9. Rest of Europe
-
4. Middle East & Africa
- 4.1. Turkey
- 4.2. Israel
- 4.3. GCC
- 4.4. North Africa
- 4.5. South Africa
- 4.6. Rest of Middle East & Africa
-
5. Asia Pacific
- 5.1. China
- 5.2. India
- 5.3. Japan
- 5.4. South Korea
- 5.5. ASEAN
- 5.6. Oceania
- 5.7. Rest of Asia Pacific
Gallium Oxide Power Transistors REPORT HIGHLIGHTS
| Aspects | Details |
|---|---|
| Study Period | 2019-2033 |
| Base Year | 2024 |
| Estimated Year | 2025 |
| Forecast Period | 2025-2033 |
| Historical Period | 2019-2024 |
| Growth Rate | CAGR of XX% from 2019-2033 |
| Segmentation |
|
Table of Contents
- 1. Introduction
- 1.1. Research Scope
- 1.2. Market Segmentation
- 1.3. Research Methodology
- 1.4. Definitions and Assumptions
- 2. Executive Summary
- 2.1. Introduction
- 3. Market Dynamics
- 3.1. Introduction
- 3.2. Market Drivers
- 3.3. Market Restrains
- 3.4. Market Trends
- 4. Market Factor Analysis
- 4.1. Porters Five Forces
- 4.2. Supply/Value Chain
- 4.3. PESTEL analysis
- 4.4. Market Entropy
- 4.5. Patent/Trademark Analysis
- 5. Global Gallium Oxide Power Transistors Analysis, Insights and Forecast, 2019-2031
- 5.1. Market Analysis, Insights and Forecast - by Application
- 5.1.1. Telecom
- 5.1.2. Automobile
- 5.1.3. Aerospace
- 5.1.4. Energy
- 5.1.5. Other
- 5.2. Market Analysis, Insights and Forecast - by Types
- 5.2.1. MOSFET
- 5.2.2. Other
- 5.3. Market Analysis, Insights and Forecast - by Region
- 5.3.1. North America
- 5.3.2. South America
- 5.3.3. Europe
- 5.3.4. Middle East & Africa
- 5.3.5. Asia Pacific
- 5.1. Market Analysis, Insights and Forecast - by Application
- 6. North America Gallium Oxide Power Transistors Analysis, Insights and Forecast, 2019-2031
- 6.1. Market Analysis, Insights and Forecast - by Application
- 6.1.1. Telecom
- 6.1.2. Automobile
- 6.1.3. Aerospace
- 6.1.4. Energy
- 6.1.5. Other
- 6.2. Market Analysis, Insights and Forecast - by Types
- 6.2.1. MOSFET
- 6.2.2. Other
- 6.1. Market Analysis, Insights and Forecast - by Application
- 7. South America Gallium Oxide Power Transistors Analysis, Insights and Forecast, 2019-2031
- 7.1. Market Analysis, Insights and Forecast - by Application
- 7.1.1. Telecom
- 7.1.2. Automobile
- 7.1.3. Aerospace
- 7.1.4. Energy
- 7.1.5. Other
- 7.2. Market Analysis, Insights and Forecast - by Types
- 7.2.1. MOSFET
- 7.2.2. Other
- 7.1. Market Analysis, Insights and Forecast - by Application
- 8. Europe Gallium Oxide Power Transistors Analysis, Insights and Forecast, 2019-2031
- 8.1. Market Analysis, Insights and Forecast - by Application
- 8.1.1. Telecom
- 8.1.2. Automobile
- 8.1.3. Aerospace
- 8.1.4. Energy
- 8.1.5. Other
- 8.2. Market Analysis, Insights and Forecast - by Types
- 8.2.1. MOSFET
- 8.2.2. Other
- 8.1. Market Analysis, Insights and Forecast - by Application
- 9. Middle East & Africa Gallium Oxide Power Transistors Analysis, Insights and Forecast, 2019-2031
- 9.1. Market Analysis, Insights and Forecast - by Application
- 9.1.1. Telecom
- 9.1.2. Automobile
- 9.1.3. Aerospace
- 9.1.4. Energy
- 9.1.5. Other
- 9.2. Market Analysis, Insights and Forecast - by Types
- 9.2.1. MOSFET
- 9.2.2. Other
- 9.1. Market Analysis, Insights and Forecast - by Application
- 10. Asia Pacific Gallium Oxide Power Transistors Analysis, Insights and Forecast, 2019-2031
- 10.1. Market Analysis, Insights and Forecast - by Application
- 10.1.1. Telecom
- 10.1.2. Automobile
- 10.1.3. Aerospace
- 10.1.4. Energy
- 10.1.5. Other
- 10.2. Market Analysis, Insights and Forecast - by Types
- 10.2.1. MOSFET
- 10.2.2. Other
- 10.1. Market Analysis, Insights and Forecast - by Application
- 11. Competitive Analysis
- 11.1. Global Market Share Analysis 2024
- 11.2. Company Profiles
- 11.2.1 Novel Crystal Technology
- 11.2.1.1. Overview
- 11.2.1.2. Products
- 11.2.1.3. SWOT Analysis
- 11.2.1.4. Recent Developments
- 11.2.1.5. Financials (Based on Availability)
- 11.2.2 FLOSFIA
- 11.2.2.1. Overview
- 11.2.2.2. Products
- 11.2.2.3. SWOT Analysis
- 11.2.2.4. Recent Developments
- 11.2.2.5. Financials (Based on Availability)
- 11.2.3 AIXTRON
- 11.2.3.1. Overview
- 11.2.3.2. Products
- 11.2.3.3. SWOT Analysis
- 11.2.3.4. Recent Developments
- 11.2.3.5. Financials (Based on Availability)
- 11.2.4 University of Buffalo
- 11.2.4.1. Overview
- 11.2.4.2. Products
- 11.2.4.3. SWOT Analysis
- 11.2.4.4. Recent Developments
- 11.2.4.5. Financials (Based on Availability)
- 11.2.1 Novel Crystal Technology
List of Figures
- Figure 1: Global Gallium Oxide Power Transistors Revenue Breakdown (million, %) by Region 2024 & 2032
- Figure 2: North America Gallium Oxide Power Transistors Revenue (million), by Application 2024 & 2032
- Figure 3: North America Gallium Oxide Power Transistors Revenue Share (%), by Application 2024 & 2032
- Figure 4: North America Gallium Oxide Power Transistors Revenue (million), by Types 2024 & 2032
- Figure 5: North America Gallium Oxide Power Transistors Revenue Share (%), by Types 2024 & 2032
- Figure 6: North America Gallium Oxide Power Transistors Revenue (million), by Country 2024 & 2032
- Figure 7: North America Gallium Oxide Power Transistors Revenue Share (%), by Country 2024 & 2032
- Figure 8: South America Gallium Oxide Power Transistors Revenue (million), by Application 2024 & 2032
- Figure 9: South America Gallium Oxide Power Transistors Revenue Share (%), by Application 2024 & 2032
- Figure 10: South America Gallium Oxide Power Transistors Revenue (million), by Types 2024 & 2032
- Figure 11: South America Gallium Oxide Power Transistors Revenue Share (%), by Types 2024 & 2032
- Figure 12: South America Gallium Oxide Power Transistors Revenue (million), by Country 2024 & 2032
- Figure 13: South America Gallium Oxide Power Transistors Revenue Share (%), by Country 2024 & 2032
- Figure 14: Europe Gallium Oxide Power Transistors Revenue (million), by Application 2024 & 2032
- Figure 15: Europe Gallium Oxide Power Transistors Revenue Share (%), by Application 2024 & 2032
- Figure 16: Europe Gallium Oxide Power Transistors Revenue (million), by Types 2024 & 2032
- Figure 17: Europe Gallium Oxide Power Transistors Revenue Share (%), by Types 2024 & 2032
- Figure 18: Europe Gallium Oxide Power Transistors Revenue (million), by Country 2024 & 2032
- Figure 19: Europe Gallium Oxide Power Transistors Revenue Share (%), by Country 2024 & 2032
- Figure 20: Middle East & Africa Gallium Oxide Power Transistors Revenue (million), by Application 2024 & 2032
- Figure 21: Middle East & Africa Gallium Oxide Power Transistors Revenue Share (%), by Application 2024 & 2032
- Figure 22: Middle East & Africa Gallium Oxide Power Transistors Revenue (million), by Types 2024 & 2032
- Figure 23: Middle East & Africa Gallium Oxide Power Transistors Revenue Share (%), by Types 2024 & 2032
- Figure 24: Middle East & Africa Gallium Oxide Power Transistors Revenue (million), by Country 2024 & 2032
- Figure 25: Middle East & Africa Gallium Oxide Power Transistors Revenue Share (%), by Country 2024 & 2032
- Figure 26: Asia Pacific Gallium Oxide Power Transistors Revenue (million), by Application 2024 & 2032
- Figure 27: Asia Pacific Gallium Oxide Power Transistors Revenue Share (%), by Application 2024 & 2032
- Figure 28: Asia Pacific Gallium Oxide Power Transistors Revenue (million), by Types 2024 & 2032
- Figure 29: Asia Pacific Gallium Oxide Power Transistors Revenue Share (%), by Types 2024 & 2032
- Figure 30: Asia Pacific Gallium Oxide Power Transistors Revenue (million), by Country 2024 & 2032
- Figure 31: Asia Pacific Gallium Oxide Power Transistors Revenue Share (%), by Country 2024 & 2032
List of Tables
- Table 1: Global Gallium Oxide Power Transistors Revenue million Forecast, by Region 2019 & 2032
- Table 2: Global Gallium Oxide Power Transistors Revenue million Forecast, by Application 2019 & 2032
- Table 3: Global Gallium Oxide Power Transistors Revenue million Forecast, by Types 2019 & 2032
- Table 4: Global Gallium Oxide Power Transistors Revenue million Forecast, by Region 2019 & 2032
- Table 5: Global Gallium Oxide Power Transistors Revenue million Forecast, by Application 2019 & 2032
- Table 6: Global Gallium Oxide Power Transistors Revenue million Forecast, by Types 2019 & 2032
- Table 7: Global Gallium Oxide Power Transistors Revenue million Forecast, by Country 2019 & 2032
- Table 8: United States Gallium Oxide Power Transistors Revenue (million) Forecast, by Application 2019 & 2032
- Table 9: Canada Gallium Oxide Power Transistors Revenue (million) Forecast, by Application 2019 & 2032
- Table 10: Mexico Gallium Oxide Power Transistors Revenue (million) Forecast, by Application 2019 & 2032
- Table 11: Global Gallium Oxide Power Transistors Revenue million Forecast, by Application 2019 & 2032
- Table 12: Global Gallium Oxide Power Transistors Revenue million Forecast, by Types 2019 & 2032
- Table 13: Global Gallium Oxide Power Transistors Revenue million Forecast, by Country 2019 & 2032
- Table 14: Brazil Gallium Oxide Power Transistors Revenue (million) Forecast, by Application 2019 & 2032
- Table 15: Argentina Gallium Oxide Power Transistors Revenue (million) Forecast, by Application 2019 & 2032
- Table 16: Rest of South America Gallium Oxide Power Transistors Revenue (million) Forecast, by Application 2019 & 2032
- Table 17: Global Gallium Oxide Power Transistors Revenue million Forecast, by Application 2019 & 2032
- Table 18: Global Gallium Oxide Power Transistors Revenue million Forecast, by Types 2019 & 2032
- Table 19: Global Gallium Oxide Power Transistors Revenue million Forecast, by Country 2019 & 2032
- Table 20: United Kingdom Gallium Oxide Power Transistors Revenue (million) Forecast, by Application 2019 & 2032
- Table 21: Germany Gallium Oxide Power Transistors Revenue (million) Forecast, by Application 2019 & 2032
- Table 22: France Gallium Oxide Power Transistors Revenue (million) Forecast, by Application 2019 & 2032
- Table 23: Italy Gallium Oxide Power Transistors Revenue (million) Forecast, by Application 2019 & 2032
- Table 24: Spain Gallium Oxide Power Transistors Revenue (million) Forecast, by Application 2019 & 2032
- Table 25: Russia Gallium Oxide Power Transistors Revenue (million) Forecast, by Application 2019 & 2032
- Table 26: Benelux Gallium Oxide Power Transistors Revenue (million) Forecast, by Application 2019 & 2032
- Table 27: Nordics Gallium Oxide Power Transistors Revenue (million) Forecast, by Application 2019 & 2032
- Table 28: Rest of Europe Gallium Oxide Power Transistors Revenue (million) Forecast, by Application 2019 & 2032
- Table 29: Global Gallium Oxide Power Transistors Revenue million Forecast, by Application 2019 & 2032
- Table 30: Global Gallium Oxide Power Transistors Revenue million Forecast, by Types 2019 & 2032
- Table 31: Global Gallium Oxide Power Transistors Revenue million Forecast, by Country 2019 & 2032
- Table 32: Turkey Gallium Oxide Power Transistors Revenue (million) Forecast, by Application 2019 & 2032
- Table 33: Israel Gallium Oxide Power Transistors Revenue (million) Forecast, by Application 2019 & 2032
- Table 34: GCC Gallium Oxide Power Transistors Revenue (million) Forecast, by Application 2019 & 2032
- Table 35: North Africa Gallium Oxide Power Transistors Revenue (million) Forecast, by Application 2019 & 2032
- Table 36: South Africa Gallium Oxide Power Transistors Revenue (million) Forecast, by Application 2019 & 2032
- Table 37: Rest of Middle East & Africa Gallium Oxide Power Transistors Revenue (million) Forecast, by Application 2019 & 2032
- Table 38: Global Gallium Oxide Power Transistors Revenue million Forecast, by Application 2019 & 2032
- Table 39: Global Gallium Oxide Power Transistors Revenue million Forecast, by Types 2019 & 2032
- Table 40: Global Gallium Oxide Power Transistors Revenue million Forecast, by Country 2019 & 2032
- Table 41: China Gallium Oxide Power Transistors Revenue (million) Forecast, by Application 2019 & 2032
- Table 42: India Gallium Oxide Power Transistors Revenue (million) Forecast, by Application 2019 & 2032
- Table 43: Japan Gallium Oxide Power Transistors Revenue (million) Forecast, by Application 2019 & 2032
- Table 44: South Korea Gallium Oxide Power Transistors Revenue (million) Forecast, by Application 2019 & 2032
- Table 45: ASEAN Gallium Oxide Power Transistors Revenue (million) Forecast, by Application 2019 & 2032
- Table 46: Oceania Gallium Oxide Power Transistors Revenue (million) Forecast, by Application 2019 & 2032
- Table 47: Rest of Asia Pacific Gallium Oxide Power Transistors Revenue (million) Forecast, by Application 2019 & 2032
Frequently Asked Questions
1. What is the projected Compound Annual Growth Rate (CAGR) of the Gallium Oxide Power Transistors?
The projected CAGR is approximately XX%.
2. Which companies are prominent players in the Gallium Oxide Power Transistors?
Key companies in the market include Novel Crystal Technology, FLOSFIA, AIXTRON, University of Buffalo.
3. What are the main segments of the Gallium Oxide Power Transistors?
The market segments include Application, Types.
4. Can you provide details about the market size?
The market size is estimated to be USD XXX million as of 2022.
5. What are some drivers contributing to market growth?
N/A
6. What are the notable trends driving market growth?
N/A
7. Are there any restraints impacting market growth?
N/A
8. Can you provide examples of recent developments in the market?
N/A
9. What pricing options are available for accessing the report?
Pricing options include single-user, multi-user, and enterprise licenses priced at USD 4900.00, USD 7350.00, and USD 9800.00 respectively.
10. Is the market size provided in terms of value or volume?
The market size is provided in terms of value, measured in million.
11. Are there any specific market keywords associated with the report?
Yes, the market keyword associated with the report is "Gallium Oxide Power Transistors," which aids in identifying and referencing the specific market segment covered.
12. How do I determine which pricing option suits my needs best?
The pricing options vary based on user requirements and access needs. Individual users may opt for single-user licenses, while businesses requiring broader access may choose multi-user or enterprise licenses for cost-effective access to the report.
13. Are there any additional resources or data provided in the Gallium Oxide Power Transistors report?
While the report offers comprehensive insights, it's advisable to review the specific contents or supplementary materials provided to ascertain if additional resources or data are available.
14. How can I stay updated on further developments or reports in the Gallium Oxide Power Transistors?
To stay informed about further developments, trends, and reports in the Gallium Oxide Power Transistors, consider subscribing to industry newsletters, following relevant companies and organizations, or regularly checking reputable industry news sources and publications.
Methodology
Step 1 - Identification of Relevant Samples Size from Population Database


Step 2 - Approaches for Defining Global Market Size (Value, Volume* & Price*)

Note*: In applicable scenarios
Step 3 - Data Sources
Primary Research
- Web Analytics
- Survey Reports
- Research Institute
- Latest Research Reports
- Opinion Leaders
Secondary Research
- Annual Reports
- White Paper
- Latest Press Release
- Industry Association
- Paid Database
- Investor Presentations

Step 4 - Data Triangulation
Involves using different sources of information in order to increase the validity of a study
These sources are likely to be stakeholders in a program - participants, other researchers, program staff, other community members, and so on.
Then we put all data in single framework & apply various statistical tools to find out the dynamic on the market.
During the analysis stage, feedback from the stakeholder groups would be compared to determine areas of agreement as well as areas of divergence
