

Key Insights
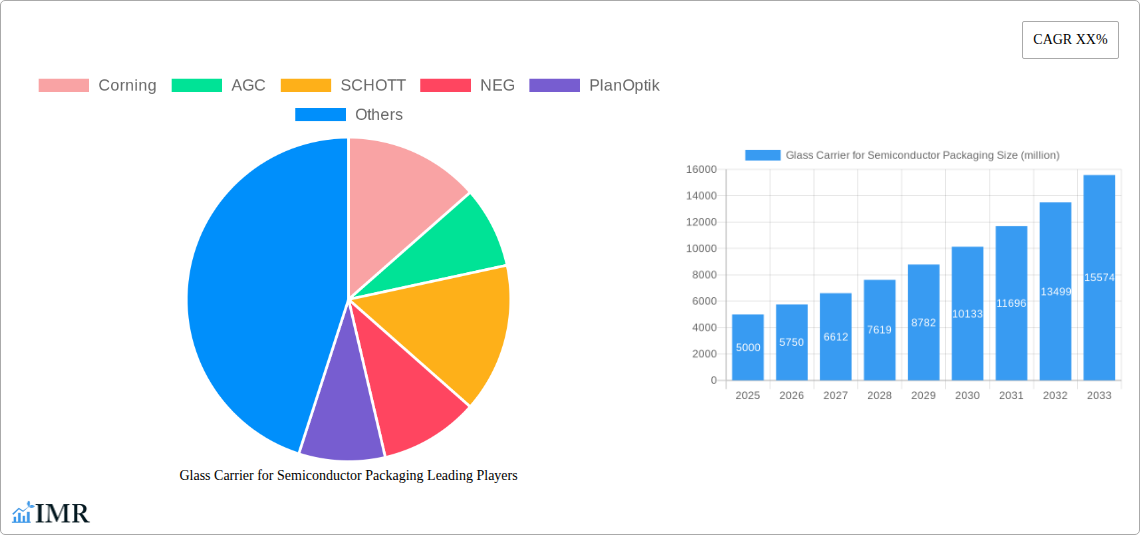
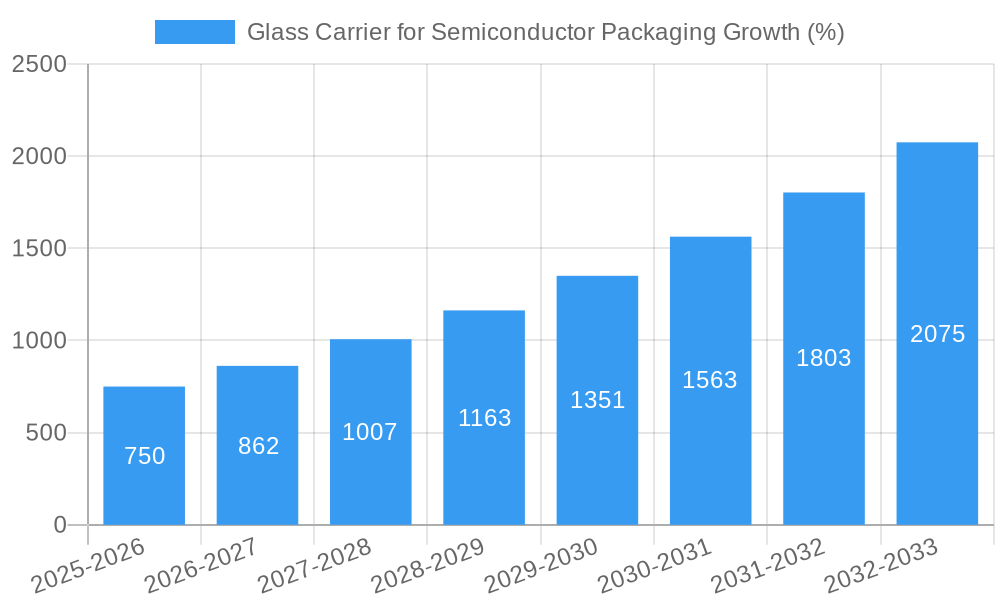
The global market for glass carriers used in semiconductor packaging is experiencing robust growth, driven by the increasing demand for advanced semiconductor devices in various applications, including 5G infrastructure, high-performance computing (HPC), and artificial intelligence (AI). The market is estimated at $5 billion in 2025, with a Compound Annual Growth Rate (CAGR) of approximately 15% projected from 2025 to 2033. This expansion is fueled by several key factors. Firstly, the ongoing miniaturization of semiconductor chips necessitates the use of highly precise and robust glass carriers to protect delicate components during the intricate packaging process. Secondly, the rise of advanced packaging techniques, such as 3D stacking and system-in-package (SiP), further increases the demand for specialized glass carriers capable of supporting complex chip architectures. Finally, the growing adoption of silicon carbide (SiC) and gallium nitride (GaN) based power semiconductors, which require high-temperature processing, is also driving the adoption of specialized, high-temperature resistant glass carriers. Key players like Corning, AGC, SCHOTT, NEG, PlanOptik, and Tecnisco are actively involved in developing innovative glass carrier solutions to meet these evolving needs, resulting in a competitive yet dynamic market landscape.
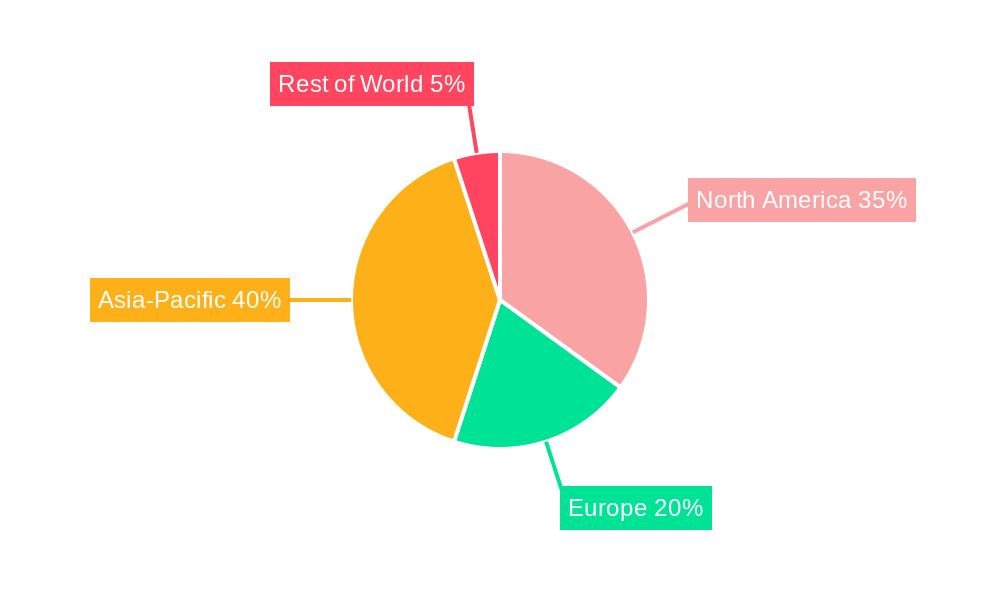
The market segmentation includes various types of glass carriers based on material composition (e.g., borosilicate glass, fused silica), size, and application. Regional variations are expected, with North America and Asia-Pacific likely dominating the market due to the presence of significant semiconductor manufacturing hubs. However, Europe and other regions are also anticipated to witness notable growth, driven by the expanding electronics industry and government initiatives supporting advanced semiconductor technology. Despite the promising outlook, potential restraints include fluctuations in raw material prices and the complexities involved in manufacturing high-precision glass carriers. Nevertheless, the overall trajectory indicates a sustained period of growth driven by the insatiable demand for advanced semiconductor solutions across numerous applications.
Glass Carrier for Semiconductor Packaging Market Report: 2019-2033
This comprehensive report provides an in-depth analysis of the Glass Carrier for Semiconductor Packaging market, encompassing market dynamics, growth trends, regional dominance, product landscape, key players, and future outlook. The study period spans from 2019 to 2033, with 2025 serving as the base and estimated year. This report is crucial for semiconductor manufacturers, material suppliers, investors, and industry professionals seeking to navigate this rapidly evolving market. The parent market is the Semiconductor Packaging industry, and the child market is Glass Carrier materials specifically. The report projects a market size of xx million units by 2033.
Glass Carrier for Semiconductor Packaging Market Dynamics & Structure
This section analyzes the competitive landscape, technological advancements, and regulatory influences shaping the Glass Carrier for Semiconductor Packaging market. We examine market concentration, identifying key players and their market share, and explore the impact of mergers and acquisitions (M&A) activities. Technological innovation, including advancements in material science and manufacturing processes, are detailed, alongside an examination of regulatory frameworks impacting production and market access. The report also investigates the presence of substitute materials and their impact on market dynamics.
- Market Concentration: Highly concentrated market with top 5 players holding xx% market share in 2024.
- Technological Innovation: Advancements in low-temperature co-fired ceramics (LTCC) and other high-precision glass carrier technologies are driving growth.
- Regulatory Landscape: Stringent environmental regulations are influencing material choices and manufacturing processes.
- Competitive Substitutes: Competition from alternative packaging materials like polymers and plastics is analyzed.
- M&A Activity: xx M&A deals were recorded between 2019 and 2024, primarily focused on expanding production capacity and acquiring specialized technologies. The average deal size was approximately xx million USD.
- End-User Demographics: The report details the distribution of end-users across various semiconductor applications, such as memory, logic, and analog devices.
Glass Carrier for Semiconductor Packaging Growth Trends & Insights
This section provides a detailed analysis of market size evolution, adoption rates, and technological disruptions from 2019 to 2033. We leverage proprietary data and industry expertise to project future market growth, highlighting key trends such as increased adoption of advanced packaging technologies and the rising demand for high-performance computing (HPC) and 5G infrastructure. The report also analyzes consumer behavior shifts and their impact on market demand, including shifts towards miniaturization and higher integration density.
- Market Size: The market grew from xx million units in 2019 to xx million units in 2024, with a CAGR of xx%. The report projects a market size of xx million units by 2033, driven by xx.
- Adoption Rates: Adoption of advanced glass carrier technologies, particularly for xx applications, is increasing rapidly.
- Technological Disruptions: The emergence of new materials and manufacturing techniques is analyzed for their potential to disrupt the market.
- Consumer Behavior Shifts: The increasing demand for smaller, faster, and more power-efficient devices is driving the need for innovative glass carrier solutions.
Dominant Regions, Countries, or Segments in Glass Carrier for Semiconductor Packaging
This section identifies the leading regions and segments driving market growth. We analyze regional market dynamics, focusing on key factors contributing to dominance, such as favorable economic policies, robust infrastructure, and a strong presence of semiconductor manufacturers. The report offers a detailed assessment of market share and growth potential for each region.
- Dominant Region: Asia-Pacific is projected to maintain its dominance throughout the forecast period due to its large concentration of semiconductor manufacturing facilities and strong government support for technological advancements.
- Key Drivers (Asia-Pacific): Government initiatives promoting semiconductor manufacturing, expanding 5G infrastructure, and a robust ecosystem of component suppliers.
- Market Share: Asia-Pacific is expected to hold over xx% market share in 2033.
- Growth Potential: Emerging economies within Asia-Pacific offer significant growth potential due to increasing demand for consumer electronics.
Glass Carrier for Semiconductor Packaging Product Landscape
This section details the current product landscape, highlighting key innovations, applications, and performance metrics of various glass carriers. The advancements in material composition, precision manufacturing, and surface treatments are discussed, along with their impact on the performance and cost-effectiveness of the final products. Unique selling propositions (USPs) of different glass carriers are analyzed based on size, thermal conductivity, and other critical factors.
The market offers a variety of glass carriers, ranging from standard designs to highly customized solutions optimized for specific applications. Innovations in material science are enabling the development of glass carriers with improved thermal conductivity and dimensional stability, crucial for advanced semiconductor packaging. These advancements are enabling higher integration densities and improved device performance.
Key Drivers, Barriers & Challenges in Glass Carrier for Semiconductor Packaging
This section explores the key factors driving market growth and the challenges hindering its expansion.
Key Drivers:
- Increasing demand for advanced semiconductor packaging solutions.
- Technological advancements in glass carrier manufacturing.
- Rising adoption of 5G and HPC technologies.
Key Challenges and Restraints:
- High manufacturing costs associated with precision glass carriers.
- Supply chain disruptions impacting raw material availability and production timelines.
- Intense competition from alternative packaging materials.
Emerging Opportunities in Glass Carrier for Semiconductor Packaging
This section highlights promising avenues for market expansion, including untapped markets, innovative applications, and evolving consumer preferences.
- Expansion into emerging markets with growing semiconductor industries.
- Development of specialized glass carriers for niche applications, such as automotive electronics.
- Exploring sustainable manufacturing practices and environmentally friendly materials.
Growth Accelerators in the Glass Carrier for Semiconductor Packaging Industry
Long-term market growth will be driven by technological breakthroughs in glass material science and advanced manufacturing processes. Strategic partnerships between glass manufacturers and semiconductor companies will play a pivotal role in driving innovation and market expansion. Furthermore, government initiatives promoting semiconductor manufacturing and advanced packaging technologies will stimulate growth.
Key Players Shaping the Glass Carrier for Semiconductor Packaging Market
Notable Milestones in Glass Carrier for Semiconductor Packaging Sector
- 2020, Q4: Corning launched a new generation of glass carriers with enhanced thermal conductivity.
- 2022, Q2: AGC and SCHOTT announced a joint venture to expand glass carrier production capacity.
- 2023, Q1: NEG introduced a new ultra-thin glass carrier for high-density packaging.
In-Depth Glass Carrier for Semiconductor Packaging Market Outlook
The Glass Carrier for Semiconductor Packaging market is poised for significant growth over the next decade, driven by technological advancements, increasing demand for high-performance electronics, and strategic partnerships within the industry. Opportunities exist for companies to develop innovative glass carrier solutions tailored to specific applications and explore emerging markets. This presents lucrative opportunities for market expansion and leadership positions for companies who embrace technological advancements and strategic alliances.
Glass Carrier for Semiconductor Packaging Segmentation
-
1. Application
- 1.1. CMOS Image Sensors
- 1.2. FOWLP
- 1.3. MEMS
- 1.4. Other
-
2. Types
- 2.1. 4.9 - 7.9 CTEs
- 2.2. 9.6 - 12.6 CTEs
- 2.3. Other
Glass Carrier for Semiconductor Packaging Segmentation By Geography
-
1. North America
- 1.1. United States
- 1.2. Canada
- 1.3. Mexico
-
2. South America
- 2.1. Brazil
- 2.2. Argentina
- 2.3. Rest of South America
-
3. Europe
- 3.1. United Kingdom
- 3.2. Germany
- 3.3. France
- 3.4. Italy
- 3.5. Spain
- 3.6. Russia
- 3.7. Benelux
- 3.8. Nordics
- 3.9. Rest of Europe
-
4. Middle East & Africa
- 4.1. Turkey
- 4.2. Israel
- 4.3. GCC
- 4.4. North Africa
- 4.5. South Africa
- 4.6. Rest of Middle East & Africa
-
5. Asia Pacific
- 5.1. China
- 5.2. India
- 5.3. Japan
- 5.4. South Korea
- 5.5. ASEAN
- 5.6. Oceania
- 5.7. Rest of Asia Pacific
Glass Carrier for Semiconductor Packaging REPORT HIGHLIGHTS
| Aspects | Details |
|---|---|
| Study Period | 2019-2033 |
| Base Year | 2024 |
| Estimated Year | 2025 |
| Forecast Period | 2025-2033 |
| Historical Period | 2019-2024 |
| Growth Rate | CAGR of XX% from 2019-2033 |
| Segmentation |
|
Table of Contents
- 1. Introduction
- 1.1. Research Scope
- 1.2. Market Segmentation
- 1.3. Research Methodology
- 1.4. Definitions and Assumptions
- 2. Executive Summary
- 2.1. Introduction
- 3. Market Dynamics
- 3.1. Introduction
- 3.2. Market Drivers
- 3.3. Market Restrains
- 3.4. Market Trends
- 4. Market Factor Analysis
- 4.1. Porters Five Forces
- 4.2. Supply/Value Chain
- 4.3. PESTEL analysis
- 4.4. Market Entropy
- 4.5. Patent/Trademark Analysis
- 5. Global Glass Carrier for Semiconductor Packaging Analysis, Insights and Forecast, 2019-2031
- 5.1. Market Analysis, Insights and Forecast - by Application
- 5.1.1. CMOS Image Sensors
- 5.1.2. FOWLP
- 5.1.3. MEMS
- 5.1.4. Other
- 5.2. Market Analysis, Insights and Forecast - by Types
- 5.2.1. 4.9 - 7.9 CTEs
- 5.2.2. 9.6 - 12.6 CTEs
- 5.2.3. Other
- 5.3. Market Analysis, Insights and Forecast - by Region
- 5.3.1. North America
- 5.3.2. South America
- 5.3.3. Europe
- 5.3.4. Middle East & Africa
- 5.3.5. Asia Pacific
- 5.1. Market Analysis, Insights and Forecast - by Application
- 6. North America Glass Carrier for Semiconductor Packaging Analysis, Insights and Forecast, 2019-2031
- 6.1. Market Analysis, Insights and Forecast - by Application
- 6.1.1. CMOS Image Sensors
- 6.1.2. FOWLP
- 6.1.3. MEMS
- 6.1.4. Other
- 6.2. Market Analysis, Insights and Forecast - by Types
- 6.2.1. 4.9 - 7.9 CTEs
- 6.2.2. 9.6 - 12.6 CTEs
- 6.2.3. Other
- 6.1. Market Analysis, Insights and Forecast - by Application
- 7. South America Glass Carrier for Semiconductor Packaging Analysis, Insights and Forecast, 2019-2031
- 7.1. Market Analysis, Insights and Forecast - by Application
- 7.1.1. CMOS Image Sensors
- 7.1.2. FOWLP
- 7.1.3. MEMS
- 7.1.4. Other
- 7.2. Market Analysis, Insights and Forecast - by Types
- 7.2.1. 4.9 - 7.9 CTEs
- 7.2.2. 9.6 - 12.6 CTEs
- 7.2.3. Other
- 7.1. Market Analysis, Insights and Forecast - by Application
- 8. Europe Glass Carrier for Semiconductor Packaging Analysis, Insights and Forecast, 2019-2031
- 8.1. Market Analysis, Insights and Forecast - by Application
- 8.1.1. CMOS Image Sensors
- 8.1.2. FOWLP
- 8.1.3. MEMS
- 8.1.4. Other
- 8.2. Market Analysis, Insights and Forecast - by Types
- 8.2.1. 4.9 - 7.9 CTEs
- 8.2.2. 9.6 - 12.6 CTEs
- 8.2.3. Other
- 8.1. Market Analysis, Insights and Forecast - by Application
- 9. Middle East & Africa Glass Carrier for Semiconductor Packaging Analysis, Insights and Forecast, 2019-2031
- 9.1. Market Analysis, Insights and Forecast - by Application
- 9.1.1. CMOS Image Sensors
- 9.1.2. FOWLP
- 9.1.3. MEMS
- 9.1.4. Other
- 9.2. Market Analysis, Insights and Forecast - by Types
- 9.2.1. 4.9 - 7.9 CTEs
- 9.2.2. 9.6 - 12.6 CTEs
- 9.2.3. Other
- 9.1. Market Analysis, Insights and Forecast - by Application
- 10. Asia Pacific Glass Carrier for Semiconductor Packaging Analysis, Insights and Forecast, 2019-2031
- 10.1. Market Analysis, Insights and Forecast - by Application
- 10.1.1. CMOS Image Sensors
- 10.1.2. FOWLP
- 10.1.3. MEMS
- 10.1.4. Other
- 10.2. Market Analysis, Insights and Forecast - by Types
- 10.2.1. 4.9 - 7.9 CTEs
- 10.2.2. 9.6 - 12.6 CTEs
- 10.2.3. Other
- 10.1. Market Analysis, Insights and Forecast - by Application
- 11. Competitive Analysis
- 11.1. Global Market Share Analysis 2024
- 11.2. Company Profiles
- 11.2.1 Corning
- 11.2.1.1. Overview
- 11.2.1.2. Products
- 11.2.1.3. SWOT Analysis
- 11.2.1.4. Recent Developments
- 11.2.1.5. Financials (Based on Availability)
- 11.2.2 AGC
- 11.2.2.1. Overview
- 11.2.2.2. Products
- 11.2.2.3. SWOT Analysis
- 11.2.2.4. Recent Developments
- 11.2.2.5. Financials (Based on Availability)
- 11.2.3 SCHOTT
- 11.2.3.1. Overview
- 11.2.3.2. Products
- 11.2.3.3. SWOT Analysis
- 11.2.3.4. Recent Developments
- 11.2.3.5. Financials (Based on Availability)
- 11.2.4 NEG
- 11.2.4.1. Overview
- 11.2.4.2. Products
- 11.2.4.3. SWOT Analysis
- 11.2.4.4. Recent Developments
- 11.2.4.5. Financials (Based on Availability)
- 11.2.5 PlanOptik
- 11.2.5.1. Overview
- 11.2.5.2. Products
- 11.2.5.3. SWOT Analysis
- 11.2.5.4. Recent Developments
- 11.2.5.5. Financials (Based on Availability)
- 11.2.6 Tecnisco
- 11.2.6.1. Overview
- 11.2.6.2. Products
- 11.2.6.3. SWOT Analysis
- 11.2.6.4. Recent Developments
- 11.2.6.5. Financials (Based on Availability)
- 11.2.1 Corning
List of Figures
- Figure 1: Global Glass Carrier for Semiconductor Packaging Revenue Breakdown (million, %) by Region 2024 & 2032
- Figure 2: Global Glass Carrier for Semiconductor Packaging Volume Breakdown (K, %) by Region 2024 & 2032
- Figure 3: North America Glass Carrier for Semiconductor Packaging Revenue (million), by Application 2024 & 2032
- Figure 4: North America Glass Carrier for Semiconductor Packaging Volume (K), by Application 2024 & 2032
- Figure 5: North America Glass Carrier for Semiconductor Packaging Revenue Share (%), by Application 2024 & 2032
- Figure 6: North America Glass Carrier for Semiconductor Packaging Volume Share (%), by Application 2024 & 2032
- Figure 7: North America Glass Carrier for Semiconductor Packaging Revenue (million), by Types 2024 & 2032
- Figure 8: North America Glass Carrier for Semiconductor Packaging Volume (K), by Types 2024 & 2032
- Figure 9: North America Glass Carrier for Semiconductor Packaging Revenue Share (%), by Types 2024 & 2032
- Figure 10: North America Glass Carrier for Semiconductor Packaging Volume Share (%), by Types 2024 & 2032
- Figure 11: North America Glass Carrier for Semiconductor Packaging Revenue (million), by Country 2024 & 2032
- Figure 12: North America Glass Carrier for Semiconductor Packaging Volume (K), by Country 2024 & 2032
- Figure 13: North America Glass Carrier for Semiconductor Packaging Revenue Share (%), by Country 2024 & 2032
- Figure 14: North America Glass Carrier for Semiconductor Packaging Volume Share (%), by Country 2024 & 2032
- Figure 15: South America Glass Carrier for Semiconductor Packaging Revenue (million), by Application 2024 & 2032
- Figure 16: South America Glass Carrier for Semiconductor Packaging Volume (K), by Application 2024 & 2032
- Figure 17: South America Glass Carrier for Semiconductor Packaging Revenue Share (%), by Application 2024 & 2032
- Figure 18: South America Glass Carrier for Semiconductor Packaging Volume Share (%), by Application 2024 & 2032
- Figure 19: South America Glass Carrier for Semiconductor Packaging Revenue (million), by Types 2024 & 2032
- Figure 20: South America Glass Carrier for Semiconductor Packaging Volume (K), by Types 2024 & 2032
- Figure 21: South America Glass Carrier for Semiconductor Packaging Revenue Share (%), by Types 2024 & 2032
- Figure 22: South America Glass Carrier for Semiconductor Packaging Volume Share (%), by Types 2024 & 2032
- Figure 23: South America Glass Carrier for Semiconductor Packaging Revenue (million), by Country 2024 & 2032
- Figure 24: South America Glass Carrier for Semiconductor Packaging Volume (K), by Country 2024 & 2032
- Figure 25: South America Glass Carrier for Semiconductor Packaging Revenue Share (%), by Country 2024 & 2032
- Figure 26: South America Glass Carrier for Semiconductor Packaging Volume Share (%), by Country 2024 & 2032
- Figure 27: Europe Glass Carrier for Semiconductor Packaging Revenue (million), by Application 2024 & 2032
- Figure 28: Europe Glass Carrier for Semiconductor Packaging Volume (K), by Application 2024 & 2032
- Figure 29: Europe Glass Carrier for Semiconductor Packaging Revenue Share (%), by Application 2024 & 2032
- Figure 30: Europe Glass Carrier for Semiconductor Packaging Volume Share (%), by Application 2024 & 2032
- Figure 31: Europe Glass Carrier for Semiconductor Packaging Revenue (million), by Types 2024 & 2032
- Figure 32: Europe Glass Carrier for Semiconductor Packaging Volume (K), by Types 2024 & 2032
- Figure 33: Europe Glass Carrier for Semiconductor Packaging Revenue Share (%), by Types 2024 & 2032
- Figure 34: Europe Glass Carrier for Semiconductor Packaging Volume Share (%), by Types 2024 & 2032
- Figure 35: Europe Glass Carrier for Semiconductor Packaging Revenue (million), by Country 2024 & 2032
- Figure 36: Europe Glass Carrier for Semiconductor Packaging Volume (K), by Country 2024 & 2032
- Figure 37: Europe Glass Carrier for Semiconductor Packaging Revenue Share (%), by Country 2024 & 2032
- Figure 38: Europe Glass Carrier for Semiconductor Packaging Volume Share (%), by Country 2024 & 2032
- Figure 39: Middle East & Africa Glass Carrier for Semiconductor Packaging Revenue (million), by Application 2024 & 2032
- Figure 40: Middle East & Africa Glass Carrier for Semiconductor Packaging Volume (K), by Application 2024 & 2032
- Figure 41: Middle East & Africa Glass Carrier for Semiconductor Packaging Revenue Share (%), by Application 2024 & 2032
- Figure 42: Middle East & Africa Glass Carrier for Semiconductor Packaging Volume Share (%), by Application 2024 & 2032
- Figure 43: Middle East & Africa Glass Carrier for Semiconductor Packaging Revenue (million), by Types 2024 & 2032
- Figure 44: Middle East & Africa Glass Carrier for Semiconductor Packaging Volume (K), by Types 2024 & 2032
- Figure 45: Middle East & Africa Glass Carrier for Semiconductor Packaging Revenue Share (%), by Types 2024 & 2032
- Figure 46: Middle East & Africa Glass Carrier for Semiconductor Packaging Volume Share (%), by Types 2024 & 2032
- Figure 47: Middle East & Africa Glass Carrier for Semiconductor Packaging Revenue (million), by Country 2024 & 2032
- Figure 48: Middle East & Africa Glass Carrier for Semiconductor Packaging Volume (K), by Country 2024 & 2032
- Figure 49: Middle East & Africa Glass Carrier for Semiconductor Packaging Revenue Share (%), by Country 2024 & 2032
- Figure 50: Middle East & Africa Glass Carrier for Semiconductor Packaging Volume Share (%), by Country 2024 & 2032
- Figure 51: Asia Pacific Glass Carrier for Semiconductor Packaging Revenue (million), by Application 2024 & 2032
- Figure 52: Asia Pacific Glass Carrier for Semiconductor Packaging Volume (K), by Application 2024 & 2032
- Figure 53: Asia Pacific Glass Carrier for Semiconductor Packaging Revenue Share (%), by Application 2024 & 2032
- Figure 54: Asia Pacific Glass Carrier for Semiconductor Packaging Volume Share (%), by Application 2024 & 2032
- Figure 55: Asia Pacific Glass Carrier for Semiconductor Packaging Revenue (million), by Types 2024 & 2032
- Figure 56: Asia Pacific Glass Carrier for Semiconductor Packaging Volume (K), by Types 2024 & 2032
- Figure 57: Asia Pacific Glass Carrier for Semiconductor Packaging Revenue Share (%), by Types 2024 & 2032
- Figure 58: Asia Pacific Glass Carrier for Semiconductor Packaging Volume Share (%), by Types 2024 & 2032
- Figure 59: Asia Pacific Glass Carrier for Semiconductor Packaging Revenue (million), by Country 2024 & 2032
- Figure 60: Asia Pacific Glass Carrier for Semiconductor Packaging Volume (K), by Country 2024 & 2032
- Figure 61: Asia Pacific Glass Carrier for Semiconductor Packaging Revenue Share (%), by Country 2024 & 2032
- Figure 62: Asia Pacific Glass Carrier for Semiconductor Packaging Volume Share (%), by Country 2024 & 2032
List of Tables
- Table 1: Global Glass Carrier for Semiconductor Packaging Revenue million Forecast, by Region 2019 & 2032
- Table 2: Global Glass Carrier for Semiconductor Packaging Volume K Forecast, by Region 2019 & 2032
- Table 3: Global Glass Carrier for Semiconductor Packaging Revenue million Forecast, by Application 2019 & 2032
- Table 4: Global Glass Carrier for Semiconductor Packaging Volume K Forecast, by Application 2019 & 2032
- Table 5: Global Glass Carrier for Semiconductor Packaging Revenue million Forecast, by Types 2019 & 2032
- Table 6: Global Glass Carrier for Semiconductor Packaging Volume K Forecast, by Types 2019 & 2032
- Table 7: Global Glass Carrier for Semiconductor Packaging Revenue million Forecast, by Region 2019 & 2032
- Table 8: Global Glass Carrier for Semiconductor Packaging Volume K Forecast, by Region 2019 & 2032
- Table 9: Global Glass Carrier for Semiconductor Packaging Revenue million Forecast, by Application 2019 & 2032
- Table 10: Global Glass Carrier for Semiconductor Packaging Volume K Forecast, by Application 2019 & 2032
- Table 11: Global Glass Carrier for Semiconductor Packaging Revenue million Forecast, by Types 2019 & 2032
- Table 12: Global Glass Carrier for Semiconductor Packaging Volume K Forecast, by Types 2019 & 2032
- Table 13: Global Glass Carrier for Semiconductor Packaging Revenue million Forecast, by Country 2019 & 2032
- Table 14: Global Glass Carrier for Semiconductor Packaging Volume K Forecast, by Country 2019 & 2032
- Table 15: United States Glass Carrier for Semiconductor Packaging Revenue (million) Forecast, by Application 2019 & 2032
- Table 16: United States Glass Carrier for Semiconductor Packaging Volume (K) Forecast, by Application 2019 & 2032
- Table 17: Canada Glass Carrier for Semiconductor Packaging Revenue (million) Forecast, by Application 2019 & 2032
- Table 18: Canada Glass Carrier for Semiconductor Packaging Volume (K) Forecast, by Application 2019 & 2032
- Table 19: Mexico Glass Carrier for Semiconductor Packaging Revenue (million) Forecast, by Application 2019 & 2032
- Table 20: Mexico Glass Carrier for Semiconductor Packaging Volume (K) Forecast, by Application 2019 & 2032
- Table 21: Global Glass Carrier for Semiconductor Packaging Revenue million Forecast, by Application 2019 & 2032
- Table 22: Global Glass Carrier for Semiconductor Packaging Volume K Forecast, by Application 2019 & 2032
- Table 23: Global Glass Carrier for Semiconductor Packaging Revenue million Forecast, by Types 2019 & 2032
- Table 24: Global Glass Carrier for Semiconductor Packaging Volume K Forecast, by Types 2019 & 2032
- Table 25: Global Glass Carrier for Semiconductor Packaging Revenue million Forecast, by Country 2019 & 2032
- Table 26: Global Glass Carrier for Semiconductor Packaging Volume K Forecast, by Country 2019 & 2032
- Table 27: Brazil Glass Carrier for Semiconductor Packaging Revenue (million) Forecast, by Application 2019 & 2032
- Table 28: Brazil Glass Carrier for Semiconductor Packaging Volume (K) Forecast, by Application 2019 & 2032
- Table 29: Argentina Glass Carrier for Semiconductor Packaging Revenue (million) Forecast, by Application 2019 & 2032
- Table 30: Argentina Glass Carrier for Semiconductor Packaging Volume (K) Forecast, by Application 2019 & 2032
- Table 31: Rest of South America Glass Carrier for Semiconductor Packaging Revenue (million) Forecast, by Application 2019 & 2032
- Table 32: Rest of South America Glass Carrier for Semiconductor Packaging Volume (K) Forecast, by Application 2019 & 2032
- Table 33: Global Glass Carrier for Semiconductor Packaging Revenue million Forecast, by Application 2019 & 2032
- Table 34: Global Glass Carrier for Semiconductor Packaging Volume K Forecast, by Application 2019 & 2032
- Table 35: Global Glass Carrier for Semiconductor Packaging Revenue million Forecast, by Types 2019 & 2032
- Table 36: Global Glass Carrier for Semiconductor Packaging Volume K Forecast, by Types 2019 & 2032
- Table 37: Global Glass Carrier for Semiconductor Packaging Revenue million Forecast, by Country 2019 & 2032
- Table 38: Global Glass Carrier for Semiconductor Packaging Volume K Forecast, by Country 2019 & 2032
- Table 39: United Kingdom Glass Carrier for Semiconductor Packaging Revenue (million) Forecast, by Application 2019 & 2032
- Table 40: United Kingdom Glass Carrier for Semiconductor Packaging Volume (K) Forecast, by Application 2019 & 2032
- Table 41: Germany Glass Carrier for Semiconductor Packaging Revenue (million) Forecast, by Application 2019 & 2032
- Table 42: Germany Glass Carrier for Semiconductor Packaging Volume (K) Forecast, by Application 2019 & 2032
- Table 43: France Glass Carrier for Semiconductor Packaging Revenue (million) Forecast, by Application 2019 & 2032
- Table 44: France Glass Carrier for Semiconductor Packaging Volume (K) Forecast, by Application 2019 & 2032
- Table 45: Italy Glass Carrier for Semiconductor Packaging Revenue (million) Forecast, by Application 2019 & 2032
- Table 46: Italy Glass Carrier for Semiconductor Packaging Volume (K) Forecast, by Application 2019 & 2032
- Table 47: Spain Glass Carrier for Semiconductor Packaging Revenue (million) Forecast, by Application 2019 & 2032
- Table 48: Spain Glass Carrier for Semiconductor Packaging Volume (K) Forecast, by Application 2019 & 2032
- Table 49: Russia Glass Carrier for Semiconductor Packaging Revenue (million) Forecast, by Application 2019 & 2032
- Table 50: Russia Glass Carrier for Semiconductor Packaging Volume (K) Forecast, by Application 2019 & 2032
- Table 51: Benelux Glass Carrier for Semiconductor Packaging Revenue (million) Forecast, by Application 2019 & 2032
- Table 52: Benelux Glass Carrier for Semiconductor Packaging Volume (K) Forecast, by Application 2019 & 2032
- Table 53: Nordics Glass Carrier for Semiconductor Packaging Revenue (million) Forecast, by Application 2019 & 2032
- Table 54: Nordics Glass Carrier for Semiconductor Packaging Volume (K) Forecast, by Application 2019 & 2032
- Table 55: Rest of Europe Glass Carrier for Semiconductor Packaging Revenue (million) Forecast, by Application 2019 & 2032
- Table 56: Rest of Europe Glass Carrier for Semiconductor Packaging Volume (K) Forecast, by Application 2019 & 2032
- Table 57: Global Glass Carrier for Semiconductor Packaging Revenue million Forecast, by Application 2019 & 2032
- Table 58: Global Glass Carrier for Semiconductor Packaging Volume K Forecast, by Application 2019 & 2032
- Table 59: Global Glass Carrier for Semiconductor Packaging Revenue million Forecast, by Types 2019 & 2032
- Table 60: Global Glass Carrier for Semiconductor Packaging Volume K Forecast, by Types 2019 & 2032
- Table 61: Global Glass Carrier for Semiconductor Packaging Revenue million Forecast, by Country 2019 & 2032
- Table 62: Global Glass Carrier for Semiconductor Packaging Volume K Forecast, by Country 2019 & 2032
- Table 63: Turkey Glass Carrier for Semiconductor Packaging Revenue (million) Forecast, by Application 2019 & 2032
- Table 64: Turkey Glass Carrier for Semiconductor Packaging Volume (K) Forecast, by Application 2019 & 2032
- Table 65: Israel Glass Carrier for Semiconductor Packaging Revenue (million) Forecast, by Application 2019 & 2032
- Table 66: Israel Glass Carrier for Semiconductor Packaging Volume (K) Forecast, by Application 2019 & 2032
- Table 67: GCC Glass Carrier for Semiconductor Packaging Revenue (million) Forecast, by Application 2019 & 2032
- Table 68: GCC Glass Carrier for Semiconductor Packaging Volume (K) Forecast, by Application 2019 & 2032
- Table 69: North Africa Glass Carrier for Semiconductor Packaging Revenue (million) Forecast, by Application 2019 & 2032
- Table 70: North Africa Glass Carrier for Semiconductor Packaging Volume (K) Forecast, by Application 2019 & 2032
- Table 71: South Africa Glass Carrier for Semiconductor Packaging Revenue (million) Forecast, by Application 2019 & 2032
- Table 72: South Africa Glass Carrier for Semiconductor Packaging Volume (K) Forecast, by Application 2019 & 2032
- Table 73: Rest of Middle East & Africa Glass Carrier for Semiconductor Packaging Revenue (million) Forecast, by Application 2019 & 2032
- Table 74: Rest of Middle East & Africa Glass Carrier for Semiconductor Packaging Volume (K) Forecast, by Application 2019 & 2032
- Table 75: Global Glass Carrier for Semiconductor Packaging Revenue million Forecast, by Application 2019 & 2032
- Table 76: Global Glass Carrier for Semiconductor Packaging Volume K Forecast, by Application 2019 & 2032
- Table 77: Global Glass Carrier for Semiconductor Packaging Revenue million Forecast, by Types 2019 & 2032
- Table 78: Global Glass Carrier for Semiconductor Packaging Volume K Forecast, by Types 2019 & 2032
- Table 79: Global Glass Carrier for Semiconductor Packaging Revenue million Forecast, by Country 2019 & 2032
- Table 80: Global Glass Carrier for Semiconductor Packaging Volume K Forecast, by Country 2019 & 2032
- Table 81: China Glass Carrier for Semiconductor Packaging Revenue (million) Forecast, by Application 2019 & 2032
- Table 82: China Glass Carrier for Semiconductor Packaging Volume (K) Forecast, by Application 2019 & 2032
- Table 83: India Glass Carrier for Semiconductor Packaging Revenue (million) Forecast, by Application 2019 & 2032
- Table 84: India Glass Carrier for Semiconductor Packaging Volume (K) Forecast, by Application 2019 & 2032
- Table 85: Japan Glass Carrier for Semiconductor Packaging Revenue (million) Forecast, by Application 2019 & 2032
- Table 86: Japan Glass Carrier for Semiconductor Packaging Volume (K) Forecast, by Application 2019 & 2032
- Table 87: South Korea Glass Carrier for Semiconductor Packaging Revenue (million) Forecast, by Application 2019 & 2032
- Table 88: South Korea Glass Carrier for Semiconductor Packaging Volume (K) Forecast, by Application 2019 & 2032
- Table 89: ASEAN Glass Carrier for Semiconductor Packaging Revenue (million) Forecast, by Application 2019 & 2032
- Table 90: ASEAN Glass Carrier for Semiconductor Packaging Volume (K) Forecast, by Application 2019 & 2032
- Table 91: Oceania Glass Carrier for Semiconductor Packaging Revenue (million) Forecast, by Application 2019 & 2032
- Table 92: Oceania Glass Carrier for Semiconductor Packaging Volume (K) Forecast, by Application 2019 & 2032
- Table 93: Rest of Asia Pacific Glass Carrier for Semiconductor Packaging Revenue (million) Forecast, by Application 2019 & 2032
- Table 94: Rest of Asia Pacific Glass Carrier for Semiconductor Packaging Volume (K) Forecast, by Application 2019 & 2032
Frequently Asked Questions
1. What is the projected Compound Annual Growth Rate (CAGR) of the Glass Carrier for Semiconductor Packaging?
The projected CAGR is approximately XX%.
2. Which companies are prominent players in the Glass Carrier for Semiconductor Packaging?
Key companies in the market include Corning, AGC, SCHOTT, NEG, PlanOptik, Tecnisco.
3. What are the main segments of the Glass Carrier for Semiconductor Packaging?
The market segments include Application, Types.
4. Can you provide details about the market size?
The market size is estimated to be USD XXX million as of 2022.
5. What are some drivers contributing to market growth?
N/A
6. What are the notable trends driving market growth?
N/A
7. Are there any restraints impacting market growth?
N/A
8. Can you provide examples of recent developments in the market?
N/A
9. What pricing options are available for accessing the report?
Pricing options include single-user, multi-user, and enterprise licenses priced at USD 3350.00, USD 5025.00, and USD 6700.00 respectively.
10. Is the market size provided in terms of value or volume?
The market size is provided in terms of value, measured in million and volume, measured in K.
11. Are there any specific market keywords associated with the report?
Yes, the market keyword associated with the report is "Glass Carrier for Semiconductor Packaging," which aids in identifying and referencing the specific market segment covered.
12. How do I determine which pricing option suits my needs best?
The pricing options vary based on user requirements and access needs. Individual users may opt for single-user licenses, while businesses requiring broader access may choose multi-user or enterprise licenses for cost-effective access to the report.
13. Are there any additional resources or data provided in the Glass Carrier for Semiconductor Packaging report?
While the report offers comprehensive insights, it's advisable to review the specific contents or supplementary materials provided to ascertain if additional resources or data are available.
14. How can I stay updated on further developments or reports in the Glass Carrier for Semiconductor Packaging?
To stay informed about further developments, trends, and reports in the Glass Carrier for Semiconductor Packaging, consider subscribing to industry newsletters, following relevant companies and organizations, or regularly checking reputable industry news sources and publications.
Methodology
Step 1 - Identification of Relevant Samples Size from Population Database


Step 2 - Approaches for Defining Global Market Size (Value, Volume* & Price*)

Note*: In applicable scenarios
Step 3 - Data Sources
Primary Research
- Web Analytics
- Survey Reports
- Research Institute
- Latest Research Reports
- Opinion Leaders
Secondary Research
- Annual Reports
- White Paper
- Latest Press Release
- Industry Association
- Paid Database
- Investor Presentations

Step 4 - Data Triangulation
Involves using different sources of information in order to increase the validity of a study
These sources are likely to be stakeholders in a program - participants, other researchers, program staff, other community members, and so on.
Then we put all data in single framework & apply various statistical tools to find out the dynamic on the market.
During the analysis stage, feedback from the stakeholder groups would be compared to determine areas of agreement as well as areas of divergence
