

Key Insights
The Smart Television and Set-Top Box market is projected for significant expansion, driven by escalating demand for advanced display technologies including 4K and 8K resolutions, larger screen dimensions, and integrated Smart TV functionalities such as streaming applications and voice command capabilities. The market is forecasted to reach $26.32 billion by 2024, with a Compound Annual Growth Rate (CAGR) of 3.9%. Key growth catalysts include the widespread adoption of streaming services, advancements in display technology such as OLED and QLED, and the seamless integration of smart home ecosystems. However, potential market restraints encompass the premium pricing of advanced features like 8K resolution and intense competition from both established manufacturers like Samsung and LG, and emerging Chinese brands. Market segmentation by resolution (HD/FHD, 4K, 8K), display size, and technology (LCD, OLED, QLED) highlights distinct growth patterns, with 4K and larger screens experiencing peak demand, while premium technologies like OLED and QLED command higher market values. The Asia Pacific region, particularly China, is expected to lead market growth due to its substantial population and growing middle class, with North America and Europe also contributing to market expansion, albeit at a potentially moderated pace.
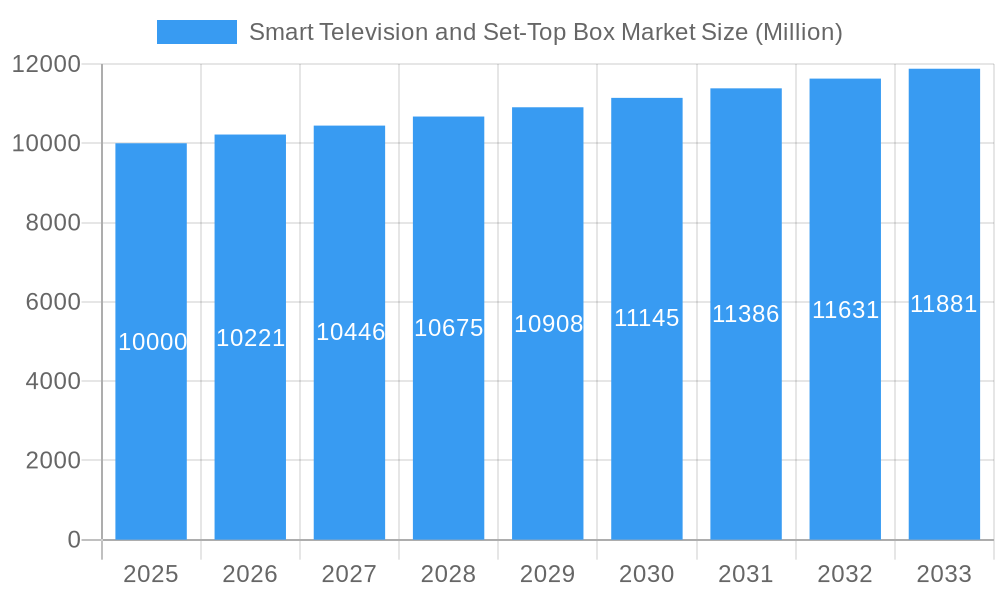
Smart Television and Set-Top Box Market Market Size (In Billion)
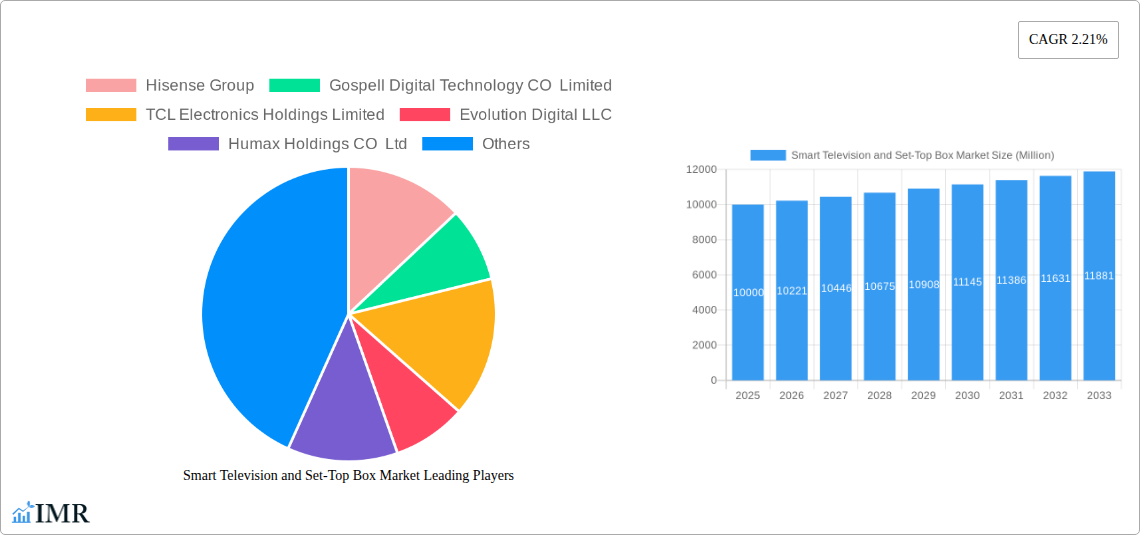
The competitive environment is characterized by a fragmented landscape with numerous participants actively pursuing market share. Leading entities such as Hisense, TCL, LG, Samsung, and Xiaomi are engaged in robust competition, prioritizing feature innovation, competitive pricing strategies, and robust brand recognition. The increasing convergence of Smart TV functionalities with set-top box capabilities, offering integrated streaming solutions within Smart TVs, is fundamentally altering market dynamics and reducing reliance on standalone set-top boxes for content streaming. Future market trajectories will be shaped by technological advancements, consumer spending behaviors, and the evolving landscape of streaming content platforms and distribution models. The development and adoption of next-generation technologies like 8K resolution and advanced HDR formats will critically influence market trends. Furthermore, the continuous global expansion of high-speed internet infrastructure is paramount to facilitating the pervasive adoption of Smart TVs and associated streaming services.
Smart Television and Set-Top Box Market Company Market Share
Smart Television and Set-Top Box Market Report: 2019-2033
This comprehensive report provides an in-depth analysis of the Smart Television and Set-Top Box market, encompassing historical data (2019-2024), current estimates (2025), and future forecasts (2025-2033). It covers the parent market of Consumer Electronics and the child market of Home Entertainment Systems, offering granular insights into market dynamics, growth trends, regional performance, and key players. The report is designed for industry professionals, investors, and strategic decision-makers seeking a clear understanding of this rapidly evolving landscape. Units are presented in millions.
Smart Television and Set-Top Box Market Market Dynamics & Structure
This section analyzes the competitive landscape, technological advancements, and regulatory factors impacting the Smart Television and Set-Top Box market. The market is characterized by a moderate level of concentration, with key players holding significant market share. Technological innovation, particularly in display resolution (HD/FHD, 4K, 8K), display size (32" and below, 39", 48", 55", 65" and above), and display technology (LCD, OLED, QLED), is a major driver of growth. Regulatory frameworks concerning energy efficiency and broadcasting standards also play a role. The rise of streaming services and the increasing demand for high-quality home entertainment experiences are key factors. The market witnesses frequent M&A activities, although the exact volume for the period is unavailable (xx).
- Market Concentration: Moderately concentrated, with top players holding xx% market share in 2024.
- Technological Innovation: Focus on higher resolutions, larger screen sizes, and advanced display technologies like OLED and QLED.
- Regulatory Frameworks: Standards for energy efficiency and broadcasting influence product design and market access.
- Competitive Substitutes: Limited direct substitutes, primarily other forms of home entertainment.
- End-User Demographics: Primarily households with disposable income and a preference for high-quality home entertainment.
- M&A Trends: xx M&A deals observed in the period 2019-2024, primarily focused on expanding product portfolios and market reach.
Smart Television and Set-Top Box Market Growth Trends & Insights
The Smart Television and Set-Top Box market has experienced significant growth over the past years, driven by increased adoption of streaming services, technological advancements, and rising disposable incomes. The market size increased from xx million units in 2019 to xx million units in 2024, exhibiting a CAGR of xx%. Adoption rates are high in developed economies, with increasing penetration in emerging markets. Technological disruptions, such as the introduction of 8K resolution and advanced HDR technologies, are constantly reshaping the market. Consumer behavior shifts towards larger screen sizes and premium features are also prominent. The forecast for 2025-2033 suggests continued growth, reaching xx million units by 2033, with a projected CAGR of xx%.
Dominant Regions, Countries, or Segments in Smart Television and Set-Top Box Market
North America and Asia (specifically China and India) are currently the dominant regions, although the market is experiencing robust growth in other regions. Within segments:
- By Resolution: The 4K segment holds the largest market share, driven by affordability and wider availability. 8K is showing early growth but remains a niche segment.
- By Display Size: The 55-inch and 65-inch segments dominate, indicating a consumer preference for larger screens.
- By Technology: LCD remains the most prevalent technology due to cost-effectiveness, but OLED and QLED are rapidly gaining traction in the premium segment.
Key drivers in these dominant regions include:
- High disposable incomes: Increased purchasing power fuels consumer demand for premium products.
- Robust e-commerce infrastructure: Online platforms facilitate product accessibility and purchasing convenience.
- Favorable government policies: Incentives for technological advancements and digital adoption stimulate market growth.
The continued expansion of high-speed internet infrastructure, coupled with favorable economic conditions, positions these regions for continued dominance.
Smart Television and Set-Top Box Market Product Landscape
Smart TVs and set-top boxes are increasingly integrated with advanced features like voice control, AI-powered recommendations, and seamless streaming capabilities. Products are differentiated through display technologies (OLED, QLED, LCD), resolution (HD, 4K, 8K), smart features, and operating system integration (Android TV, Roku, etc.). Unique selling propositions include HDR capabilities for improved image quality and advanced gaming features tailored to specific consoles.
Key Drivers, Barriers & Challenges in Smart Television and Set-Top Box Market
Key Drivers:
- Rising disposable incomes in emerging markets: This fuels demand for high-quality home entertainment solutions.
- Technological advancements: New display technologies and smart features continuously drive innovation and attract consumers.
- Increased adoption of streaming services: The demand for streaming content necessitates high-quality viewing solutions.
Key Challenges:
- Supply chain disruptions: Component shortages and logistical challenges can impact production and pricing.
- Intense competition: The market is crowded with established players and new entrants, leading to price wars.
- Regulatory hurdles: Standards and regulations vary across regions, adding complexity to market entry.
Emerging Opportunities in Smart Television and Set-Top Box Market
- Expansion into untapped markets: Emerging economies present significant growth opportunities.
- Development of innovative features: AI-powered personalization, enhanced gaming integration, and improved accessibility features offer significant potential.
- Integration with smart home ecosystems: Smart TVs and set-top boxes are increasingly integrated with wider smart home setups, creating new possibilities.
Growth Accelerators in the Smart Television and Set-Top Box Market Industry
The Smart TV and set-top box market is expected to witness continuous growth fueled by technological innovations such as mini-LED and Micro-LED displays, along with the ever-increasing demand for higher resolutions and superior viewing experiences. Strategic partnerships and collaborations between manufacturers, content providers, and technology companies will also play a crucial role in driving market expansion. The emergence of new technologies and the adoption of innovative marketing strategies will unlock additional avenues for growth.
Key Players Shaping the Smart Television and Set-Top Box Market Market
- Hisense Group
- Gospell Digital Technology CO Limited
- TCL Electronics Holdings Limited
- Evolution Digital LLC
- Humax Holdings CO Ltd
- LG Electronics Inc
- Shenzhen Skyworth Digital Technology CO Ltd
- Shenzhen Coship Electronics CO Ltd
- Intek Digital Inc
- Arris International PLC (commscope Holding Company Inc)
- Sagemcom SAS
- ZTE Corporation
- Xiaomi Corporation
- Kaonmedia CO Ltd
- Technicolor SA
- Samsung Electronics CO Ltd
Notable Milestones in Smart Television and Set-Top Box Market Sector
- September 2021: Technicolor deployed next-generation Android TV set-top boxes for TIM, expanding access to premium OTT services in Italy.
- February 2022: ZTE Corporation announced its new-generation 5G media gateway set-top box at MWC 2022.
- August 2022: Samsung launched its Samsung OLED TV in Australia, featuring over 8 million self-lit pixels and Quantum Dot Technology.
In-Depth Smart Television and Set-Top Box Market Market Outlook
The Smart Television and Set-Top Box market is poised for continued expansion, driven by ongoing technological advancements, increasing consumer demand for high-quality entertainment, and the penetration of streaming services globally. Strategic partnerships and investments in R&D are creating new opportunities for market expansion and product innovation. The focus will continue to be on premium features, seamless integration with other smart home devices, and the expansion into emerging markets. The market shows strong potential for sustained growth throughout the forecast period.
Smart Television and Set-Top Box Market Segmentation
-
1. Technology
- 1.1. Satellite/DTH
- 1.2. IPTV
- 1.3. Cable
- 1.4. Other Types (DTT)
-
2. Resolution
- 2.1. SD
- 2.2. HD
- 2.3. Ultra-HD And Higher
-
3. Resolution
- 3.1. HD/FHD
- 3.2. 4K
- 3.3. 8K
-
4. Display Size (in Inches)
- 4.1. 32 And Below
- 4.2. 39-43
- 4.3. 48-50
- 4.4. 55-60
- 4.5. 65 And Above
-
5. Technology
- 5.1. LCD
- 5.2. OLED
- 5.3. QLED
Smart Television and Set-Top Box Market Segmentation By Geography
- 1. North America
- 2. Europe
- 3. Asia Pacific
- 4. Rest of the World
- 5. North America
- 6. Europe
- 7. Asia Pacific
- 8. Rest of the World
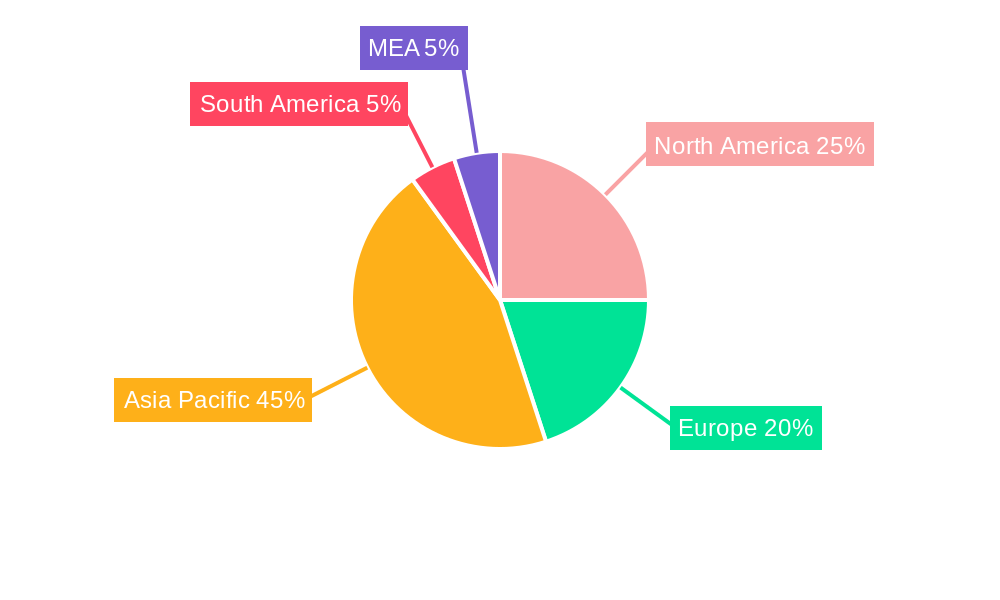
Smart Television and Set-Top Box Market Regional Market Share
Geographic Coverage of Smart Television and Set-Top Box Market
Smart Television and Set-Top Box Market REPORT HIGHLIGHTS
| Aspects | Details |
|---|---|
| Study Period | 2020-2034 |
| Base Year | 2025 |
| Estimated Year | 2026 |
| Forecast Period | 2026-2034 |
| Historical Period | 2020-2025 |
| Growth Rate | CAGR of 3.9% from 2020-2034 |
| Segmentation |
|
Table of Contents
- 1. Introduction
- 1.1. Research Scope
- 1.2. Market Segmentation
- 1.3. Research Methodology
- 1.4. Definitions and Assumptions
- 2. Executive Summary
- 2.1. Introduction
- 3. Market Dynamics
- 3.1. Introduction
- 3.2. Market Drivers
- 3.2.1. High Levels of Technological Innovations; Growing Adoption In The Emerging Markets; Deployment Of OS-based Devices
- 3.3. Market Restrains
- 3.3.1. Growing Production Costs and Vendor Consolidation
- 3.4. Market Trends
- 3.4.1. High Levels of Technological Innovations to Drive the Market
- 4. Market Factor Analysis
- 4.1. Porters Five Forces
- 4.2. Supply/Value Chain
- 4.3. PESTEL analysis
- 4.4. Market Entropy
- 4.5. Patent/Trademark Analysis
- 5. Global Smart Television and Set-Top Box Market Analysis, Insights and Forecast, 2020-2032
- 5.1. Market Analysis, Insights and Forecast - by Technology
- 5.1.1. Satellite/DTH
- 5.1.2. IPTV
- 5.1.3. Cable
- 5.1.4. Other Types (DTT)
- 5.2. Market Analysis, Insights and Forecast - by Resolution
- 5.2.1. SD
- 5.2.2. HD
- 5.2.3. Ultra-HD And Higher
- 5.3. Market Analysis, Insights and Forecast - by Resolution
- 5.3.1. HD/FHD
- 5.3.2. 4K
- 5.3.3. 8K
- 5.4. Market Analysis, Insights and Forecast - by Display Size (in Inches)
- 5.4.1. 32 And Below
- 5.4.2. 39-43
- 5.4.3. 48-50
- 5.4.4. 55-60
- 5.4.5. 65 And Above
- 5.5. Market Analysis, Insights and Forecast - by Technology
- 5.5.1. LCD
- 5.5.2. OLED
- 5.5.3. QLED
- 5.6. Market Analysis, Insights and Forecast - by Region
- 5.6.1. North America
- 5.6.2. Europe
- 5.6.3. Asia Pacific
- 5.6.4. Rest of the World
- 5.6.5. North America
- 5.6.6. Europe
- 5.6.7. Asia Pacific
- 5.6.8. Rest of the World
- 5.1. Market Analysis, Insights and Forecast - by Technology
- 6. North America Smart Television and Set-Top Box Market Analysis, Insights and Forecast, 2020-2032
- 6.1. Market Analysis, Insights and Forecast - by Technology
- 6.1.1. Satellite/DTH
- 6.1.2. IPTV
- 6.1.3. Cable
- 6.1.4. Other Types (DTT)
- 6.2. Market Analysis, Insights and Forecast - by Resolution
- 6.2.1. SD
- 6.2.2. HD
- 6.2.3. Ultra-HD And Higher
- 6.3. Market Analysis, Insights and Forecast - by Resolution
- 6.3.1. HD/FHD
- 6.3.2. 4K
- 6.3.3. 8K
- 6.4. Market Analysis, Insights and Forecast - by Display Size (in Inches)
- 6.4.1. 32 And Below
- 6.4.2. 39-43
- 6.4.3. 48-50
- 6.4.4. 55-60
- 6.4.5. 65 And Above
- 6.5. Market Analysis, Insights and Forecast - by Technology
- 6.5.1. LCD
- 6.5.2. OLED
- 6.5.3. QLED
- 6.1. Market Analysis, Insights and Forecast - by Technology
- 7. Europe Smart Television and Set-Top Box Market Analysis, Insights and Forecast, 2020-2032
- 7.1. Market Analysis, Insights and Forecast - by Technology
- 7.1.1. Satellite/DTH
- 7.1.2. IPTV
- 7.1.3. Cable
- 7.1.4. Other Types (DTT)
- 7.2. Market Analysis, Insights and Forecast - by Resolution
- 7.2.1. SD
- 7.2.2. HD
- 7.2.3. Ultra-HD And Higher
- 7.3. Market Analysis, Insights and Forecast - by Resolution
- 7.3.1. HD/FHD
- 7.3.2. 4K
- 7.3.3. 8K
- 7.4. Market Analysis, Insights and Forecast - by Display Size (in Inches)
- 7.4.1. 32 And Below
- 7.4.2. 39-43
- 7.4.3. 48-50
- 7.4.4. 55-60
- 7.4.5. 65 And Above
- 7.5. Market Analysis, Insights and Forecast - by Technology
- 7.5.1. LCD
- 7.5.2. OLED
- 7.5.3. QLED
- 7.1. Market Analysis, Insights and Forecast - by Technology
- 8. Asia Pacific Smart Television and Set-Top Box Market Analysis, Insights and Forecast, 2020-2032
- 8.1. Market Analysis, Insights and Forecast - by Technology
- 8.1.1. Satellite/DTH
- 8.1.2. IPTV
- 8.1.3. Cable
- 8.1.4. Other Types (DTT)
- 8.2. Market Analysis, Insights and Forecast - by Resolution
- 8.2.1. SD
- 8.2.2. HD
- 8.2.3. Ultra-HD And Higher
- 8.3. Market Analysis, Insights and Forecast - by Resolution
- 8.3.1. HD/FHD
- 8.3.2. 4K
- 8.3.3. 8K
- 8.4. Market Analysis, Insights and Forecast - by Display Size (in Inches)
- 8.4.1. 32 And Below
- 8.4.2. 39-43
- 8.4.3. 48-50
- 8.4.4. 55-60
- 8.4.5. 65 And Above
- 8.5. Market Analysis, Insights and Forecast - by Technology
- 8.5.1. LCD
- 8.5.2. OLED
- 8.5.3. QLED
- 8.1. Market Analysis, Insights and Forecast - by Technology
- 9. Rest of the World Smart Television and Set-Top Box Market Analysis, Insights and Forecast, 2020-2032
- 9.1. Market Analysis, Insights and Forecast - by Technology
- 9.1.1. Satellite/DTH
- 9.1.2. IPTV
- 9.1.3. Cable
- 9.1.4. Other Types (DTT)
- 9.2. Market Analysis, Insights and Forecast - by Resolution
- 9.2.1. SD
- 9.2.2. HD
- 9.2.3. Ultra-HD And Higher
- 9.3. Market Analysis, Insights and Forecast - by Resolution
- 9.3.1. HD/FHD
- 9.3.2. 4K
- 9.3.3. 8K
- 9.4. Market Analysis, Insights and Forecast - by Display Size (in Inches)
- 9.4.1. 32 And Below
- 9.4.2. 39-43
- 9.4.3. 48-50
- 9.4.4. 55-60
- 9.4.5. 65 And Above
- 9.5. Market Analysis, Insights and Forecast - by Technology
- 9.5.1. LCD
- 9.5.2. OLED
- 9.5.3. QLED
- 9.1. Market Analysis, Insights and Forecast - by Technology
- 10. North America Smart Television and Set-Top Box Market Analysis, Insights and Forecast, 2020-2032
- 10.1. Market Analysis, Insights and Forecast - by Technology
- 10.1.1. Satellite/DTH
- 10.1.2. IPTV
- 10.1.3. Cable
- 10.1.4. Other Types (DTT)
- 10.2. Market Analysis, Insights and Forecast - by Resolution
- 10.2.1. SD
- 10.2.2. HD
- 10.2.3. Ultra-HD And Higher
- 10.3. Market Analysis, Insights and Forecast - by Resolution
- 10.3.1. HD/FHD
- 10.3.2. 4K
- 10.3.3. 8K
- 10.4. Market Analysis, Insights and Forecast - by Display Size (in Inches)
- 10.4.1. 32 And Below
- 10.4.2. 39-43
- 10.4.3. 48-50
- 10.4.4. 55-60
- 10.4.5. 65 And Above
- 10.5. Market Analysis, Insights and Forecast - by Technology
- 10.5.1. LCD
- 10.5.2. OLED
- 10.5.3. QLED
- 10.1. Market Analysis, Insights and Forecast - by Technology
- 11. Europe Smart Television and Set-Top Box Market Analysis, Insights and Forecast, 2020-2032
- 11.1. Market Analysis, Insights and Forecast - by Technology
- 11.1.1. Satellite/DTH
- 11.1.2. IPTV
- 11.1.3. Cable
- 11.1.4. Other Types (DTT)
- 11.2. Market Analysis, Insights and Forecast - by Resolution
- 11.2.1. SD
- 11.2.2. HD
- 11.2.3. Ultra-HD And Higher
- 11.3. Market Analysis, Insights and Forecast - by Resolution
- 11.3.1. HD/FHD
- 11.3.2. 4K
- 11.3.3. 8K
- 11.4. Market Analysis, Insights and Forecast - by Display Size (in Inches)
- 11.4.1. 32 And Below
- 11.4.2. 39-43
- 11.4.3. 48-50
- 11.4.4. 55-60
- 11.4.5. 65 And Above
- 11.5. Market Analysis, Insights and Forecast - by Technology
- 11.5.1. LCD
- 11.5.2. OLED
- 11.5.3. QLED
- 11.1. Market Analysis, Insights and Forecast - by Technology
- 12. Asia Pacific Smart Television and Set-Top Box Market Analysis, Insights and Forecast, 2020-2032
- 12.1. Market Analysis, Insights and Forecast - by Technology
- 12.1.1. Satellite/DTH
- 12.1.2. IPTV
- 12.1.3. Cable
- 12.1.4. Other Types (DTT)
- 12.2. Market Analysis, Insights and Forecast - by Resolution
- 12.2.1. SD
- 12.2.2. HD
- 12.2.3. Ultra-HD And Higher
- 12.3. Market Analysis, Insights and Forecast - by Resolution
- 12.3.1. HD/FHD
- 12.3.2. 4K
- 12.3.3. 8K
- 12.4. Market Analysis, Insights and Forecast - by Display Size (in Inches)
- 12.4.1. 32 And Below
- 12.4.2. 39-43
- 12.4.3. 48-50
- 12.4.4. 55-60
- 12.4.5. 65 And Above
- 12.5. Market Analysis, Insights and Forecast - by Technology
- 12.5.1. LCD
- 12.5.2. OLED
- 12.5.3. QLED
- 12.1. Market Analysis, Insights and Forecast - by Technology
- 13. Rest of the World Smart Television and Set-Top Box Market Analysis, Insights and Forecast, 2020-2032
- 13.1. Market Analysis, Insights and Forecast - by Technology
- 13.1.1. Satellite/DTH
- 13.1.2. IPTV
- 13.1.3. Cable
- 13.1.4. Other Types (DTT)
- 13.2. Market Analysis, Insights and Forecast - by Resolution
- 13.2.1. SD
- 13.2.2. HD
- 13.2.3. Ultra-HD And Higher
- 13.3. Market Analysis, Insights and Forecast - by Resolution
- 13.3.1. HD/FHD
- 13.3.2. 4K
- 13.3.3. 8K
- 13.4. Market Analysis, Insights and Forecast - by Display Size (in Inches)
- 13.4.1. 32 And Below
- 13.4.2. 39-43
- 13.4.3. 48-50
- 13.4.4. 55-60
- 13.4.5. 65 And Above
- 13.5. Market Analysis, Insights and Forecast - by Technology
- 13.5.1. LCD
- 13.5.2. OLED
- 13.5.3. QLED
- 13.1. Market Analysis, Insights and Forecast - by Technology
- 14. Competitive Analysis
- 14.1. Global Market Share Analysis 2025
- 14.2. Company Profiles
- 14.2.1 Hisense Group
- 14.2.1.1. Overview
- 14.2.1.2. Products
- 14.2.1.3. SWOT Analysis
- 14.2.1.4. Recent Developments
- 14.2.1.5. Financials (Based on Availability)
- 14.2.2 Gospell Digital Technology CO Limited
- 14.2.2.1. Overview
- 14.2.2.2. Products
- 14.2.2.3. SWOT Analysis
- 14.2.2.4. Recent Developments
- 14.2.2.5. Financials (Based on Availability)
- 14.2.3 TCL Electronics Holdings Limited
- 14.2.3.1. Overview
- 14.2.3.2. Products
- 14.2.3.3. SWOT Analysis
- 14.2.3.4. Recent Developments
- 14.2.3.5. Financials (Based on Availability)
- 14.2.4 Evolution Digital LLC
- 14.2.4.1. Overview
- 14.2.4.2. Products
- 14.2.4.3. SWOT Analysis
- 14.2.4.4. Recent Developments
- 14.2.4.5. Financials (Based on Availability)
- 14.2.5 Humax Holdings CO Ltd
- 14.2.5.1. Overview
- 14.2.5.2. Products
- 14.2.5.3. SWOT Analysis
- 14.2.5.4. Recent Developments
- 14.2.5.5. Financials (Based on Availability)
- 14.2.6 LG Electronics Inc
- 14.2.6.1. Overview
- 14.2.6.2. Products
- 14.2.6.3. SWOT Analysis
- 14.2.6.4. Recent Developments
- 14.2.6.5. Financials (Based on Availability)
- 14.2.7 Shenzhen Skyworth Digital Technology CO Ltd
- 14.2.7.1. Overview
- 14.2.7.2. Products
- 14.2.7.3. SWOT Analysis
- 14.2.7.4. Recent Developments
- 14.2.7.5. Financials (Based on Availability)
- 14.2.8 Shenzhen Coship Electronics CO Ltd
- 14.2.8.1. Overview
- 14.2.8.2. Products
- 14.2.8.3. SWOT Analysis
- 14.2.8.4. Recent Developments
- 14.2.8.5. Financials (Based on Availability)
- 14.2.9 Intek Digital Inc
- 14.2.9.1. Overview
- 14.2.9.2. Products
- 14.2.9.3. SWOT Analysis
- 14.2.9.4. Recent Developments
- 14.2.9.5. Financials (Based on Availability)
- 14.2.10 Arris International PLC (commscope Holding Company Inc)
- 14.2.10.1. Overview
- 14.2.10.2. Products
- 14.2.10.3. SWOT Analysis
- 14.2.10.4. Recent Developments
- 14.2.10.5. Financials (Based on Availability)
- 14.2.11 Sagemcom SAS
- 14.2.11.1. Overview
- 14.2.11.2. Products
- 14.2.11.3. SWOT Analysis
- 14.2.11.4. Recent Developments
- 14.2.11.5. Financials (Based on Availability)
- 14.2.12 ZTE Corporation
- 14.2.12.1. Overview
- 14.2.12.2. Products
- 14.2.12.3. SWOT Analysis
- 14.2.12.4. Recent Developments
- 14.2.12.5. Financials (Based on Availability)
- 14.2.13 Xiaomi Corporatio
- 14.2.13.1. Overview
- 14.2.13.2. Products
- 14.2.13.3. SWOT Analysis
- 14.2.13.4. Recent Developments
- 14.2.13.5. Financials (Based on Availability)
- 14.2.14 Kaonmedia CO Ltd
- 14.2.14.1. Overview
- 14.2.14.2. Products
- 14.2.14.3. SWOT Analysis
- 14.2.14.4. Recent Developments
- 14.2.14.5. Financials (Based on Availability)
- 14.2.15 Technicolor SA
- 14.2.15.1. Overview
- 14.2.15.2. Products
- 14.2.15.3. SWOT Analysis
- 14.2.15.4. Recent Developments
- 14.2.15.5. Financials (Based on Availability)
- 14.2.16 Samsung Electronics CO Ltd
- 14.2.16.1. Overview
- 14.2.16.2. Products
- 14.2.16.3. SWOT Analysis
- 14.2.16.4. Recent Developments
- 14.2.16.5. Financials (Based on Availability)
- 14.2.1 Hisense Group
List of Figures
- Figure 1: Global Smart Television and Set-Top Box Market Revenue Breakdown (billion, %) by Region 2025 & 2033
- Figure 2: Global Smart Television and Set-Top Box Market Volume Breakdown (K Unit, %) by Region 2025 & 2033
- Figure 3: North America Smart Television and Set-Top Box Market Revenue (billion), by Technology 2025 & 2033
- Figure 4: North America Smart Television and Set-Top Box Market Volume (K Unit), by Technology 2025 & 2033
- Figure 5: North America Smart Television and Set-Top Box Market Revenue Share (%), by Technology 2025 & 2033
- Figure 6: North America Smart Television and Set-Top Box Market Volume Share (%), by Technology 2025 & 2033
- Figure 7: North America Smart Television and Set-Top Box Market Revenue (billion), by Resolution 2025 & 2033
- Figure 8: North America Smart Television and Set-Top Box Market Volume (K Unit), by Resolution 2025 & 2033
- Figure 9: North America Smart Television and Set-Top Box Market Revenue Share (%), by Resolution 2025 & 2033
- Figure 10: North America Smart Television and Set-Top Box Market Volume Share (%), by Resolution 2025 & 2033
- Figure 11: North America Smart Television and Set-Top Box Market Revenue (billion), by Resolution 2025 & 2033
- Figure 12: North America Smart Television and Set-Top Box Market Volume (K Unit), by Resolution 2025 & 2033
- Figure 13: North America Smart Television and Set-Top Box Market Revenue Share (%), by Resolution 2025 & 2033
- Figure 14: North America Smart Television and Set-Top Box Market Volume Share (%), by Resolution 2025 & 2033
- Figure 15: North America Smart Television and Set-Top Box Market Revenue (billion), by Display Size (in Inches) 2025 & 2033
- Figure 16: North America Smart Television and Set-Top Box Market Volume (K Unit), by Display Size (in Inches) 2025 & 2033
- Figure 17: North America Smart Television and Set-Top Box Market Revenue Share (%), by Display Size (in Inches) 2025 & 2033
- Figure 18: North America Smart Television and Set-Top Box Market Volume Share (%), by Display Size (in Inches) 2025 & 2033
- Figure 19: North America Smart Television and Set-Top Box Market Revenue (billion), by Technology 2025 & 2033
- Figure 20: North America Smart Television and Set-Top Box Market Volume (K Unit), by Technology 2025 & 2033
- Figure 21: North America Smart Television and Set-Top Box Market Revenue Share (%), by Technology 2025 & 2033
- Figure 22: North America Smart Television and Set-Top Box Market Volume Share (%), by Technology 2025 & 2033
- Figure 23: North America Smart Television and Set-Top Box Market Revenue (billion), by Country 2025 & 2033
- Figure 24: North America Smart Television and Set-Top Box Market Volume (K Unit), by Country 2025 & 2033
- Figure 25: North America Smart Television and Set-Top Box Market Revenue Share (%), by Country 2025 & 2033
- Figure 26: North America Smart Television and Set-Top Box Market Volume Share (%), by Country 2025 & 2033
- Figure 27: Europe Smart Television and Set-Top Box Market Revenue (billion), by Technology 2025 & 2033
- Figure 28: Europe Smart Television and Set-Top Box Market Volume (K Unit), by Technology 2025 & 2033
- Figure 29: Europe Smart Television and Set-Top Box Market Revenue Share (%), by Technology 2025 & 2033
- Figure 30: Europe Smart Television and Set-Top Box Market Volume Share (%), by Technology 2025 & 2033
- Figure 31: Europe Smart Television and Set-Top Box Market Revenue (billion), by Resolution 2025 & 2033
- Figure 32: Europe Smart Television and Set-Top Box Market Volume (K Unit), by Resolution 2025 & 2033
- Figure 33: Europe Smart Television and Set-Top Box Market Revenue Share (%), by Resolution 2025 & 2033
- Figure 34: Europe Smart Television and Set-Top Box Market Volume Share (%), by Resolution 2025 & 2033
- Figure 35: Europe Smart Television and Set-Top Box Market Revenue (billion), by Resolution 2025 & 2033
- Figure 36: Europe Smart Television and Set-Top Box Market Volume (K Unit), by Resolution 2025 & 2033
- Figure 37: Europe Smart Television and Set-Top Box Market Revenue Share (%), by Resolution 2025 & 2033
- Figure 38: Europe Smart Television and Set-Top Box Market Volume Share (%), by Resolution 2025 & 2033
- Figure 39: Europe Smart Television and Set-Top Box Market Revenue (billion), by Display Size (in Inches) 2025 & 2033
- Figure 40: Europe Smart Television and Set-Top Box Market Volume (K Unit), by Display Size (in Inches) 2025 & 2033
- Figure 41: Europe Smart Television and Set-Top Box Market Revenue Share (%), by Display Size (in Inches) 2025 & 2033
- Figure 42: Europe Smart Television and Set-Top Box Market Volume Share (%), by Display Size (in Inches) 2025 & 2033
- Figure 43: Europe Smart Television and Set-Top Box Market Revenue (billion), by Technology 2025 & 2033
- Figure 44: Europe Smart Television and Set-Top Box Market Volume (K Unit), by Technology 2025 & 2033
- Figure 45: Europe Smart Television and Set-Top Box Market Revenue Share (%), by Technology 2025 & 2033
- Figure 46: Europe Smart Television and Set-Top Box Market Volume Share (%), by Technology 2025 & 2033
- Figure 47: Europe Smart Television and Set-Top Box Market Revenue (billion), by Country 2025 & 2033
- Figure 48: Europe Smart Television and Set-Top Box Market Volume (K Unit), by Country 2025 & 2033
- Figure 49: Europe Smart Television and Set-Top Box Market Revenue Share (%), by Country 2025 & 2033
- Figure 50: Europe Smart Television and Set-Top Box Market Volume Share (%), by Country 2025 & 2033
- Figure 51: Asia Pacific Smart Television and Set-Top Box Market Revenue (billion), by Technology 2025 & 2033
- Figure 52: Asia Pacific Smart Television and Set-Top Box Market Volume (K Unit), by Technology 2025 & 2033
- Figure 53: Asia Pacific Smart Television and Set-Top Box Market Revenue Share (%), by Technology 2025 & 2033
- Figure 54: Asia Pacific Smart Television and Set-Top Box Market Volume Share (%), by Technology 2025 & 2033
- Figure 55: Asia Pacific Smart Television and Set-Top Box Market Revenue (billion), by Resolution 2025 & 2033
- Figure 56: Asia Pacific Smart Television and Set-Top Box Market Volume (K Unit), by Resolution 2025 & 2033
- Figure 57: Asia Pacific Smart Television and Set-Top Box Market Revenue Share (%), by Resolution 2025 & 2033
- Figure 58: Asia Pacific Smart Television and Set-Top Box Market Volume Share (%), by Resolution 2025 & 2033
- Figure 59: Asia Pacific Smart Television and Set-Top Box Market Revenue (billion), by Resolution 2025 & 2033
- Figure 60: Asia Pacific Smart Television and Set-Top Box Market Volume (K Unit), by Resolution 2025 & 2033
- Figure 61: Asia Pacific Smart Television and Set-Top Box Market Revenue Share (%), by Resolution 2025 & 2033
- Figure 62: Asia Pacific Smart Television and Set-Top Box Market Volume Share (%), by Resolution 2025 & 2033
- Figure 63: Asia Pacific Smart Television and Set-Top Box Market Revenue (billion), by Display Size (in Inches) 2025 & 2033
- Figure 64: Asia Pacific Smart Television and Set-Top Box Market Volume (K Unit), by Display Size (in Inches) 2025 & 2033
- Figure 65: Asia Pacific Smart Television and Set-Top Box Market Revenue Share (%), by Display Size (in Inches) 2025 & 2033
- Figure 66: Asia Pacific Smart Television and Set-Top Box Market Volume Share (%), by Display Size (in Inches) 2025 & 2033
- Figure 67: Asia Pacific Smart Television and Set-Top Box Market Revenue (billion), by Technology 2025 & 2033
- Figure 68: Asia Pacific Smart Television and Set-Top Box Market Volume (K Unit), by Technology 2025 & 2033
- Figure 69: Asia Pacific Smart Television and Set-Top Box Market Revenue Share (%), by Technology 2025 & 2033
- Figure 70: Asia Pacific Smart Television and Set-Top Box Market Volume Share (%), by Technology 2025 & 2033
- Figure 71: Asia Pacific Smart Television and Set-Top Box Market Revenue (billion), by Country 2025 & 2033
- Figure 72: Asia Pacific Smart Television and Set-Top Box Market Volume (K Unit), by Country 2025 & 2033
- Figure 73: Asia Pacific Smart Television and Set-Top Box Market Revenue Share (%), by Country 2025 & 2033
- Figure 74: Asia Pacific Smart Television and Set-Top Box Market Volume Share (%), by Country 2025 & 2033
- Figure 75: Rest of the World Smart Television and Set-Top Box Market Revenue (billion), by Technology 2025 & 2033
- Figure 76: Rest of the World Smart Television and Set-Top Box Market Volume (K Unit), by Technology 2025 & 2033
- Figure 77: Rest of the World Smart Television and Set-Top Box Market Revenue Share (%), by Technology 2025 & 2033
- Figure 78: Rest of the World Smart Television and Set-Top Box Market Volume Share (%), by Technology 2025 & 2033
- Figure 79: Rest of the World Smart Television and Set-Top Box Market Revenue (billion), by Resolution 2025 & 2033
- Figure 80: Rest of the World Smart Television and Set-Top Box Market Volume (K Unit), by Resolution 2025 & 2033
- Figure 81: Rest of the World Smart Television and Set-Top Box Market Revenue Share (%), by Resolution 2025 & 2033
- Figure 82: Rest of the World Smart Television and Set-Top Box Market Volume Share (%), by Resolution 2025 & 2033
- Figure 83: Rest of the World Smart Television and Set-Top Box Market Revenue (billion), by Resolution 2025 & 2033
- Figure 84: Rest of the World Smart Television and Set-Top Box Market Volume (K Unit), by Resolution 2025 & 2033
- Figure 85: Rest of the World Smart Television and Set-Top Box Market Revenue Share (%), by Resolution 2025 & 2033
- Figure 86: Rest of the World Smart Television and Set-Top Box Market Volume Share (%), by Resolution 2025 & 2033
- Figure 87: Rest of the World Smart Television and Set-Top Box Market Revenue (billion), by Display Size (in Inches) 2025 & 2033
- Figure 88: Rest of the World Smart Television and Set-Top Box Market Volume (K Unit), by Display Size (in Inches) 2025 & 2033
- Figure 89: Rest of the World Smart Television and Set-Top Box Market Revenue Share (%), by Display Size (in Inches) 2025 & 2033
- Figure 90: Rest of the World Smart Television and Set-Top Box Market Volume Share (%), by Display Size (in Inches) 2025 & 2033
- Figure 91: Rest of the World Smart Television and Set-Top Box Market Revenue (billion), by Technology 2025 & 2033
- Figure 92: Rest of the World Smart Television and Set-Top Box Market Volume (K Unit), by Technology 2025 & 2033
- Figure 93: Rest of the World Smart Television and Set-Top Box Market Revenue Share (%), by Technology 2025 & 2033
- Figure 94: Rest of the World Smart Television and Set-Top Box Market Volume Share (%), by Technology 2025 & 2033
- Figure 95: Rest of the World Smart Television and Set-Top Box Market Revenue (billion), by Country 2025 & 2033
- Figure 96: Rest of the World Smart Television and Set-Top Box Market Volume (K Unit), by Country 2025 & 2033
- Figure 97: Rest of the World Smart Television and Set-Top Box Market Revenue Share (%), by Country 2025 & 2033
- Figure 98: Rest of the World Smart Television and Set-Top Box Market Volume Share (%), by Country 2025 & 2033
- Figure 99: North America Smart Television and Set-Top Box Market Revenue (billion), by Technology 2025 & 2033
- Figure 100: North America Smart Television and Set-Top Box Market Volume (K Unit), by Technology 2025 & 2033
- Figure 101: North America Smart Television and Set-Top Box Market Revenue Share (%), by Technology 2025 & 2033
- Figure 102: North America Smart Television and Set-Top Box Market Volume Share (%), by Technology 2025 & 2033
- Figure 103: North America Smart Television and Set-Top Box Market Revenue (billion), by Resolution 2025 & 2033
- Figure 104: North America Smart Television and Set-Top Box Market Volume (K Unit), by Resolution 2025 & 2033
- Figure 105: North America Smart Television and Set-Top Box Market Revenue Share (%), by Resolution 2025 & 2033
- Figure 106: North America Smart Television and Set-Top Box Market Volume Share (%), by Resolution 2025 & 2033
- Figure 107: North America Smart Television and Set-Top Box Market Revenue (billion), by Resolution 2025 & 2033
- Figure 108: North America Smart Television and Set-Top Box Market Volume (K Unit), by Resolution 2025 & 2033
- Figure 109: North America Smart Television and Set-Top Box Market Revenue Share (%), by Resolution 2025 & 2033
- Figure 110: North America Smart Television and Set-Top Box Market Volume Share (%), by Resolution 2025 & 2033
- Figure 111: North America Smart Television and Set-Top Box Market Revenue (billion), by Display Size (in Inches) 2025 & 2033
- Figure 112: North America Smart Television and Set-Top Box Market Volume (K Unit), by Display Size (in Inches) 2025 & 2033
- Figure 113: North America Smart Television and Set-Top Box Market Revenue Share (%), by Display Size (in Inches) 2025 & 2033
- Figure 114: North America Smart Television and Set-Top Box Market Volume Share (%), by Display Size (in Inches) 2025 & 2033
- Figure 115: North America Smart Television and Set-Top Box Market Revenue (billion), by Technology 2025 & 2033
- Figure 116: North America Smart Television and Set-Top Box Market Volume (K Unit), by Technology 2025 & 2033
- Figure 117: North America Smart Television and Set-Top Box Market Revenue Share (%), by Technology 2025 & 2033
- Figure 118: North America Smart Television and Set-Top Box Market Volume Share (%), by Technology 2025 & 2033
- Figure 119: North America Smart Television and Set-Top Box Market Revenue (billion), by Country 2025 & 2033
- Figure 120: North America Smart Television and Set-Top Box Market Volume (K Unit), by Country 2025 & 2033
- Figure 121: North America Smart Television and Set-Top Box Market Revenue Share (%), by Country 2025 & 2033
- Figure 122: North America Smart Television and Set-Top Box Market Volume Share (%), by Country 2025 & 2033
- Figure 123: Europe Smart Television and Set-Top Box Market Revenue (billion), by Technology 2025 & 2033
- Figure 124: Europe Smart Television and Set-Top Box Market Volume (K Unit), by Technology 2025 & 2033
- Figure 125: Europe Smart Television and Set-Top Box Market Revenue Share (%), by Technology 2025 & 2033
- Figure 126: Europe Smart Television and Set-Top Box Market Volume Share (%), by Technology 2025 & 2033
- Figure 127: Europe Smart Television and Set-Top Box Market Revenue (billion), by Resolution 2025 & 2033
- Figure 128: Europe Smart Television and Set-Top Box Market Volume (K Unit), by Resolution 2025 & 2033
- Figure 129: Europe Smart Television and Set-Top Box Market Revenue Share (%), by Resolution 2025 & 2033
- Figure 130: Europe Smart Television and Set-Top Box Market Volume Share (%), by Resolution 2025 & 2033
- Figure 131: Europe Smart Television and Set-Top Box Market Revenue (billion), by Resolution 2025 & 2033
- Figure 132: Europe Smart Television and Set-Top Box Market Volume (K Unit), by Resolution 2025 & 2033
- Figure 133: Europe Smart Television and Set-Top Box Market Revenue Share (%), by Resolution 2025 & 2033
- Figure 134: Europe Smart Television and Set-Top Box Market Volume Share (%), by Resolution 2025 & 2033
- Figure 135: Europe Smart Television and Set-Top Box Market Revenue (billion), by Display Size (in Inches) 2025 & 2033
- Figure 136: Europe Smart Television and Set-Top Box Market Volume (K Unit), by Display Size (in Inches) 2025 & 2033
- Figure 137: Europe Smart Television and Set-Top Box Market Revenue Share (%), by Display Size (in Inches) 2025 & 2033
- Figure 138: Europe Smart Television and Set-Top Box Market Volume Share (%), by Display Size (in Inches) 2025 & 2033
- Figure 139: Europe Smart Television and Set-Top Box Market Revenue (billion), by Technology 2025 & 2033
- Figure 140: Europe Smart Television and Set-Top Box Market Volume (K Unit), by Technology 2025 & 2033
- Figure 141: Europe Smart Television and Set-Top Box Market Revenue Share (%), by Technology 2025 & 2033
- Figure 142: Europe Smart Television and Set-Top Box Market Volume Share (%), by Technology 2025 & 2033
- Figure 143: Europe Smart Television and Set-Top Box Market Revenue (billion), by Country 2025 & 2033
- Figure 144: Europe Smart Television and Set-Top Box Market Volume (K Unit), by Country 2025 & 2033
- Figure 145: Europe Smart Television and Set-Top Box Market Revenue Share (%), by Country 2025 & 2033
- Figure 146: Europe Smart Television and Set-Top Box Market Volume Share (%), by Country 2025 & 2033
- Figure 147: Asia Pacific Smart Television and Set-Top Box Market Revenue (billion), by Technology 2025 & 2033
- Figure 148: Asia Pacific Smart Television and Set-Top Box Market Volume (K Unit), by Technology 2025 & 2033
- Figure 149: Asia Pacific Smart Television and Set-Top Box Market Revenue Share (%), by Technology 2025 & 2033
- Figure 150: Asia Pacific Smart Television and Set-Top Box Market Volume Share (%), by Technology 2025 & 2033
- Figure 151: Asia Pacific Smart Television and Set-Top Box Market Revenue (billion), by Resolution 2025 & 2033
- Figure 152: Asia Pacific Smart Television and Set-Top Box Market Volume (K Unit), by Resolution 2025 & 2033
- Figure 153: Asia Pacific Smart Television and Set-Top Box Market Revenue Share (%), by Resolution 2025 & 2033
- Figure 154: Asia Pacific Smart Television and Set-Top Box Market Volume Share (%), by Resolution 2025 & 2033
- Figure 155: Asia Pacific Smart Television and Set-Top Box Market Revenue (billion), by Resolution 2025 & 2033
- Figure 156: Asia Pacific Smart Television and Set-Top Box Market Volume (K Unit), by Resolution 2025 & 2033
- Figure 157: Asia Pacific Smart Television and Set-Top Box Market Revenue Share (%), by Resolution 2025 & 2033
- Figure 158: Asia Pacific Smart Television and Set-Top Box Market Volume Share (%), by Resolution 2025 & 2033
- Figure 159: Asia Pacific Smart Television and Set-Top Box Market Revenue (billion), by Display Size (in Inches) 2025 & 2033
- Figure 160: Asia Pacific Smart Television and Set-Top Box Market Volume (K Unit), by Display Size (in Inches) 2025 & 2033
- Figure 161: Asia Pacific Smart Television and Set-Top Box Market Revenue Share (%), by Display Size (in Inches) 2025 & 2033
- Figure 162: Asia Pacific Smart Television and Set-Top Box Market Volume Share (%), by Display Size (in Inches) 2025 & 2033
- Figure 163: Asia Pacific Smart Television and Set-Top Box Market Revenue (billion), by Technology 2025 & 2033
- Figure 164: Asia Pacific Smart Television and Set-Top Box Market Volume (K Unit), by Technology 2025 & 2033
- Figure 165: Asia Pacific Smart Television and Set-Top Box Market Revenue Share (%), by Technology 2025 & 2033
- Figure 166: Asia Pacific Smart Television and Set-Top Box Market Volume Share (%), by Technology 2025 & 2033
- Figure 167: Asia Pacific Smart Television and Set-Top Box Market Revenue (billion), by Country 2025 & 2033
- Figure 168: Asia Pacific Smart Television and Set-Top Box Market Volume (K Unit), by Country 2025 & 2033
- Figure 169: Asia Pacific Smart Television and Set-Top Box Market Revenue Share (%), by Country 2025 & 2033
- Figure 170: Asia Pacific Smart Television and Set-Top Box Market Volume Share (%), by Country 2025 & 2033
- Figure 171: Rest of the World Smart Television and Set-Top Box Market Revenue (billion), by Technology 2025 & 2033
- Figure 172: Rest of the World Smart Television and Set-Top Box Market Volume (K Unit), by Technology 2025 & 2033
- Figure 173: Rest of the World Smart Television and Set-Top Box Market Revenue Share (%), by Technology 2025 & 2033
- Figure 174: Rest of the World Smart Television and Set-Top Box Market Volume Share (%), by Technology 2025 & 2033
- Figure 175: Rest of the World Smart Television and Set-Top Box Market Revenue (billion), by Resolution 2025 & 2033
- Figure 176: Rest of the World Smart Television and Set-Top Box Market Volume (K Unit), by Resolution 2025 & 2033
- Figure 177: Rest of the World Smart Television and Set-Top Box Market Revenue Share (%), by Resolution 2025 & 2033
- Figure 178: Rest of the World Smart Television and Set-Top Box Market Volume Share (%), by Resolution 2025 & 2033
- Figure 179: Rest of the World Smart Television and Set-Top Box Market Revenue (billion), by Resolution 2025 & 2033
- Figure 180: Rest of the World Smart Television and Set-Top Box Market Volume (K Unit), by Resolution 2025 & 2033
- Figure 181: Rest of the World Smart Television and Set-Top Box Market Revenue Share (%), by Resolution 2025 & 2033
- Figure 182: Rest of the World Smart Television and Set-Top Box Market Volume Share (%), by Resolution 2025 & 2033
- Figure 183: Rest of the World Smart Television and Set-Top Box Market Revenue (billion), by Display Size (in Inches) 2025 & 2033
- Figure 184: Rest of the World Smart Television and Set-Top Box Market Volume (K Unit), by Display Size (in Inches) 2025 & 2033
- Figure 185: Rest of the World Smart Television and Set-Top Box Market Revenue Share (%), by Display Size (in Inches) 2025 & 2033
- Figure 186: Rest of the World Smart Television and Set-Top Box Market Volume Share (%), by Display Size (in Inches) 2025 & 2033
- Figure 187: Rest of the World Smart Television and Set-Top Box Market Revenue (billion), by Technology 2025 & 2033
- Figure 188: Rest of the World Smart Television and Set-Top Box Market Volume (K Unit), by Technology 2025 & 2033
- Figure 189: Rest of the World Smart Television and Set-Top Box Market Revenue Share (%), by Technology 2025 & 2033
- Figure 190: Rest of the World Smart Television and Set-Top Box Market Volume Share (%), by Technology 2025 & 2033
- Figure 191: Rest of the World Smart Television and Set-Top Box Market Revenue (billion), by Country 2025 & 2033
- Figure 192: Rest of the World Smart Television and Set-Top Box Market Volume (K Unit), by Country 2025 & 2033
- Figure 193: Rest of the World Smart Television and Set-Top Box Market Revenue Share (%), by Country 2025 & 2033
- Figure 194: Rest of the World Smart Television and Set-Top Box Market Volume Share (%), by Country 2025 & 2033
List of Tables
- Table 1: Global Smart Television and Set-Top Box Market Revenue billion Forecast, by Technology 2020 & 2033
- Table 2: Global Smart Television and Set-Top Box Market Volume K Unit Forecast, by Technology 2020 & 2033
- Table 3: Global Smart Television and Set-Top Box Market Revenue billion Forecast, by Resolution 2020 & 2033
- Table 4: Global Smart Television and Set-Top Box Market Volume K Unit Forecast, by Resolution 2020 & 2033
- Table 5: Global Smart Television and Set-Top Box Market Revenue billion Forecast, by Resolution 2020 & 2033
- Table 6: Global Smart Television and Set-Top Box Market Volume K Unit Forecast, by Resolution 2020 & 2033
- Table 7: Global Smart Television and Set-Top Box Market Revenue billion Forecast, by Display Size (in Inches) 2020 & 2033
- Table 8: Global Smart Television and Set-Top Box Market Volume K Unit Forecast, by Display Size (in Inches) 2020 & 2033
- Table 9: Global Smart Television and Set-Top Box Market Revenue billion Forecast, by Technology 2020 & 2033
- Table 10: Global Smart Television and Set-Top Box Market Volume K Unit Forecast, by Technology 2020 & 2033
- Table 11: Global Smart Television and Set-Top Box Market Revenue billion Forecast, by Region 2020 & 2033
- Table 12: Global Smart Television and Set-Top Box Market Volume K Unit Forecast, by Region 2020 & 2033
- Table 13: Global Smart Television and Set-Top Box Market Revenue billion Forecast, by Technology 2020 & 2033
- Table 14: Global Smart Television and Set-Top Box Market Volume K Unit Forecast, by Technology 2020 & 2033
- Table 15: Global Smart Television and Set-Top Box Market Revenue billion Forecast, by Resolution 2020 & 2033
- Table 16: Global Smart Television and Set-Top Box Market Volume K Unit Forecast, by Resolution 2020 & 2033
- Table 17: Global Smart Television and Set-Top Box Market Revenue billion Forecast, by Resolution 2020 & 2033
- Table 18: Global Smart Television and Set-Top Box Market Volume K Unit Forecast, by Resolution 2020 & 2033
- Table 19: Global Smart Television and Set-Top Box Market Revenue billion Forecast, by Display Size (in Inches) 2020 & 2033
- Table 20: Global Smart Television and Set-Top Box Market Volume K Unit Forecast, by Display Size (in Inches) 2020 & 2033
- Table 21: Global Smart Television and Set-Top Box Market Revenue billion Forecast, by Technology 2020 & 2033
- Table 22: Global Smart Television and Set-Top Box Market Volume K Unit Forecast, by Technology 2020 & 2033
- Table 23: Global Smart Television and Set-Top Box Market Revenue billion Forecast, by Country 2020 & 2033
- Table 24: Global Smart Television and Set-Top Box Market Volume K Unit Forecast, by Country 2020 & 2033
- Table 25: Global Smart Television and Set-Top Box Market Revenue billion Forecast, by Technology 2020 & 2033
- Table 26: Global Smart Television and Set-Top Box Market Volume K Unit Forecast, by Technology 2020 & 2033
- Table 27: Global Smart Television and Set-Top Box Market Revenue billion Forecast, by Resolution 2020 & 2033
- Table 28: Global Smart Television and Set-Top Box Market Volume K Unit Forecast, by Resolution 2020 & 2033
- Table 29: Global Smart Television and Set-Top Box Market Revenue billion Forecast, by Resolution 2020 & 2033
- Table 30: Global Smart Television and Set-Top Box Market Volume K Unit Forecast, by Resolution 2020 & 2033
- Table 31: Global Smart Television and Set-Top Box Market Revenue billion Forecast, by Display Size (in Inches) 2020 & 2033
- Table 32: Global Smart Television and Set-Top Box Market Volume K Unit Forecast, by Display Size (in Inches) 2020 & 2033
- Table 33: Global Smart Television and Set-Top Box Market Revenue billion Forecast, by Technology 2020 & 2033
- Table 34: Global Smart Television and Set-Top Box Market Volume K Unit Forecast, by Technology 2020 & 2033
- Table 35: Global Smart Television and Set-Top Box Market Revenue billion Forecast, by Country 2020 & 2033
- Table 36: Global Smart Television and Set-Top Box Market Volume K Unit Forecast, by Country 2020 & 2033
- Table 37: Global Smart Television and Set-Top Box Market Revenue billion Forecast, by Technology 2020 & 2033
- Table 38: Global Smart Television and Set-Top Box Market Volume K Unit Forecast, by Technology 2020 & 2033
- Table 39: Global Smart Television and Set-Top Box Market Revenue billion Forecast, by Resolution 2020 & 2033
- Table 40: Global Smart Television and Set-Top Box Market Volume K Unit Forecast, by Resolution 2020 & 2033
- Table 41: Global Smart Television and Set-Top Box Market Revenue billion Forecast, by Resolution 2020 & 2033
- Table 42: Global Smart Television and Set-Top Box Market Volume K Unit Forecast, by Resolution 2020 & 2033
- Table 43: Global Smart Television and Set-Top Box Market Revenue billion Forecast, by Display Size (in Inches) 2020 & 2033
- Table 44: Global Smart Television and Set-Top Box Market Volume K Unit Forecast, by Display Size (in Inches) 2020 & 2033
- Table 45: Global Smart Television and Set-Top Box Market Revenue billion Forecast, by Technology 2020 & 2033
- Table 46: Global Smart Television and Set-Top Box Market Volume K Unit Forecast, by Technology 2020 & 2033
- Table 47: Global Smart Television and Set-Top Box Market Revenue billion Forecast, by Country 2020 & 2033
- Table 48: Global Smart Television and Set-Top Box Market Volume K Unit Forecast, by Country 2020 & 2033
- Table 49: Global Smart Television and Set-Top Box Market Revenue billion Forecast, by Technology 2020 & 2033
- Table 50: Global Smart Television and Set-Top Box Market Volume K Unit Forecast, by Technology 2020 & 2033
- Table 51: Global Smart Television and Set-Top Box Market Revenue billion Forecast, by Resolution 2020 & 2033
- Table 52: Global Smart Television and Set-Top Box Market Volume K Unit Forecast, by Resolution 2020 & 2033
- Table 53: Global Smart Television and Set-Top Box Market Revenue billion Forecast, by Resolution 2020 & 2033
- Table 54: Global Smart Television and Set-Top Box Market Volume K Unit Forecast, by Resolution 2020 & 2033
- Table 55: Global Smart Television and Set-Top Box Market Revenue billion Forecast, by Display Size (in Inches) 2020 & 2033
- Table 56: Global Smart Television and Set-Top Box Market Volume K Unit Forecast, by Display Size (in Inches) 2020 & 2033
- Table 57: Global Smart Television and Set-Top Box Market Revenue billion Forecast, by Technology 2020 & 2033
- Table 58: Global Smart Television and Set-Top Box Market Volume K Unit Forecast, by Technology 2020 & 2033
- Table 59: Global Smart Television and Set-Top Box Market Revenue billion Forecast, by Country 2020 & 2033
- Table 60: Global Smart Television and Set-Top Box Market Volume K Unit Forecast, by Country 2020 & 2033
- Table 61: Global Smart Television and Set-Top Box Market Revenue billion Forecast, by Technology 2020 & 2033
- Table 62: Global Smart Television and Set-Top Box Market Volume K Unit Forecast, by Technology 2020 & 2033
- Table 63: Global Smart Television and Set-Top Box Market Revenue billion Forecast, by Resolution 2020 & 2033
- Table 64: Global Smart Television and Set-Top Box Market Volume K Unit Forecast, by Resolution 2020 & 2033
- Table 65: Global Smart Television and Set-Top Box Market Revenue billion Forecast, by Resolution 2020 & 2033
- Table 66: Global Smart Television and Set-Top Box Market Volume K Unit Forecast, by Resolution 2020 & 2033
- Table 67: Global Smart Television and Set-Top Box Market Revenue billion Forecast, by Display Size (in Inches) 2020 & 2033
- Table 68: Global Smart Television and Set-Top Box Market Volume K Unit Forecast, by Display Size (in Inches) 2020 & 2033
- Table 69: Global Smart Television and Set-Top Box Market Revenue billion Forecast, by Technology 2020 & 2033
- Table 70: Global Smart Television and Set-Top Box Market Volume K Unit Forecast, by Technology 2020 & 2033
- Table 71: Global Smart Television and Set-Top Box Market Revenue billion Forecast, by Country 2020 & 2033
- Table 72: Global Smart Television and Set-Top Box Market Volume K Unit Forecast, by Country 2020 & 2033
- Table 73: Global Smart Television and Set-Top Box Market Revenue billion Forecast, by Technology 2020 & 2033
- Table 74: Global Smart Television and Set-Top Box Market Volume K Unit Forecast, by Technology 2020 & 2033
- Table 75: Global Smart Television and Set-Top Box Market Revenue billion Forecast, by Resolution 2020 & 2033
- Table 76: Global Smart Television and Set-Top Box Market Volume K Unit Forecast, by Resolution 2020 & 2033
- Table 77: Global Smart Television and Set-Top Box Market Revenue billion Forecast, by Resolution 2020 & 2033
- Table 78: Global Smart Television and Set-Top Box Market Volume K Unit Forecast, by Resolution 2020 & 2033
- Table 79: Global Smart Television and Set-Top Box Market Revenue billion Forecast, by Display Size (in Inches) 2020 & 2033
- Table 80: Global Smart Television and Set-Top Box Market Volume K Unit Forecast, by Display Size (in Inches) 2020 & 2033
- Table 81: Global Smart Television and Set-Top Box Market Revenue billion Forecast, by Technology 2020 & 2033
- Table 82: Global Smart Television and Set-Top Box Market Volume K Unit Forecast, by Technology 2020 & 2033
- Table 83: Global Smart Television and Set-Top Box Market Revenue billion Forecast, by Country 2020 & 2033
- Table 84: Global Smart Television and Set-Top Box Market Volume K Unit Forecast, by Country 2020 & 2033
- Table 85: Global Smart Television and Set-Top Box Market Revenue billion Forecast, by Technology 2020 & 2033
- Table 86: Global Smart Television and Set-Top Box Market Volume K Unit Forecast, by Technology 2020 & 2033
- Table 87: Global Smart Television and Set-Top Box Market Revenue billion Forecast, by Resolution 2020 & 2033
- Table 88: Global Smart Television and Set-Top Box Market Volume K Unit Forecast, by Resolution 2020 & 2033
- Table 89: Global Smart Television and Set-Top Box Market Revenue billion Forecast, by Resolution 2020 & 2033
- Table 90: Global Smart Television and Set-Top Box Market Volume K Unit Forecast, by Resolution 2020 & 2033
- Table 91: Global Smart Television and Set-Top Box Market Revenue billion Forecast, by Display Size (in Inches) 2020 & 2033
- Table 92: Global Smart Television and Set-Top Box Market Volume K Unit Forecast, by Display Size (in Inches) 2020 & 2033
- Table 93: Global Smart Television and Set-Top Box Market Revenue billion Forecast, by Technology 2020 & 2033
- Table 94: Global Smart Television and Set-Top Box Market Volume K Unit Forecast, by Technology 2020 & 2033
- Table 95: Global Smart Television and Set-Top Box Market Revenue billion Forecast, by Country 2020 & 2033
- Table 96: Global Smart Television and Set-Top Box Market Volume K Unit Forecast, by Country 2020 & 2033
- Table 97: Global Smart Television and Set-Top Box Market Revenue billion Forecast, by Technology 2020 & 2033
- Table 98: Global Smart Television and Set-Top Box Market Volume K Unit Forecast, by Technology 2020 & 2033
- Table 99: Global Smart Television and Set-Top Box Market Revenue billion Forecast, by Resolution 2020 & 2033
- Table 100: Global Smart Television and Set-Top Box Market Volume K Unit Forecast, by Resolution 2020 & 2033
- Table 101: Global Smart Television and Set-Top Box Market Revenue billion Forecast, by Resolution 2020 & 2033
- Table 102: Global Smart Television and Set-Top Box Market Volume K Unit Forecast, by Resolution 2020 & 2033
- Table 103: Global Smart Television and Set-Top Box Market Revenue billion Forecast, by Display Size (in Inches) 2020 & 2033
- Table 104: Global Smart Television and Set-Top Box Market Volume K Unit Forecast, by Display Size (in Inches) 2020 & 2033
- Table 105: Global Smart Television and Set-Top Box Market Revenue billion Forecast, by Technology 2020 & 2033
- Table 106: Global Smart Television and Set-Top Box Market Volume K Unit Forecast, by Technology 2020 & 2033
- Table 107: Global Smart Television and Set-Top Box Market Revenue billion Forecast, by Country 2020 & 2033
- Table 108: Global Smart Television and Set-Top Box Market Volume K Unit Forecast, by Country 2020 & 2033
Frequently Asked Questions
1. What is the projected Compound Annual Growth Rate (CAGR) of the Smart Television and Set-Top Box Market?
The projected CAGR is approximately 3.9%.
2. Which companies are prominent players in the Smart Television and Set-Top Box Market?
Key companies in the market include Hisense Group, Gospell Digital Technology CO Limited, TCL Electronics Holdings Limited, Evolution Digital LLC, Humax Holdings CO Ltd, LG Electronics Inc, Shenzhen Skyworth Digital Technology CO Ltd, Shenzhen Coship Electronics CO Ltd, Intek Digital Inc, Arris International PLC (commscope Holding Company Inc), Sagemcom SAS, ZTE Corporation, Xiaomi Corporatio, Kaonmedia CO Ltd, Technicolor SA, Samsung Electronics CO Ltd.
3. What are the main segments of the Smart Television and Set-Top Box Market?
The market segments include Technology, Resolution, Resolution, Display Size (in Inches), Technology.
4. Can you provide details about the market size?
The market size is estimated to be USD 26.32 billion as of 2022.
5. What are some drivers contributing to market growth?
High Levels of Technological Innovations; Growing Adoption In The Emerging Markets; Deployment Of OS-based Devices.
6. What are the notable trends driving market growth?
High Levels of Technological Innovations to Drive the Market.
7. Are there any restraints impacting market growth?
Growing Production Costs and Vendor Consolidation.
8. Can you provide examples of recent developments in the market?
August 2022 - Samsung announced to launch of Samsung OLED in Australia, thereby expanding its 2022 TV line-up. The TV features over 8 million self-lit pixels partnered with Quantum Dot Technology that can deliver brighter, more accurate highlights and realistic colors.
9. What pricing options are available for accessing the report?
Pricing options include single-user, multi-user, and enterprise licenses priced at USD 4750, USD 5250, and USD 8750 respectively.
10. Is the market size provided in terms of value or volume?
The market size is provided in terms of value, measured in billion and volume, measured in K Unit.
11. Are there any specific market keywords associated with the report?
Yes, the market keyword associated with the report is "Smart Television and Set-Top Box Market," which aids in identifying and referencing the specific market segment covered.
12. How do I determine which pricing option suits my needs best?
The pricing options vary based on user requirements and access needs. Individual users may opt for single-user licenses, while businesses requiring broader access may choose multi-user or enterprise licenses for cost-effective access to the report.
13. Are there any additional resources or data provided in the Smart Television and Set-Top Box Market report?
While the report offers comprehensive insights, it's advisable to review the specific contents or supplementary materials provided to ascertain if additional resources or data are available.
14. How can I stay updated on further developments or reports in the Smart Television and Set-Top Box Market?
To stay informed about further developments, trends, and reports in the Smart Television and Set-Top Box Market, consider subscribing to industry newsletters, following relevant companies and organizations, or regularly checking reputable industry news sources and publications.
Methodology
Step 1 - Identification of Relevant Samples Size from Population Database


Step 2 - Approaches for Defining Global Market Size (Value, Volume* & Price*)

Note*: In applicable scenarios
Step 3 - Data Sources
Primary Research
- Web Analytics
- Survey Reports
- Research Institute
- Latest Research Reports
- Opinion Leaders
Secondary Research
- Annual Reports
- White Paper
- Latest Press Release
- Industry Association
- Paid Database
- Investor Presentations

Step 4 - Data Triangulation
Involves using different sources of information in order to increase the validity of a study
These sources are likely to be stakeholders in a program - participants, other researchers, program staff, other community members, and so on.
Then we put all data in single framework & apply various statistical tools to find out the dynamic on the market.
During the analysis stage, feedback from the stakeholder groups would be compared to determine areas of agreement as well as areas of divergence