

Key Insights
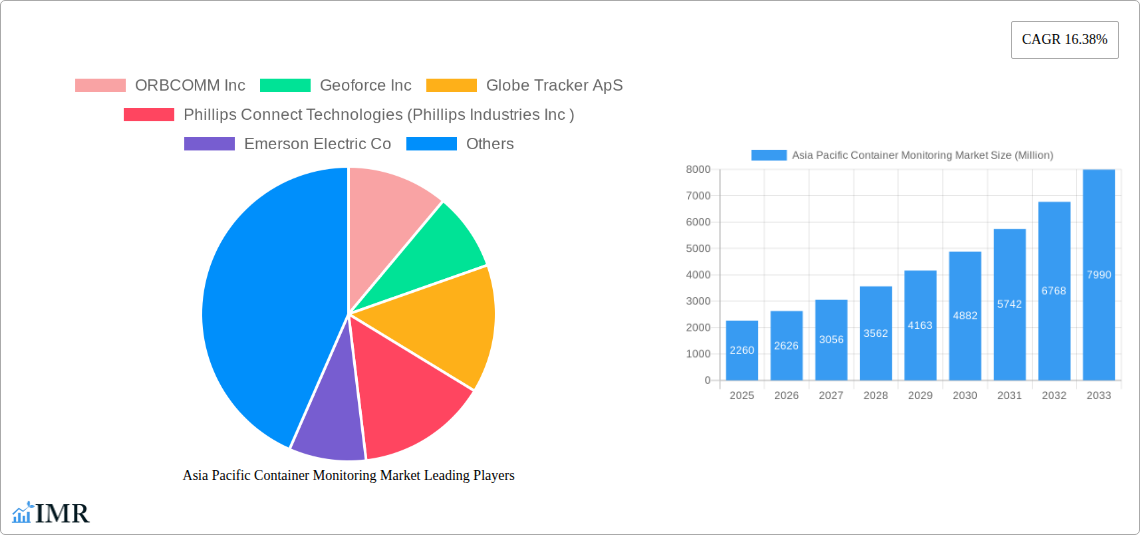
The Asia Pacific container monitoring market is experiencing robust growth, projected to reach \$2.26 billion in 2025 and exhibiting a Compound Annual Growth Rate (CAGR) of 16.38% from 2025 to 2033. This significant expansion is driven by several key factors. Firstly, the increasing need for enhanced supply chain visibility and efficiency in the region's booming e-commerce and manufacturing sectors fuels demand for real-time container tracking and monitoring solutions. Secondly, stringent regulations regarding cargo security and the prevention of theft or damage are pushing businesses to adopt advanced monitoring technologies. Thirdly, technological advancements, such as the integration of IoT sensors, GPS tracking, and data analytics, are improving the accuracy and reliability of container monitoring systems, making them more cost-effective and attractive to businesses. The market's growth is further fueled by the expanding adoption of containerization across various industries, including retail, manufacturing, and logistics within the Asia-Pacific region.
However, the market's growth is not without challenges. High initial investment costs associated with implementing container monitoring systems can be a barrier for smaller businesses. Furthermore, concerns regarding data security and privacy related to the collection and transmission of sensitive cargo data necessitate robust cybersecurity measures. Despite these restraints, the long-term growth prospects for the Asia Pacific container monitoring market remain highly positive, driven by increasing digitization across the supply chain and the continuous development of innovative monitoring technologies. Key players like ORBCOMM Inc, Geoforce Inc, and others are actively shaping this landscape through technological innovation and strategic partnerships. The Asia-Pacific region's unique economic dynamics and infrastructure developments will continue to play a pivotal role in influencing market growth in the coming years.
Asia Pacific Container Monitoring Market: A Comprehensive Report (2019-2033)
This in-depth report provides a comprehensive analysis of the Asia Pacific Container Monitoring Market, covering market dynamics, growth trends, regional dominance, product landscape, key players, and future outlook. The study period spans from 2019 to 2033, with 2025 serving as the base and estimated year. The report offers invaluable insights for industry professionals, investors, and strategic decision-makers seeking to navigate this dynamic market. This report is crucial for understanding the parent market (Logistics and Supply Chain Management) and its child market (Container Monitoring). The market is projected to reach xx Million units by 2033.
Asia Pacific Container Monitoring Market Dynamics & Structure
The Asia Pacific Container Monitoring market is characterized by a moderately concentrated landscape with several key players vying for market share. Technological innovation, particularly in IoT and AI-driven solutions, is a significant driver. Stringent regulatory frameworks governing data security and transportation logistics also play a crucial role. Competitive substitutes, such as manual tracking methods, are gradually being replaced by more efficient and accurate container monitoring systems. The end-user demographic spans across diverse industries, including shipping, logistics, manufacturing, and retail. M&A activity in the sector remains moderate, with approximately xx deals recorded in the historical period (2019-2024), indicating consolidation and strategic expansion.
- Market Concentration: Moderately concentrated, with top 5 players holding approximately xx% market share in 2024.
- Technological Innovation: Significant advancements in IoT, AI, and GPS technologies are driving market growth. However, high initial investment costs represent an innovation barrier for some players.
- Regulatory Framework: Compliance with data privacy regulations (e.g., GDPR, CCPA) and international shipping standards is crucial.
- Competitive Substitutes: Manual tracking methods are being phased out due to their inefficiency and inaccuracy.
- End-User Demographics: Diverse across shipping lines, logistics providers, freight forwarders, and manufacturers.
- M&A Trends: Moderate activity, with a focus on acquiring technology companies and expanding geographic reach (xx deals between 2019-2024).
Asia Pacific Container Monitoring Market Growth Trends & Insights
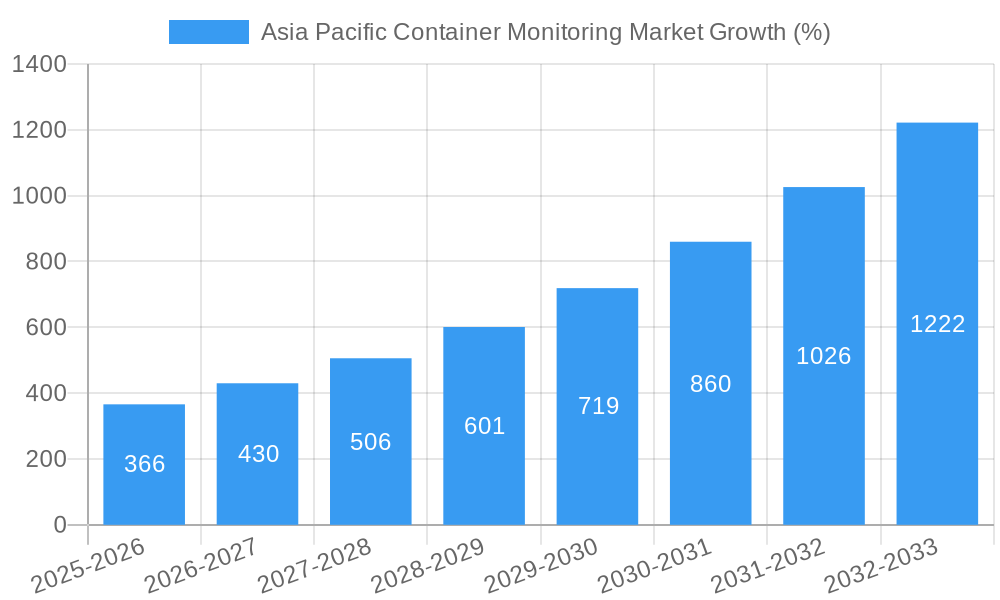
The Asia Pacific Container Monitoring market experienced significant growth during the historical period (2019-2024), driven by the increasing demand for enhanced supply chain visibility and real-time tracking capabilities. The market size expanded from xx Million units in 2019 to xx Million units in 2024, demonstrating a Compound Annual Growth Rate (CAGR) of xx%. Adoption rates are accelerating due to the rising awareness of benefits such as reduced theft, improved efficiency, and optimized logistics. Technological disruptions, including the integration of AI and big data analytics, further enhance the functionalities of container monitoring systems. Consumer behavior shifts toward greater demand for transparency and accountability in supply chains are boosting market demand.
Dominant Regions, Countries, or Segments in Asia Pacific Container Monitoring Market
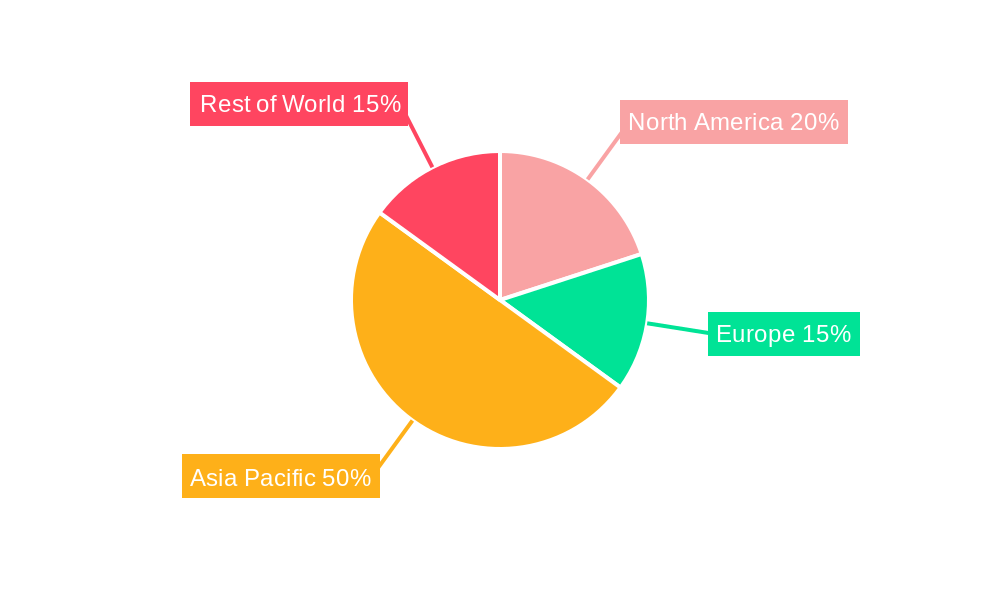
China, followed by Japan, South Korea and Singapore, are currently the dominant regions in the Asia Pacific Container Monitoring market due to their large shipping volumes, robust infrastructure and significant investment in technological advancements. These countries possess well-established logistics networks and a growing emphasis on supply chain optimization, creating a favorable environment for container monitoring system adoption. The strong economic growth and increasing trade activities within these regions further contribute to market expansion.
- Key Drivers:
- Robust Economic Growth: Strong GDP growth fueling trade and shipping activities.
- Developed Infrastructure: Extensive port facilities and efficient logistics networks.
- Government Initiatives: Supportive policies promoting supply chain digitalization.
- High Adoption Rate of Advanced Technologies: Early adoption of IoT, AI and GPS.
Asia Pacific Container Monitoring Market Product Landscape
The market offers a range of container monitoring solutions, from basic GPS trackers to sophisticated systems incorporating IoT sensors, data analytics, and cloud-based platforms. These systems provide real-time location tracking, environmental monitoring (temperature, humidity), and impact detection. Unique selling propositions often include features like customizable alerts, data visualization dashboards, and seamless integration with existing enterprise resource planning (ERP) systems. Technological advancements are focused on improving battery life, enhancing data security, and developing more user-friendly interfaces.
Key Drivers, Barriers & Challenges in Asia Pacific Container Monitoring Market
Key Drivers:
- Increasing demand for real-time visibility and traceability in global supply chains.
- Growing concerns about cargo theft and security breaches.
- The need to optimize logistics and reduce operational costs.
- Government regulations promoting supply chain transparency.
Challenges and Restraints:
- High initial investment costs for implementing container monitoring systems, particularly for small and medium-sized enterprises (SMEs).
- Data security concerns and the need for robust cybersecurity measures.
- Integration challenges with existing logistics systems and infrastructure.
- Lack of standardization in container monitoring technologies, hindering interoperability.
Emerging Opportunities in Asia Pacific Container Monitoring Market
- Expansion into untapped markets within the Asia Pacific region, particularly in Southeast Asia.
- Development of specialized container monitoring solutions for specific industries (e.g., pharmaceuticals, perishable goods).
- Integration of advanced analytics and machine learning to enhance predictive capabilities.
- Adoption of blockchain technology to enhance data security and transparency.
Growth Accelerators in the Asia Pacific Container Monitoring Market Industry
Technological breakthroughs, particularly in areas like low-power wide-area networks (LPWAN) and edge computing, will significantly enhance the capabilities and cost-effectiveness of container monitoring systems. Strategic partnerships between technology providers and logistics companies are expected to drive market growth by enabling broader market access and faster product development. Market expansion strategies, such as regional partnerships and international collaborations, will accelerate adoption rates.
Key Players Shaping the Asia Pacific Container Monitoring Market Market
- ORBCOMM Inc
- Geoforce Inc
- Globe Tracker ApS
- Phillips Connect Technologies (Phillips Industries Inc)
- Emerson Electric Co
- Hapag-Lloyd AG
- TRAXENS
- Roambee Corporation
- OnAsset Intelligence Inc
- Zabbix LLC *List Not Exhaustive
Notable Milestones in Asia Pacific Container Monitoring Market Sector
- September 2024: ZIM Integrated Shipping Services Ltd. announces a long-term operational cooperation with MSC on Asia-US East Coast and Asia-US Gulf trades, launching new services in February 2025, enhancing network efficiency and competitiveness.
- September 2024: Kalmar signs an agreement with ContainerCo in New Zealand to supply six empty container handlers, showcasing the growth and demand within the container depot sector.
In-Depth Asia Pacific Container Monitoring Market Outlook
The Asia Pacific Container Monitoring market is poised for sustained growth over the forecast period (2025-2033), driven by technological advancements, increasing adoption rates, and expanding global trade. The market’s future potential lies in leveraging emerging technologies such as AI, IoT, and blockchain to create more efficient, secure, and cost-effective solutions. Strategic partnerships and investments in innovative container monitoring solutions will further strengthen market growth and solidify the position of key players. The market is projected to reach xx Million units by 2033, representing significant opportunities for both established players and new entrants.
Asia Pacific Container Monitoring Market Segmentation
- 1. Overall
-
2. Key Components
- 2.1. Hardware
- 2.2. Software
- 2.3. Services
-
3. Key Applications
- 3.1. Asset Condition Monitoring
- 3.2. Logistics & Supply Chain Management
- 3.3. Location Tracking
- 3.4. Security
- 3.5. Others
-
4. Geography
- 4.1. China
- 4.2. Japan
- 4.3. South Korea
- 4.4. Middle East
- 4.5. Australia and New Zealand
Asia Pacific Container Monitoring Market Segmentation By Geography
- 1. China
- 2. Japan
- 3. South Korea
- 4. Middle East
- 5. Australia and New Zealand
Asia Pacific Container Monitoring Market REPORT HIGHLIGHTS
| Aspects | Details |
|---|---|
| Study Period | 2019-2033 |
| Base Year | 2024 |
| Estimated Year | 2025 |
| Forecast Period | 2025-2033 |
| Historical Period | 2019-2024 |
| Growth Rate | CAGR of 16.38% from 2019-2033 |
| Segmentation |
|
Table of Contents
- 1. Introduction
- 1.1. Research Scope
- 1.2. Market Segmentation
- 1.3. Research Methodology
- 1.4. Definitions and Assumptions
- 2. Executive Summary
- 2.1. Introduction
- 3. Market Dynamics
- 3.1. Introduction
- 3.2. Market Drivers
- 3.2.1. Surge in Advanced Containment Materials and Structural Innovations; Increase in Seaborne Trade; Increase in Demand to Enhanced Supply Chain Efficiency
- 3.3. Market Restrains
- 3.3.1. Surge in Advanced Containment Materials and Structural Innovations; Increase in Seaborne Trade; Increase in Demand to Enhanced Supply Chain Efficiency
- 3.4. Market Trends
- 3.4.1. Container Monitoring to be a Key Driver for Growth in Logistics and Supply Chain Management
- 4. Market Factor Analysis
- 4.1. Porters Five Forces
- 4.2. Supply/Value Chain
- 4.3. PESTEL analysis
- 4.4. Market Entropy
- 4.5. Patent/Trademark Analysis
- 5. Global Asia Pacific Container Monitoring Market Analysis, Insights and Forecast, 2019-2031
- 5.1. Market Analysis, Insights and Forecast - by Overall
- 5.2. Market Analysis, Insights and Forecast - by Key Components
- 5.2.1. Hardware
- 5.2.2. Software
- 5.2.3. Services
- 5.3. Market Analysis, Insights and Forecast - by Key Applications
- 5.3.1. Asset Condition Monitoring
- 5.3.2. Logistics & Supply Chain Management
- 5.3.3. Location Tracking
- 5.3.4. Security
- 5.3.5. Others
- 5.4. Market Analysis, Insights and Forecast - by Geography
- 5.4.1. China
- 5.4.2. Japan
- 5.4.3. South Korea
- 5.4.4. Middle East
- 5.4.5. Australia and New Zealand
- 5.5. Market Analysis, Insights and Forecast - by Region
- 5.5.1. China
- 5.5.2. Japan
- 5.5.3. South Korea
- 5.5.4. Middle East
- 5.5.5. Australia and New Zealand
- 5.1. Market Analysis, Insights and Forecast - by Overall
- 6. China Asia Pacific Container Monitoring Market Analysis, Insights and Forecast, 2019-2031
- 6.1. Market Analysis, Insights and Forecast - by Overall
- 6.2. Market Analysis, Insights and Forecast - by Key Components
- 6.2.1. Hardware
- 6.2.2. Software
- 6.2.3. Services
- 6.3. Market Analysis, Insights and Forecast - by Key Applications
- 6.3.1. Asset Condition Monitoring
- 6.3.2. Logistics & Supply Chain Management
- 6.3.3. Location Tracking
- 6.3.4. Security
- 6.3.5. Others
- 6.4. Market Analysis, Insights and Forecast - by Geography
- 6.4.1. China
- 6.4.2. Japan
- 6.4.3. South Korea
- 6.4.4. Middle East
- 6.4.5. Australia and New Zealand
- 6.1. Market Analysis, Insights and Forecast - by Overall
- 7. Japan Asia Pacific Container Monitoring Market Analysis, Insights and Forecast, 2019-2031
- 7.1. Market Analysis, Insights and Forecast - by Overall
- 7.2. Market Analysis, Insights and Forecast - by Key Components
- 7.2.1. Hardware
- 7.2.2. Software
- 7.2.3. Services
- 7.3. Market Analysis, Insights and Forecast - by Key Applications
- 7.3.1. Asset Condition Monitoring
- 7.3.2. Logistics & Supply Chain Management
- 7.3.3. Location Tracking
- 7.3.4. Security
- 7.3.5. Others
- 7.4. Market Analysis, Insights and Forecast - by Geography
- 7.4.1. China
- 7.4.2. Japan
- 7.4.3. South Korea
- 7.4.4. Middle East
- 7.4.5. Australia and New Zealand
- 7.1. Market Analysis, Insights and Forecast - by Overall
- 8. South Korea Asia Pacific Container Monitoring Market Analysis, Insights and Forecast, 2019-2031
- 8.1. Market Analysis, Insights and Forecast - by Overall
- 8.2. Market Analysis, Insights and Forecast - by Key Components
- 8.2.1. Hardware
- 8.2.2. Software
- 8.2.3. Services
- 8.3. Market Analysis, Insights and Forecast - by Key Applications
- 8.3.1. Asset Condition Monitoring
- 8.3.2. Logistics & Supply Chain Management
- 8.3.3. Location Tracking
- 8.3.4. Security
- 8.3.5. Others
- 8.4. Market Analysis, Insights and Forecast - by Geography
- 8.4.1. China
- 8.4.2. Japan
- 8.4.3. South Korea
- 8.4.4. Middle East
- 8.4.5. Australia and New Zealand
- 8.1. Market Analysis, Insights and Forecast - by Overall
- 9. Middle East Asia Pacific Container Monitoring Market Analysis, Insights and Forecast, 2019-2031
- 9.1. Market Analysis, Insights and Forecast - by Overall
- 9.2. Market Analysis, Insights and Forecast - by Key Components
- 9.2.1. Hardware
- 9.2.2. Software
- 9.2.3. Services
- 9.3. Market Analysis, Insights and Forecast - by Key Applications
- 9.3.1. Asset Condition Monitoring
- 9.3.2. Logistics & Supply Chain Management
- 9.3.3. Location Tracking
- 9.3.4. Security
- 9.3.5. Others
- 9.4. Market Analysis, Insights and Forecast - by Geography
- 9.4.1. China
- 9.4.2. Japan
- 9.4.3. South Korea
- 9.4.4. Middle East
- 9.4.5. Australia and New Zealand
- 9.1. Market Analysis, Insights and Forecast - by Overall
- 10. Australia and New Zealand Asia Pacific Container Monitoring Market Analysis, Insights and Forecast, 2019-2031
- 10.1. Market Analysis, Insights and Forecast - by Overall
- 10.2. Market Analysis, Insights and Forecast - by Key Components
- 10.2.1. Hardware
- 10.2.2. Software
- 10.2.3. Services
- 10.3. Market Analysis, Insights and Forecast - by Key Applications
- 10.3.1. Asset Condition Monitoring
- 10.3.2. Logistics & Supply Chain Management
- 10.3.3. Location Tracking
- 10.3.4. Security
- 10.3.5. Others
- 10.4. Market Analysis, Insights and Forecast - by Geography
- 10.4.1. China
- 10.4.2. Japan
- 10.4.3. South Korea
- 10.4.4. Middle East
- 10.4.5. Australia and New Zealand
- 10.1. Market Analysis, Insights and Forecast - by Overall
- 11. Competitive Analysis
- 11.1. Global Market Share Analysis 2024
- 11.2. Company Profiles
- 11.2.1 ORBCOMM Inc
- 11.2.1.1. Overview
- 11.2.1.2. Products
- 11.2.1.3. SWOT Analysis
- 11.2.1.4. Recent Developments
- 11.2.1.5. Financials (Based on Availability)
- 11.2.2 Geoforce Inc
- 11.2.2.1. Overview
- 11.2.2.2. Products
- 11.2.2.3. SWOT Analysis
- 11.2.2.4. Recent Developments
- 11.2.2.5. Financials (Based on Availability)
- 11.2.3 Globe Tracker ApS
- 11.2.3.1. Overview
- 11.2.3.2. Products
- 11.2.3.3. SWOT Analysis
- 11.2.3.4. Recent Developments
- 11.2.3.5. Financials (Based on Availability)
- 11.2.4 Phillips Connect Technologies (Phillips Industries Inc )
- 11.2.4.1. Overview
- 11.2.4.2. Products
- 11.2.4.3. SWOT Analysis
- 11.2.4.4. Recent Developments
- 11.2.4.5. Financials (Based on Availability)
- 11.2.5 Emerson Electric Co
- 11.2.5.1. Overview
- 11.2.5.2. Products
- 11.2.5.3. SWOT Analysis
- 11.2.5.4. Recent Developments
- 11.2.5.5. Financials (Based on Availability)
- 11.2.6 Hapag-Lloyd AG
- 11.2.6.1. Overview
- 11.2.6.2. Products
- 11.2.6.3. SWOT Analysis
- 11.2.6.4. Recent Developments
- 11.2.6.5. Financials (Based on Availability)
- 11.2.7 TRAXENS
- 11.2.7.1. Overview
- 11.2.7.2. Products
- 11.2.7.3. SWOT Analysis
- 11.2.7.4. Recent Developments
- 11.2.7.5. Financials (Based on Availability)
- 11.2.8 Roambee Corporation
- 11.2.8.1. Overview
- 11.2.8.2. Products
- 11.2.8.3. SWOT Analysis
- 11.2.8.4. Recent Developments
- 11.2.8.5. Financials (Based on Availability)
- 11.2.9 OnAsset Intelligence Inc
- 11.2.9.1. Overview
- 11.2.9.2. Products
- 11.2.9.3. SWOT Analysis
- 11.2.9.4. Recent Developments
- 11.2.9.5. Financials (Based on Availability)
- 11.2.10 Zabbix LLC *List Not Exhaustive
- 11.2.10.1. Overview
- 11.2.10.2. Products
- 11.2.10.3. SWOT Analysis
- 11.2.10.4. Recent Developments
- 11.2.10.5. Financials (Based on Availability)
- 11.2.1 ORBCOMM Inc
List of Figures
- Figure 1: Global Asia Pacific Container Monitoring Market Revenue Breakdown (Million, %) by Region 2024 & 2032
- Figure 2: Global Asia Pacific Container Monitoring Market Volume Breakdown (Billion, %) by Region 2024 & 2032
- Figure 3: China Asia Pacific Container Monitoring Market Revenue (Million), by Overall 2024 & 2032
- Figure 4: China Asia Pacific Container Monitoring Market Volume (Billion), by Overall 2024 & 2032
- Figure 5: China Asia Pacific Container Monitoring Market Revenue Share (%), by Overall 2024 & 2032
- Figure 6: China Asia Pacific Container Monitoring Market Volume Share (%), by Overall 2024 & 2032
- Figure 7: China Asia Pacific Container Monitoring Market Revenue (Million), by Key Components 2024 & 2032
- Figure 8: China Asia Pacific Container Monitoring Market Volume (Billion), by Key Components 2024 & 2032
- Figure 9: China Asia Pacific Container Monitoring Market Revenue Share (%), by Key Components 2024 & 2032
- Figure 10: China Asia Pacific Container Monitoring Market Volume Share (%), by Key Components 2024 & 2032
- Figure 11: China Asia Pacific Container Monitoring Market Revenue (Million), by Key Applications 2024 & 2032
- Figure 12: China Asia Pacific Container Monitoring Market Volume (Billion), by Key Applications 2024 & 2032
- Figure 13: China Asia Pacific Container Monitoring Market Revenue Share (%), by Key Applications 2024 & 2032
- Figure 14: China Asia Pacific Container Monitoring Market Volume Share (%), by Key Applications 2024 & 2032
- Figure 15: China Asia Pacific Container Monitoring Market Revenue (Million), by Geography 2024 & 2032
- Figure 16: China Asia Pacific Container Monitoring Market Volume (Billion), by Geography 2024 & 2032
- Figure 17: China Asia Pacific Container Monitoring Market Revenue Share (%), by Geography 2024 & 2032
- Figure 18: China Asia Pacific Container Monitoring Market Volume Share (%), by Geography 2024 & 2032
- Figure 19: China Asia Pacific Container Monitoring Market Revenue (Million), by Country 2024 & 2032
- Figure 20: China Asia Pacific Container Monitoring Market Volume (Billion), by Country 2024 & 2032
- Figure 21: China Asia Pacific Container Monitoring Market Revenue Share (%), by Country 2024 & 2032
- Figure 22: China Asia Pacific Container Monitoring Market Volume Share (%), by Country 2024 & 2032
- Figure 23: Japan Asia Pacific Container Monitoring Market Revenue (Million), by Overall 2024 & 2032
- Figure 24: Japan Asia Pacific Container Monitoring Market Volume (Billion), by Overall 2024 & 2032
- Figure 25: Japan Asia Pacific Container Monitoring Market Revenue Share (%), by Overall 2024 & 2032
- Figure 26: Japan Asia Pacific Container Monitoring Market Volume Share (%), by Overall 2024 & 2032
- Figure 27: Japan Asia Pacific Container Monitoring Market Revenue (Million), by Key Components 2024 & 2032
- Figure 28: Japan Asia Pacific Container Monitoring Market Volume (Billion), by Key Components 2024 & 2032
- Figure 29: Japan Asia Pacific Container Monitoring Market Revenue Share (%), by Key Components 2024 & 2032
- Figure 30: Japan Asia Pacific Container Monitoring Market Volume Share (%), by Key Components 2024 & 2032
- Figure 31: Japan Asia Pacific Container Monitoring Market Revenue (Million), by Key Applications 2024 & 2032
- Figure 32: Japan Asia Pacific Container Monitoring Market Volume (Billion), by Key Applications 2024 & 2032
- Figure 33: Japan Asia Pacific Container Monitoring Market Revenue Share (%), by Key Applications 2024 & 2032
- Figure 34: Japan Asia Pacific Container Monitoring Market Volume Share (%), by Key Applications 2024 & 2032
- Figure 35: Japan Asia Pacific Container Monitoring Market Revenue (Million), by Geography 2024 & 2032
- Figure 36: Japan Asia Pacific Container Monitoring Market Volume (Billion), by Geography 2024 & 2032
- Figure 37: Japan Asia Pacific Container Monitoring Market Revenue Share (%), by Geography 2024 & 2032
- Figure 38: Japan Asia Pacific Container Monitoring Market Volume Share (%), by Geography 2024 & 2032
- Figure 39: Japan Asia Pacific Container Monitoring Market Revenue (Million), by Country 2024 & 2032
- Figure 40: Japan Asia Pacific Container Monitoring Market Volume (Billion), by Country 2024 & 2032
- Figure 41: Japan Asia Pacific Container Monitoring Market Revenue Share (%), by Country 2024 & 2032
- Figure 42: Japan Asia Pacific Container Monitoring Market Volume Share (%), by Country 2024 & 2032
- Figure 43: South Korea Asia Pacific Container Monitoring Market Revenue (Million), by Overall 2024 & 2032
- Figure 44: South Korea Asia Pacific Container Monitoring Market Volume (Billion), by Overall 2024 & 2032
- Figure 45: South Korea Asia Pacific Container Monitoring Market Revenue Share (%), by Overall 2024 & 2032
- Figure 46: South Korea Asia Pacific Container Monitoring Market Volume Share (%), by Overall 2024 & 2032
- Figure 47: South Korea Asia Pacific Container Monitoring Market Revenue (Million), by Key Components 2024 & 2032
- Figure 48: South Korea Asia Pacific Container Monitoring Market Volume (Billion), by Key Components 2024 & 2032
- Figure 49: South Korea Asia Pacific Container Monitoring Market Revenue Share (%), by Key Components 2024 & 2032
- Figure 50: South Korea Asia Pacific Container Monitoring Market Volume Share (%), by Key Components 2024 & 2032
- Figure 51: South Korea Asia Pacific Container Monitoring Market Revenue (Million), by Key Applications 2024 & 2032
- Figure 52: South Korea Asia Pacific Container Monitoring Market Volume (Billion), by Key Applications 2024 & 2032
- Figure 53: South Korea Asia Pacific Container Monitoring Market Revenue Share (%), by Key Applications 2024 & 2032
- Figure 54: South Korea Asia Pacific Container Monitoring Market Volume Share (%), by Key Applications 2024 & 2032
- Figure 55: South Korea Asia Pacific Container Monitoring Market Revenue (Million), by Geography 2024 & 2032
- Figure 56: South Korea Asia Pacific Container Monitoring Market Volume (Billion), by Geography 2024 & 2032
- Figure 57: South Korea Asia Pacific Container Monitoring Market Revenue Share (%), by Geography 2024 & 2032
- Figure 58: South Korea Asia Pacific Container Monitoring Market Volume Share (%), by Geography 2024 & 2032
- Figure 59: South Korea Asia Pacific Container Monitoring Market Revenue (Million), by Country 2024 & 2032
- Figure 60: South Korea Asia Pacific Container Monitoring Market Volume (Billion), by Country 2024 & 2032
- Figure 61: South Korea Asia Pacific Container Monitoring Market Revenue Share (%), by Country 2024 & 2032
- Figure 62: South Korea Asia Pacific Container Monitoring Market Volume Share (%), by Country 2024 & 2032
- Figure 63: Middle East Asia Pacific Container Monitoring Market Revenue (Million), by Overall 2024 & 2032
- Figure 64: Middle East Asia Pacific Container Monitoring Market Volume (Billion), by Overall 2024 & 2032
- Figure 65: Middle East Asia Pacific Container Monitoring Market Revenue Share (%), by Overall 2024 & 2032
- Figure 66: Middle East Asia Pacific Container Monitoring Market Volume Share (%), by Overall 2024 & 2032
- Figure 67: Middle East Asia Pacific Container Monitoring Market Revenue (Million), by Key Components 2024 & 2032
- Figure 68: Middle East Asia Pacific Container Monitoring Market Volume (Billion), by Key Components 2024 & 2032
- Figure 69: Middle East Asia Pacific Container Monitoring Market Revenue Share (%), by Key Components 2024 & 2032
- Figure 70: Middle East Asia Pacific Container Monitoring Market Volume Share (%), by Key Components 2024 & 2032
- Figure 71: Middle East Asia Pacific Container Monitoring Market Revenue (Million), by Key Applications 2024 & 2032
- Figure 72: Middle East Asia Pacific Container Monitoring Market Volume (Billion), by Key Applications 2024 & 2032
- Figure 73: Middle East Asia Pacific Container Monitoring Market Revenue Share (%), by Key Applications 2024 & 2032
- Figure 74: Middle East Asia Pacific Container Monitoring Market Volume Share (%), by Key Applications 2024 & 2032
- Figure 75: Middle East Asia Pacific Container Monitoring Market Revenue (Million), by Geography 2024 & 2032
- Figure 76: Middle East Asia Pacific Container Monitoring Market Volume (Billion), by Geography 2024 & 2032
- Figure 77: Middle East Asia Pacific Container Monitoring Market Revenue Share (%), by Geography 2024 & 2032
- Figure 78: Middle East Asia Pacific Container Monitoring Market Volume Share (%), by Geography 2024 & 2032
- Figure 79: Middle East Asia Pacific Container Monitoring Market Revenue (Million), by Country 2024 & 2032
- Figure 80: Middle East Asia Pacific Container Monitoring Market Volume (Billion), by Country 2024 & 2032
- Figure 81: Middle East Asia Pacific Container Monitoring Market Revenue Share (%), by Country 2024 & 2032
- Figure 82: Middle East Asia Pacific Container Monitoring Market Volume Share (%), by Country 2024 & 2032
- Figure 83: Australia and New Zealand Asia Pacific Container Monitoring Market Revenue (Million), by Overall 2024 & 2032
- Figure 84: Australia and New Zealand Asia Pacific Container Monitoring Market Volume (Billion), by Overall 2024 & 2032
- Figure 85: Australia and New Zealand Asia Pacific Container Monitoring Market Revenue Share (%), by Overall 2024 & 2032
- Figure 86: Australia and New Zealand Asia Pacific Container Monitoring Market Volume Share (%), by Overall 2024 & 2032
- Figure 87: Australia and New Zealand Asia Pacific Container Monitoring Market Revenue (Million), by Key Components 2024 & 2032
- Figure 88: Australia and New Zealand Asia Pacific Container Monitoring Market Volume (Billion), by Key Components 2024 & 2032
- Figure 89: Australia and New Zealand Asia Pacific Container Monitoring Market Revenue Share (%), by Key Components 2024 & 2032
- Figure 90: Australia and New Zealand Asia Pacific Container Monitoring Market Volume Share (%), by Key Components 2024 & 2032
- Figure 91: Australia and New Zealand Asia Pacific Container Monitoring Market Revenue (Million), by Key Applications 2024 & 2032
- Figure 92: Australia and New Zealand Asia Pacific Container Monitoring Market Volume (Billion), by Key Applications 2024 & 2032
- Figure 93: Australia and New Zealand Asia Pacific Container Monitoring Market Revenue Share (%), by Key Applications 2024 & 2032
- Figure 94: Australia and New Zealand Asia Pacific Container Monitoring Market Volume Share (%), by Key Applications 2024 & 2032
- Figure 95: Australia and New Zealand Asia Pacific Container Monitoring Market Revenue (Million), by Geography 2024 & 2032
- Figure 96: Australia and New Zealand Asia Pacific Container Monitoring Market Volume (Billion), by Geography 2024 & 2032
- Figure 97: Australia and New Zealand Asia Pacific Container Monitoring Market Revenue Share (%), by Geography 2024 & 2032
- Figure 98: Australia and New Zealand Asia Pacific Container Monitoring Market Volume Share (%), by Geography 2024 & 2032
- Figure 99: Australia and New Zealand Asia Pacific Container Monitoring Market Revenue (Million), by Country 2024 & 2032
- Figure 100: Australia and New Zealand Asia Pacific Container Monitoring Market Volume (Billion), by Country 2024 & 2032
- Figure 101: Australia and New Zealand Asia Pacific Container Monitoring Market Revenue Share (%), by Country 2024 & 2032
- Figure 102: Australia and New Zealand Asia Pacific Container Monitoring Market Volume Share (%), by Country 2024 & 2032
List of Tables
- Table 1: Global Asia Pacific Container Monitoring Market Revenue Million Forecast, by Region 2019 & 2032
- Table 2: Global Asia Pacific Container Monitoring Market Volume Billion Forecast, by Region 2019 & 2032
- Table 3: Global Asia Pacific Container Monitoring Market Revenue Million Forecast, by Overall 2019 & 2032
- Table 4: Global Asia Pacific Container Monitoring Market Volume Billion Forecast, by Overall 2019 & 2032
- Table 5: Global Asia Pacific Container Monitoring Market Revenue Million Forecast, by Key Components 2019 & 2032
- Table 6: Global Asia Pacific Container Monitoring Market Volume Billion Forecast, by Key Components 2019 & 2032
- Table 7: Global Asia Pacific Container Monitoring Market Revenue Million Forecast, by Key Applications 2019 & 2032
- Table 8: Global Asia Pacific Container Monitoring Market Volume Billion Forecast, by Key Applications 2019 & 2032
- Table 9: Global Asia Pacific Container Monitoring Market Revenue Million Forecast, by Geography 2019 & 2032
- Table 10: Global Asia Pacific Container Monitoring Market Volume Billion Forecast, by Geography 2019 & 2032
- Table 11: Global Asia Pacific Container Monitoring Market Revenue Million Forecast, by Region 2019 & 2032
- Table 12: Global Asia Pacific Container Monitoring Market Volume Billion Forecast, by Region 2019 & 2032
- Table 13: Global Asia Pacific Container Monitoring Market Revenue Million Forecast, by Overall 2019 & 2032
- Table 14: Global Asia Pacific Container Monitoring Market Volume Billion Forecast, by Overall 2019 & 2032
- Table 15: Global Asia Pacific Container Monitoring Market Revenue Million Forecast, by Key Components 2019 & 2032
- Table 16: Global Asia Pacific Container Monitoring Market Volume Billion Forecast, by Key Components 2019 & 2032
- Table 17: Global Asia Pacific Container Monitoring Market Revenue Million Forecast, by Key Applications 2019 & 2032
- Table 18: Global Asia Pacific Container Monitoring Market Volume Billion Forecast, by Key Applications 2019 & 2032
- Table 19: Global Asia Pacific Container Monitoring Market Revenue Million Forecast, by Geography 2019 & 2032
- Table 20: Global Asia Pacific Container Monitoring Market Volume Billion Forecast, by Geography 2019 & 2032
- Table 21: Global Asia Pacific Container Monitoring Market Revenue Million Forecast, by Country 2019 & 2032
- Table 22: Global Asia Pacific Container Monitoring Market Volume Billion Forecast, by Country 2019 & 2032
- Table 23: Global Asia Pacific Container Monitoring Market Revenue Million Forecast, by Overall 2019 & 2032
- Table 24: Global Asia Pacific Container Monitoring Market Volume Billion Forecast, by Overall 2019 & 2032
- Table 25: Global Asia Pacific Container Monitoring Market Revenue Million Forecast, by Key Components 2019 & 2032
- Table 26: Global Asia Pacific Container Monitoring Market Volume Billion Forecast, by Key Components 2019 & 2032
- Table 27: Global Asia Pacific Container Monitoring Market Revenue Million Forecast, by Key Applications 2019 & 2032
- Table 28: Global Asia Pacific Container Monitoring Market Volume Billion Forecast, by Key Applications 2019 & 2032
- Table 29: Global Asia Pacific Container Monitoring Market Revenue Million Forecast, by Geography 2019 & 2032
- Table 30: Global Asia Pacific Container Monitoring Market Volume Billion Forecast, by Geography 2019 & 2032
- Table 31: Global Asia Pacific Container Monitoring Market Revenue Million Forecast, by Country 2019 & 2032
- Table 32: Global Asia Pacific Container Monitoring Market Volume Billion Forecast, by Country 2019 & 2032
- Table 33: Global Asia Pacific Container Monitoring Market Revenue Million Forecast, by Overall 2019 & 2032
- Table 34: Global Asia Pacific Container Monitoring Market Volume Billion Forecast, by Overall 2019 & 2032
- Table 35: Global Asia Pacific Container Monitoring Market Revenue Million Forecast, by Key Components 2019 & 2032
- Table 36: Global Asia Pacific Container Monitoring Market Volume Billion Forecast, by Key Components 2019 & 2032
- Table 37: Global Asia Pacific Container Monitoring Market Revenue Million Forecast, by Key Applications 2019 & 2032
- Table 38: Global Asia Pacific Container Monitoring Market Volume Billion Forecast, by Key Applications 2019 & 2032
- Table 39: Global Asia Pacific Container Monitoring Market Revenue Million Forecast, by Geography 2019 & 2032
- Table 40: Global Asia Pacific Container Monitoring Market Volume Billion Forecast, by Geography 2019 & 2032
- Table 41: Global Asia Pacific Container Monitoring Market Revenue Million Forecast, by Country 2019 & 2032
- Table 42: Global Asia Pacific Container Monitoring Market Volume Billion Forecast, by Country 2019 & 2032
- Table 43: Global Asia Pacific Container Monitoring Market Revenue Million Forecast, by Overall 2019 & 2032
- Table 44: Global Asia Pacific Container Monitoring Market Volume Billion Forecast, by Overall 2019 & 2032
- Table 45: Global Asia Pacific Container Monitoring Market Revenue Million Forecast, by Key Components 2019 & 2032
- Table 46: Global Asia Pacific Container Monitoring Market Volume Billion Forecast, by Key Components 2019 & 2032
- Table 47: Global Asia Pacific Container Monitoring Market Revenue Million Forecast, by Key Applications 2019 & 2032
- Table 48: Global Asia Pacific Container Monitoring Market Volume Billion Forecast, by Key Applications 2019 & 2032
- Table 49: Global Asia Pacific Container Monitoring Market Revenue Million Forecast, by Geography 2019 & 2032
- Table 50: Global Asia Pacific Container Monitoring Market Volume Billion Forecast, by Geography 2019 & 2032
- Table 51: Global Asia Pacific Container Monitoring Market Revenue Million Forecast, by Country 2019 & 2032
- Table 52: Global Asia Pacific Container Monitoring Market Volume Billion Forecast, by Country 2019 & 2032
- Table 53: Global Asia Pacific Container Monitoring Market Revenue Million Forecast, by Overall 2019 & 2032
- Table 54: Global Asia Pacific Container Monitoring Market Volume Billion Forecast, by Overall 2019 & 2032
- Table 55: Global Asia Pacific Container Monitoring Market Revenue Million Forecast, by Key Components 2019 & 2032
- Table 56: Global Asia Pacific Container Monitoring Market Volume Billion Forecast, by Key Components 2019 & 2032
- Table 57: Global Asia Pacific Container Monitoring Market Revenue Million Forecast, by Key Applications 2019 & 2032
- Table 58: Global Asia Pacific Container Monitoring Market Volume Billion Forecast, by Key Applications 2019 & 2032
- Table 59: Global Asia Pacific Container Monitoring Market Revenue Million Forecast, by Geography 2019 & 2032
- Table 60: Global Asia Pacific Container Monitoring Market Volume Billion Forecast, by Geography 2019 & 2032
- Table 61: Global Asia Pacific Container Monitoring Market Revenue Million Forecast, by Country 2019 & 2032
- Table 62: Global Asia Pacific Container Monitoring Market Volume Billion Forecast, by Country 2019 & 2032
Frequently Asked Questions
1. What is the projected Compound Annual Growth Rate (CAGR) of the Asia Pacific Container Monitoring Market?
The projected CAGR is approximately 16.38%.
2. Which companies are prominent players in the Asia Pacific Container Monitoring Market?
Key companies in the market include ORBCOMM Inc, Geoforce Inc, Globe Tracker ApS, Phillips Connect Technologies (Phillips Industries Inc ), Emerson Electric Co, Hapag-Lloyd AG, TRAXENS, Roambee Corporation, OnAsset Intelligence Inc, Zabbix LLC *List Not Exhaustive.
3. What are the main segments of the Asia Pacific Container Monitoring Market?
The market segments include Overall , Key Components, Key Applications, Geography.
4. Can you provide details about the market size?
The market size is estimated to be USD 2.26 Million as of 2022.
5. What are some drivers contributing to market growth?
Surge in Advanced Containment Materials and Structural Innovations; Increase in Seaborne Trade; Increase in Demand to Enhanced Supply Chain Efficiency.
6. What are the notable trends driving market growth?
Container Monitoring to be a Key Driver for Growth in Logistics and Supply Chain Management.
7. Are there any restraints impacting market growth?
Surge in Advanced Containment Materials and Structural Innovations; Increase in Seaborne Trade; Increase in Demand to Enhanced Supply Chain Efficiency.
8. Can you provide examples of recent developments in the market?
September 2024: ZIM Integrated Shipping Services Ltd., a container liner shipping company, announced that it has entered into a new long-term operational cooperation with Mediterranean Shipping Company (MSC) on the Asia - US East Coast and Asia - US Gulf trades. The new services are scheduled to be launched in February 2025, subject to regulatory approvals and filings. This important collaboration reflects ZIM's commitment to both delivering an outstanding shipping solution to its customers and taking continuous proactive steps to enhance efficiencies in their network. It is the direct outcome of their fleet renewal program which has greatly enhanced ZIM's competitive position, particularly on the Asia to US East Coast tradeSeptember 2024: Kalmar has signed an agreement with ContainerCo, a key independent container depot operator in New Zealand, to supply six Kalmar empty container handlers. ContainerCo has grown to become one of the key independent container depots in New Zealand, offering an extensive range of products and services to countless commercial and private customers. The company’s offering includes shipping container sales and leasing, container modification, depot services and container transportation services. The current ContainerCo fleet includes 12 Kalmar empty container handlers.
9. What pricing options are available for accessing the report?
Pricing options include single-user, multi-user, and enterprise licenses priced at USD 4750, USD 5250, and USD 8750 respectively.
10. Is the market size provided in terms of value or volume?
The market size is provided in terms of value, measured in Million and volume, measured in Billion.
11. Are there any specific market keywords associated with the report?
Yes, the market keyword associated with the report is "Asia Pacific Container Monitoring Market," which aids in identifying and referencing the specific market segment covered.
12. How do I determine which pricing option suits my needs best?
The pricing options vary based on user requirements and access needs. Individual users may opt for single-user licenses, while businesses requiring broader access may choose multi-user or enterprise licenses for cost-effective access to the report.
13. Are there any additional resources or data provided in the Asia Pacific Container Monitoring Market report?
While the report offers comprehensive insights, it's advisable to review the specific contents or supplementary materials provided to ascertain if additional resources or data are available.
14. How can I stay updated on further developments or reports in the Asia Pacific Container Monitoring Market?
To stay informed about further developments, trends, and reports in the Asia Pacific Container Monitoring Market, consider subscribing to industry newsletters, following relevant companies and organizations, or regularly checking reputable industry news sources and publications.
Methodology
Step 1 - Identification of Relevant Samples Size from Population Database


Step 2 - Approaches for Defining Global Market Size (Value, Volume* & Price*)

Note*: In applicable scenarios
Step 3 - Data Sources
Primary Research
- Web Analytics
- Survey Reports
- Research Institute
- Latest Research Reports
- Opinion Leaders
Secondary Research
- Annual Reports
- White Paper
- Latest Press Release
- Industry Association
- Paid Database
- Investor Presentations

Step 4 - Data Triangulation
Involves using different sources of information in order to increase the validity of a study
These sources are likely to be stakeholders in a program - participants, other researchers, program staff, other community members, and so on.
Then we put all data in single framework & apply various statistical tools to find out the dynamic on the market.
During the analysis stage, feedback from the stakeholder groups would be compared to determine areas of agreement as well as areas of divergence
