

Key Insights
The global power plant uranium market, while exhibiting fluctuations influenced by geopolitical events and energy policy shifts, is projected for steady growth over the forecast period (2025-2033). The base year of 2025 serves as a crucial benchmark, reflecting a market size likely driven by existing nuclear power plant operations and ongoing construction projects worldwide. Considering the historical period (2019-2024), we can infer a moderate growth rate, possibly influenced by factors such as increasing energy demand, concerns about climate change leading to a sustained interest in nuclear power as a low-carbon energy source, and advancements in nuclear reactor technology. However, challenges remain, including the ongoing debate surrounding nuclear waste disposal, stricter regulatory environments in some regions, and the inherent price volatility of uranium itself, linked to global supply and demand dynamics. This combination of factors will likely result in a continuous, though perhaps not explosive, expansion of the market throughout the forecast period.
Looking forward, several key drivers will shape the market’s trajectory. Growing concerns about climate change and the need for reliable baseload power will fuel demand for nuclear energy, subsequently increasing the demand for uranium. Technological advancements leading to enhanced efficiency and safety in nuclear reactors will also contribute to growth. However, potential risks include heightened political instability in uranium-producing regions which could lead to supply chain disruptions and price fluctuations. Furthermore, the continued development and deployment of renewable energy technologies could present competition to nuclear power and potentially moderate growth in the market. A careful analysis of these competing factors will be crucial in accurately forecasting the market's development over the next decade.
Global Power Plant Uranium Market Report: 2019-2033
This comprehensive report provides an in-depth analysis of the global power plant uranium market, encompassing market dynamics, growth trends, regional dominance, product landscape, and key players. The report covers the period from 2019 to 2033, with 2025 as the base year and a forecast period spanning 2025-2033. This detailed analysis serves as an invaluable resource for industry professionals, investors, and strategic decision-makers seeking to navigate this crucial energy sector. The parent market is the global nuclear fuel market, and the child market is the power plant uranium segment within it.
Global Power Plant Uranium Market Market Dynamics & Structure
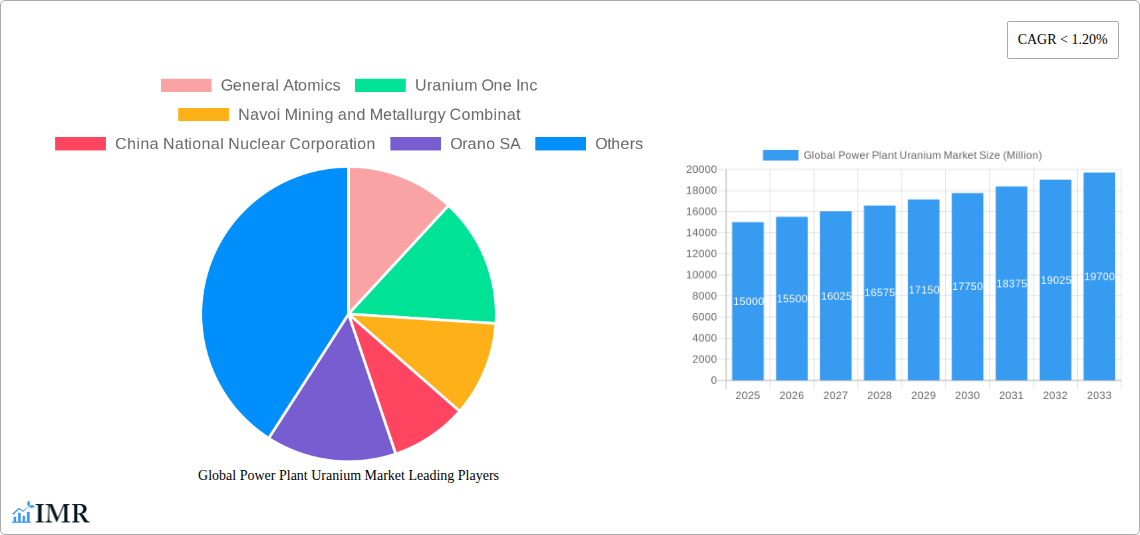
This section analyzes the market's competitive landscape, technological advancements, regulatory influences, and market trends. The global power plant uranium market is characterized by a moderately concentrated structure, with key players holding significant market shares. Technological innovation, driven by the need for improved reactor efficiency and reduced waste, is a major force shaping the market.
- Market Concentration: The top 10 players account for approximately xx% of the global market share in 2025.
- Technological Innovation: Focus on advanced reactor designs (e.g., Generation IV reactors) and uranium enrichment technologies influences market dynamics. Significant barriers to entry exist due to high capital investment requirements and stringent safety regulations.
- Regulatory Frameworks: Nuclear safety regulations and international agreements governing uranium trade significantly impact market growth and access. Variations in regulatory policies across different countries influence market access and competitiveness.
- Competitive Product Substitutes: Renewable energy sources, such as solar and wind power, represent significant competitive pressures. However, the reliability and baseload power generation capabilities of nuclear power remain a key advantage.
- End-User Demographics: The primary end-users are utilities and independent power producers (IPPs). The growth of nuclear power in emerging economies drives market expansion.
- M&A Trends: The number of mergers and acquisitions in the uranium sector has been approximately xx deals annually in recent years, reflecting industry consolidation and strategic resource acquisition efforts.
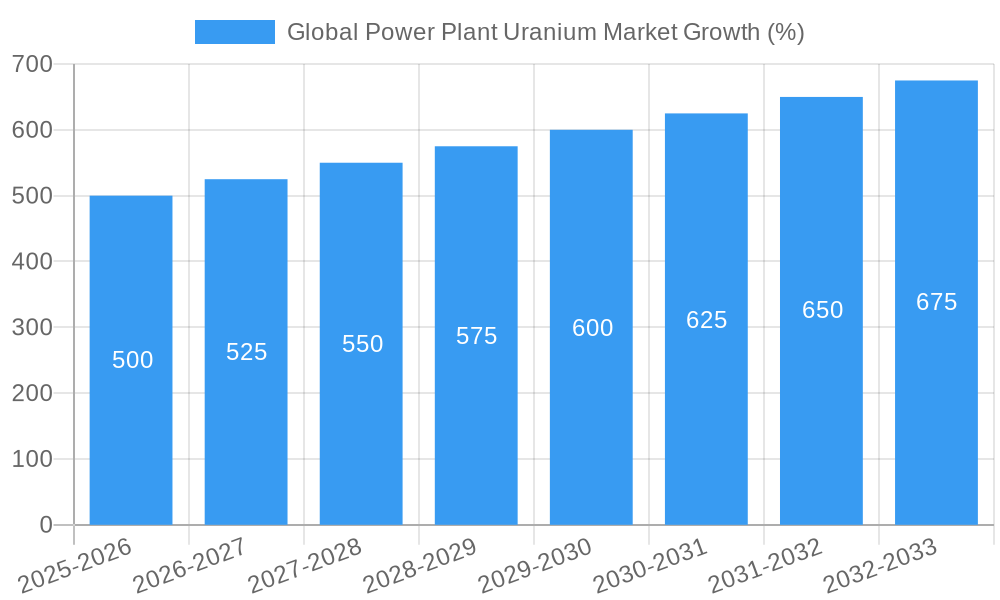
Global Power Plant Uranium Market Growth Trends & Insights
The global power plant uranium market experienced a xx Million units value in 2024, exhibiting a CAGR of xx% during the historical period (2019-2024). The market is projected to reach xx Million units by 2033, driven by increasing energy demand, government support for nuclear power in several countries, and advancements in reactor technology. Adoption rates vary across regions, with a higher concentration in established nuclear energy markets. Technological disruptions, such as the development of advanced reactor designs, are expected to further shape market growth. Consumer behavior is influenced by factors such as safety concerns, environmental regulations, and cost competitiveness.
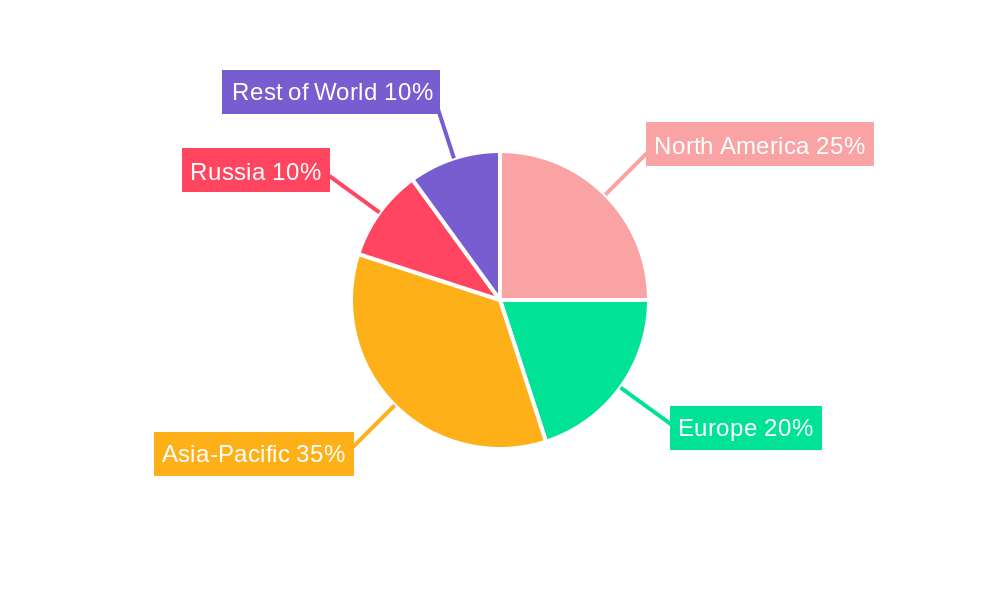
Dominant Regions, Countries, or Segments in Global Power Plant Uranium Market
The Asia-Pacific region is projected to dominate the global power plant uranium market throughout the forecast period, driven by substantial investments in nuclear power infrastructure in countries like India and China. Within the product types, enriched uranium holds a larger market share compared to natural uranium due to its higher application in nuclear reactors. Pressurized Water Reactors (PWRs) account for the largest share among reactor applications. Utilities form the largest end-user segment.
- Key Drivers in Asia-Pacific:
- Significant investment in new nuclear power plants.
- Government policies promoting nuclear energy as a low-carbon source.
- Increasing electricity demand.
- Dominance Factors:
- High market share in Asia-Pacific attributed to substantial nuclear power expansion projects.
- Growth potential in emerging markets in Asia-Pacific and other regions.
- Technological advancements in reactor designs.
Global Power Plant Uranium Market Product Landscape
The power plant uranium market encompasses natural uranium and enriched uranium. Product innovations center on improving uranium enrichment processes to enhance efficiency and reduce costs, as well as developing new fuel designs to improve reactor performance. The key performance metrics include enrichment level, isotopic purity, and fuel burnup.
Key Drivers, Barriers & Challenges in Global Power Plant Uranium Market
Key Drivers:
- Increasing global energy demand necessitates reliable and low-carbon energy sources.
- Government support and policies promoting nuclear energy to mitigate climate change.
- Advancements in reactor technology enhance safety and efficiency.
Key Challenges:
- Supply chain vulnerabilities and geopolitical risks influence uranium price volatility.
- Stringent safety regulations and environmental concerns necessitate high capital investment and meticulous operation.
- Intense competition from renewable energy sources.
Emerging Opportunities in Global Power Plant Uranium Market
- Growth in emerging economies with expanding electricity demands presents significant market opportunities.
- Development of advanced reactor designs reduces waste and enhances safety, opening new market avenues.
- Investment in uranium exploration and mining in new regions can potentially mitigate supply chain risks.
Growth Accelerators in the Global Power Plant Uranium Market Industry
Technological breakthroughs in reactor designs and enrichment processes are key growth accelerators. Strategic partnerships between technology providers and nuclear power operators facilitate market expansion. Government initiatives promoting nuclear energy contribute significantly to market growth.
Key Players Shaping the Global Power Plant Uranium Market Market
- General Atomics
- Uranium One Inc
- Navoi Mining and Metallurgy Combinat
- China National Nuclear Corporation
- Orano SA
- China General Nuclear Power Group (CGN)
- ARMZ Uranium Holding Co
- Cameco Corporation
- NAC Kazatomprom JSC
- BHP Group Ltd
Notable Milestones in Global Power Plant Uranium Market Sector
- March 2022: India announced the import of 100 tonnes of natural uranium and 133 fuel assemblies.
- April 2022: Approval for the construction of 10 indigenous 700 MW Pressurized Heavy Water Reactors in India.
In-Depth Global Power Plant Uranium Market Market Outlook
The global power plant uranium market is poised for significant growth, driven by increasing energy demand, government support, and technological advancements. Strategic partnerships and investments in advanced reactor technologies will further shape market dynamics. Opportunities exist in emerging markets and the development of innovative fuel designs. The market is expected to exhibit robust growth throughout the forecast period (2025-2033).
Global Power Plant Uranium Market Segmentation
- 1. North America
- 2. Asia-Pacific
- 3. Europe
- 4. Middle-East and Africa
- 5. South America
Global Power Plant Uranium Market Segmentation By Geography
-
1. North America
- 1.1. United States
- 1.2. Canada
- 1.3. Mexico
-
2. South America
- 2.1. Brazil
- 2.2. Argentina
- 2.3. Rest of South America
-
3. Europe
- 3.1. United Kingdom
- 3.2. Germany
- 3.3. France
- 3.4. Italy
- 3.5. Spain
- 3.6. Russia
- 3.7. Benelux
- 3.8. Nordics
- 3.9. Rest of Europe
-
4. Middle East & Africa
- 4.1. Turkey
- 4.2. Israel
- 4.3. GCC
- 4.4. North Africa
- 4.5. South Africa
- 4.6. Rest of Middle East & Africa
-
5. Asia Pacific
- 5.1. China
- 5.2. India
- 5.3. Japan
- 5.4. South Korea
- 5.5. ASEAN
- 5.6. Oceania
- 5.7. Rest of Asia Pacific
Global Power Plant Uranium Market REPORT HIGHLIGHTS
| Aspects | Details |
|---|---|
| Study Period | 2019-2033 |
| Base Year | 2024 |
| Estimated Year | 2025 |
| Forecast Period | 2025-2033 |
| Historical Period | 2019-2024 |
| Growth Rate | CAGR of < 1.20% from 2019-2033 |
| Segmentation |
|
Table of Contents
- 1. Introduction
- 1.1. Research Scope
- 1.2. Market Segmentation
- 1.3. Research Methodology
- 1.4. Definitions and Assumptions
- 2. Executive Summary
- 2.1. Introduction
- 3. Market Dynamics
- 3.1. Introduction
- 3.2. Market Drivers
- 3.2.1 4.; Increasing Amount of Waste Generation
- 3.2.2 Growing Concern for Waste Management to Meet the Needs for Sustainable Urban Living4.; Increasing Focus on Non-fossil Fuel Sources of Energy
- 3.3. Market Restrains
- 3.3.1. 4.; Expensive Nature of Incinerators
- 3.4. Market Trends
- 3.4.1. Renewable Energy Likely to Restraint the Market Growth
- 4. Market Factor Analysis
- 4.1. Porters Five Forces
- 4.2. Supply/Value Chain
- 4.3. PESTEL analysis
- 4.4. Market Entropy
- 4.5. Patent/Trademark Analysis
- 5. Global Power Plant Uranium Market Analysis, Insights and Forecast, 2019-2031
- 5.1. Market Analysis, Insights and Forecast - by North America
- 5.2. Market Analysis, Insights and Forecast - by Asia-Pacific
- 5.3. Market Analysis, Insights and Forecast - by Europe
- 5.4. Market Analysis, Insights and Forecast - by Middle-East and Africa
- 5.5. Market Analysis, Insights and Forecast - by South America
- 5.6. Market Analysis, Insights and Forecast - by Region
- 5.6.1. North America
- 5.6.2. South America
- 5.6.3. Europe
- 5.6.4. Middle East & Africa
- 5.6.5. Asia Pacific
- 5.1. Market Analysis, Insights and Forecast - by North America
- 6. North America Global Power Plant Uranium Market Analysis, Insights and Forecast, 2019-2031
- 6.1. Market Analysis, Insights and Forecast - by North America
- 6.2. Market Analysis, Insights and Forecast - by Asia-Pacific
- 6.3. Market Analysis, Insights and Forecast - by Europe
- 6.4. Market Analysis, Insights and Forecast - by Middle-East and Africa
- 6.5. Market Analysis, Insights and Forecast - by South America
- 6.1. Market Analysis, Insights and Forecast - by North America
- 7. South America Global Power Plant Uranium Market Analysis, Insights and Forecast, 2019-2031
- 7.1. Market Analysis, Insights and Forecast - by North America
- 7.2. Market Analysis, Insights and Forecast - by Asia-Pacific
- 7.3. Market Analysis, Insights and Forecast - by Europe
- 7.4. Market Analysis, Insights and Forecast - by Middle-East and Africa
- 7.5. Market Analysis, Insights and Forecast - by South America
- 7.1. Market Analysis, Insights and Forecast - by North America
- 8. Europe Global Power Plant Uranium Market Analysis, Insights and Forecast, 2019-2031
- 8.1. Market Analysis, Insights and Forecast - by North America
- 8.2. Market Analysis, Insights and Forecast - by Asia-Pacific
- 8.3. Market Analysis, Insights and Forecast - by Europe
- 8.4. Market Analysis, Insights and Forecast - by Middle-East and Africa
- 8.5. Market Analysis, Insights and Forecast - by South America
- 8.1. Market Analysis, Insights and Forecast - by North America
- 9. Middle East & Africa Global Power Plant Uranium Market Analysis, Insights and Forecast, 2019-2031
- 9.1. Market Analysis, Insights and Forecast - by North America
- 9.2. Market Analysis, Insights and Forecast - by Asia-Pacific
- 9.3. Market Analysis, Insights and Forecast - by Europe
- 9.4. Market Analysis, Insights and Forecast - by Middle-East and Africa
- 9.5. Market Analysis, Insights and Forecast - by South America
- 9.1. Market Analysis, Insights and Forecast - by North America
- 10. Asia Pacific Global Power Plant Uranium Market Analysis, Insights and Forecast, 2019-2031
- 10.1. Market Analysis, Insights and Forecast - by North America
- 10.2. Market Analysis, Insights and Forecast - by Asia-Pacific
- 10.3. Market Analysis, Insights and Forecast - by Europe
- 10.4. Market Analysis, Insights and Forecast - by Middle-East and Africa
- 10.5. Market Analysis, Insights and Forecast - by South America
- 10.1. Market Analysis, Insights and Forecast - by North America
- 11. North America Global Power Plant Uranium Market Analysis, Insights and Forecast, 2019-2031
- 11.1. Market Analysis, Insights and Forecast - By Country/Sub-region
- 11.1.1 United States
- 11.1.2 Canada
- 11.1.3 Mexico
- 12. Europe Global Power Plant Uranium Market Analysis, Insights and Forecast, 2019-2031
- 12.1. Market Analysis, Insights and Forecast - By Country/Sub-region
- 12.1.1 Germany
- 12.1.2 United Kingdom
- 12.1.3 France
- 12.1.4 Spain
- 12.1.5 Italy
- 12.1.6 Spain
- 12.1.7 Belgium
- 12.1.8 Netherland
- 12.1.9 Nordics
- 12.1.10 Rest of Europe
- 13. Asia Pacific Global Power Plant Uranium Market Analysis, Insights and Forecast, 2019-2031
- 13.1. Market Analysis, Insights and Forecast - By Country/Sub-region
- 13.1.1 China
- 13.1.2 Japan
- 13.1.3 India
- 13.1.4 South Korea
- 13.1.5 Southeast Asia
- 13.1.6 Australia
- 13.1.7 Indonesia
- 13.1.8 Phillipes
- 13.1.9 Singapore
- 13.1.10 Thailandc
- 13.1.11 Rest of Asia Pacific
- 14. South America Global Power Plant Uranium Market Analysis, Insights and Forecast, 2019-2031
- 14.1. Market Analysis, Insights and Forecast - By Country/Sub-region
- 14.1.1 Brazil
- 14.1.2 Argentina
- 14.1.3 Peru
- 14.1.4 Chile
- 14.1.5 Colombia
- 14.1.6 Ecuador
- 14.1.7 Venezuela
- 14.1.8 Rest of South America
- 15. MEA Global Power Plant Uranium Market Analysis, Insights and Forecast, 2019-2031
- 15.1. Market Analysis, Insights and Forecast - By Country/Sub-region
- 15.1.1 United Arab Emirates
- 15.1.2 Saudi Arabia
- 15.1.3 South Africa
- 15.1.4 Rest of Middle East and Africa
- 16. Competitive Analysis
- 16.1. Market Share Analysis 2024
- 16.2. Company Profiles
- 16.2.1 General Atomics
- 16.2.1.1. Overview
- 16.2.1.2. Products
- 16.2.1.3. SWOT Analysis
- 16.2.1.4. Recent Developments
- 16.2.1.5. Financials (Based on Availability)
- 16.2.2 Uranium One Inc
- 16.2.2.1. Overview
- 16.2.2.2. Products
- 16.2.2.3. SWOT Analysis
- 16.2.2.4. Recent Developments
- 16.2.2.5. Financials (Based on Availability)
- 16.2.3 Navoi Mining and Metallurgy Combinat
- 16.2.3.1. Overview
- 16.2.3.2. Products
- 16.2.3.3. SWOT Analysis
- 16.2.3.4. Recent Developments
- 16.2.3.5. Financials (Based on Availability)
- 16.2.4 China National Nuclear Corporation
- 16.2.4.1. Overview
- 16.2.4.2. Products
- 16.2.4.3. SWOT Analysis
- 16.2.4.4. Recent Developments
- 16.2.4.5. Financials (Based on Availability)
- 16.2.5 Orano SA
- 16.2.5.1. Overview
- 16.2.5.2. Products
- 16.2.5.3. SWOT Analysis
- 16.2.5.4. Recent Developments
- 16.2.5.5. Financials (Based on Availability)
- 16.2.6 China General Nuclear Power Group (CGN)
- 16.2.6.1. Overview
- 16.2.6.2. Products
- 16.2.6.3. SWOT Analysis
- 16.2.6.4. Recent Developments
- 16.2.6.5. Financials (Based on Availability)
- 16.2.7 ARMZ Uranium Holding Co
- 16.2.7.1. Overview
- 16.2.7.2. Products
- 16.2.7.3. SWOT Analysis
- 16.2.7.4. Recent Developments
- 16.2.7.5. Financials (Based on Availability)
- 16.2.8 Cameco Corporation
- 16.2.8.1. Overview
- 16.2.8.2. Products
- 16.2.8.3. SWOT Analysis
- 16.2.8.4. Recent Developments
- 16.2.8.5. Financials (Based on Availability)
- 16.2.9 NAC Kazatomprom JSC
- 16.2.9.1. Overview
- 16.2.9.2. Products
- 16.2.9.3. SWOT Analysis
- 16.2.9.4. Recent Developments
- 16.2.9.5. Financials (Based on Availability)
- 16.2.10 BHP Group Ltd
- 16.2.10.1. Overview
- 16.2.10.2. Products
- 16.2.10.3. SWOT Analysis
- 16.2.10.4. Recent Developments
- 16.2.10.5. Financials (Based on Availability)
- 16.2.1 General Atomics
List of Figures
- Figure 1: Global Global Power Plant Uranium Market Revenue Breakdown (Million, %) by Region 2024 & 2032
- Figure 2: North America Global Power Plant Uranium Market Revenue (Million), by Country 2024 & 2032
- Figure 3: North America Global Power Plant Uranium Market Revenue Share (%), by Country 2024 & 2032
- Figure 4: Europe Global Power Plant Uranium Market Revenue (Million), by Country 2024 & 2032
- Figure 5: Europe Global Power Plant Uranium Market Revenue Share (%), by Country 2024 & 2032
- Figure 6: Asia Pacific Global Power Plant Uranium Market Revenue (Million), by Country 2024 & 2032
- Figure 7: Asia Pacific Global Power Plant Uranium Market Revenue Share (%), by Country 2024 & 2032
- Figure 8: South America Global Power Plant Uranium Market Revenue (Million), by Country 2024 & 2032
- Figure 9: South America Global Power Plant Uranium Market Revenue Share (%), by Country 2024 & 2032
- Figure 10: MEA Global Power Plant Uranium Market Revenue (Million), by Country 2024 & 2032
- Figure 11: MEA Global Power Plant Uranium Market Revenue Share (%), by Country 2024 & 2032
- Figure 12: North America Global Power Plant Uranium Market Revenue (Million), by North America 2024 & 2032
- Figure 13: North America Global Power Plant Uranium Market Revenue Share (%), by North America 2024 & 2032
- Figure 14: North America Global Power Plant Uranium Market Revenue (Million), by Asia-Pacific 2024 & 2032
- Figure 15: North America Global Power Plant Uranium Market Revenue Share (%), by Asia-Pacific 2024 & 2032
- Figure 16: North America Global Power Plant Uranium Market Revenue (Million), by Europe 2024 & 2032
- Figure 17: North America Global Power Plant Uranium Market Revenue Share (%), by Europe 2024 & 2032
- Figure 18: North America Global Power Plant Uranium Market Revenue (Million), by Middle-East and Africa 2024 & 2032
- Figure 19: North America Global Power Plant Uranium Market Revenue Share (%), by Middle-East and Africa 2024 & 2032
- Figure 20: North America Global Power Plant Uranium Market Revenue (Million), by South America 2024 & 2032
- Figure 21: North America Global Power Plant Uranium Market Revenue Share (%), by South America 2024 & 2032
- Figure 22: North America Global Power Plant Uranium Market Revenue (Million), by Country 2024 & 2032
- Figure 23: North America Global Power Plant Uranium Market Revenue Share (%), by Country 2024 & 2032
- Figure 24: South America Global Power Plant Uranium Market Revenue (Million), by North America 2024 & 2032
- Figure 25: South America Global Power Plant Uranium Market Revenue Share (%), by North America 2024 & 2032
- Figure 26: South America Global Power Plant Uranium Market Revenue (Million), by Asia-Pacific 2024 & 2032
- Figure 27: South America Global Power Plant Uranium Market Revenue Share (%), by Asia-Pacific 2024 & 2032
- Figure 28: South America Global Power Plant Uranium Market Revenue (Million), by Europe 2024 & 2032
- Figure 29: South America Global Power Plant Uranium Market Revenue Share (%), by Europe 2024 & 2032
- Figure 30: South America Global Power Plant Uranium Market Revenue (Million), by Middle-East and Africa 2024 & 2032
- Figure 31: South America Global Power Plant Uranium Market Revenue Share (%), by Middle-East and Africa 2024 & 2032
- Figure 32: South America Global Power Plant Uranium Market Revenue (Million), by South America 2024 & 2032
- Figure 33: South America Global Power Plant Uranium Market Revenue Share (%), by South America 2024 & 2032
- Figure 34: South America Global Power Plant Uranium Market Revenue (Million), by Country 2024 & 2032
- Figure 35: South America Global Power Plant Uranium Market Revenue Share (%), by Country 2024 & 2032
- Figure 36: Europe Global Power Plant Uranium Market Revenue (Million), by North America 2024 & 2032
- Figure 37: Europe Global Power Plant Uranium Market Revenue Share (%), by North America 2024 & 2032
- Figure 38: Europe Global Power Plant Uranium Market Revenue (Million), by Asia-Pacific 2024 & 2032
- Figure 39: Europe Global Power Plant Uranium Market Revenue Share (%), by Asia-Pacific 2024 & 2032
- Figure 40: Europe Global Power Plant Uranium Market Revenue (Million), by Europe 2024 & 2032
- Figure 41: Europe Global Power Plant Uranium Market Revenue Share (%), by Europe 2024 & 2032
- Figure 42: Europe Global Power Plant Uranium Market Revenue (Million), by Middle-East and Africa 2024 & 2032
- Figure 43: Europe Global Power Plant Uranium Market Revenue Share (%), by Middle-East and Africa 2024 & 2032
- Figure 44: Europe Global Power Plant Uranium Market Revenue (Million), by South America 2024 & 2032
- Figure 45: Europe Global Power Plant Uranium Market Revenue Share (%), by South America 2024 & 2032
- Figure 46: Europe Global Power Plant Uranium Market Revenue (Million), by Country 2024 & 2032
- Figure 47: Europe Global Power Plant Uranium Market Revenue Share (%), by Country 2024 & 2032
- Figure 48: Middle East & Africa Global Power Plant Uranium Market Revenue (Million), by North America 2024 & 2032
- Figure 49: Middle East & Africa Global Power Plant Uranium Market Revenue Share (%), by North America 2024 & 2032
- Figure 50: Middle East & Africa Global Power Plant Uranium Market Revenue (Million), by Asia-Pacific 2024 & 2032
- Figure 51: Middle East & Africa Global Power Plant Uranium Market Revenue Share (%), by Asia-Pacific 2024 & 2032
- Figure 52: Middle East & Africa Global Power Plant Uranium Market Revenue (Million), by Europe 2024 & 2032
- Figure 53: Middle East & Africa Global Power Plant Uranium Market Revenue Share (%), by Europe 2024 & 2032
- Figure 54: Middle East & Africa Global Power Plant Uranium Market Revenue (Million), by Middle-East and Africa 2024 & 2032
- Figure 55: Middle East & Africa Global Power Plant Uranium Market Revenue Share (%), by Middle-East and Africa 2024 & 2032
- Figure 56: Middle East & Africa Global Power Plant Uranium Market Revenue (Million), by South America 2024 & 2032
- Figure 57: Middle East & Africa Global Power Plant Uranium Market Revenue Share (%), by South America 2024 & 2032
- Figure 58: Middle East & Africa Global Power Plant Uranium Market Revenue (Million), by Country 2024 & 2032
- Figure 59: Middle East & Africa Global Power Plant Uranium Market Revenue Share (%), by Country 2024 & 2032
- Figure 60: Asia Pacific Global Power Plant Uranium Market Revenue (Million), by North America 2024 & 2032
- Figure 61: Asia Pacific Global Power Plant Uranium Market Revenue Share (%), by North America 2024 & 2032
- Figure 62: Asia Pacific Global Power Plant Uranium Market Revenue (Million), by Asia-Pacific 2024 & 2032
- Figure 63: Asia Pacific Global Power Plant Uranium Market Revenue Share (%), by Asia-Pacific 2024 & 2032
- Figure 64: Asia Pacific Global Power Plant Uranium Market Revenue (Million), by Europe 2024 & 2032
- Figure 65: Asia Pacific Global Power Plant Uranium Market Revenue Share (%), by Europe 2024 & 2032
- Figure 66: Asia Pacific Global Power Plant Uranium Market Revenue (Million), by Middle-East and Africa 2024 & 2032
- Figure 67: Asia Pacific Global Power Plant Uranium Market Revenue Share (%), by Middle-East and Africa 2024 & 2032
- Figure 68: Asia Pacific Global Power Plant Uranium Market Revenue (Million), by South America 2024 & 2032
- Figure 69: Asia Pacific Global Power Plant Uranium Market Revenue Share (%), by South America 2024 & 2032
- Figure 70: Asia Pacific Global Power Plant Uranium Market Revenue (Million), by Country 2024 & 2032
- Figure 71: Asia Pacific Global Power Plant Uranium Market Revenue Share (%), by Country 2024 & 2032
List of Tables
- Table 1: Global Power Plant Uranium Market Revenue Million Forecast, by Region 2019 & 2032
- Table 2: Global Power Plant Uranium Market Revenue Million Forecast, by North America 2019 & 2032
- Table 3: Global Power Plant Uranium Market Revenue Million Forecast, by Asia-Pacific 2019 & 2032
- Table 4: Global Power Plant Uranium Market Revenue Million Forecast, by Europe 2019 & 2032
- Table 5: Global Power Plant Uranium Market Revenue Million Forecast, by Middle-East and Africa 2019 & 2032
- Table 6: Global Power Plant Uranium Market Revenue Million Forecast, by South America 2019 & 2032
- Table 7: Global Power Plant Uranium Market Revenue Million Forecast, by Region 2019 & 2032
- Table 8: Global Power Plant Uranium Market Revenue Million Forecast, by Country 2019 & 2032
- Table 9: United States Global Power Plant Uranium Market Revenue (Million) Forecast, by Application 2019 & 2032
- Table 10: Canada Global Power Plant Uranium Market Revenue (Million) Forecast, by Application 2019 & 2032
- Table 11: Mexico Global Power Plant Uranium Market Revenue (Million) Forecast, by Application 2019 & 2032
- Table 12: Global Power Plant Uranium Market Revenue Million Forecast, by Country 2019 & 2032
- Table 13: Germany Global Power Plant Uranium Market Revenue (Million) Forecast, by Application 2019 & 2032
- Table 14: United Kingdom Global Power Plant Uranium Market Revenue (Million) Forecast, by Application 2019 & 2032
- Table 15: France Global Power Plant Uranium Market Revenue (Million) Forecast, by Application 2019 & 2032
- Table 16: Spain Global Power Plant Uranium Market Revenue (Million) Forecast, by Application 2019 & 2032
- Table 17: Italy Global Power Plant Uranium Market Revenue (Million) Forecast, by Application 2019 & 2032
- Table 18: Spain Global Power Plant Uranium Market Revenue (Million) Forecast, by Application 2019 & 2032
- Table 19: Belgium Global Power Plant Uranium Market Revenue (Million) Forecast, by Application 2019 & 2032
- Table 20: Netherland Global Power Plant Uranium Market Revenue (Million) Forecast, by Application 2019 & 2032
- Table 21: Nordics Global Power Plant Uranium Market Revenue (Million) Forecast, by Application 2019 & 2032
- Table 22: Rest of Europe Global Power Plant Uranium Market Revenue (Million) Forecast, by Application 2019 & 2032
- Table 23: Global Power Plant Uranium Market Revenue Million Forecast, by Country 2019 & 2032
- Table 24: China Global Power Plant Uranium Market Revenue (Million) Forecast, by Application 2019 & 2032
- Table 25: Japan Global Power Plant Uranium Market Revenue (Million) Forecast, by Application 2019 & 2032
- Table 26: India Global Power Plant Uranium Market Revenue (Million) Forecast, by Application 2019 & 2032
- Table 27: South Korea Global Power Plant Uranium Market Revenue (Million) Forecast, by Application 2019 & 2032
- Table 28: Southeast Asia Global Power Plant Uranium Market Revenue (Million) Forecast, by Application 2019 & 2032
- Table 29: Australia Global Power Plant Uranium Market Revenue (Million) Forecast, by Application 2019 & 2032
- Table 30: Indonesia Global Power Plant Uranium Market Revenue (Million) Forecast, by Application 2019 & 2032
- Table 31: Phillipes Global Power Plant Uranium Market Revenue (Million) Forecast, by Application 2019 & 2032
- Table 32: Singapore Global Power Plant Uranium Market Revenue (Million) Forecast, by Application 2019 & 2032
- Table 33: Thailandc Global Power Plant Uranium Market Revenue (Million) Forecast, by Application 2019 & 2032
- Table 34: Rest of Asia Pacific Global Power Plant Uranium Market Revenue (Million) Forecast, by Application 2019 & 2032
- Table 35: Global Power Plant Uranium Market Revenue Million Forecast, by Country 2019 & 2032
- Table 36: Brazil Global Power Plant Uranium Market Revenue (Million) Forecast, by Application 2019 & 2032
- Table 37: Argentina Global Power Plant Uranium Market Revenue (Million) Forecast, by Application 2019 & 2032
- Table 38: Peru Global Power Plant Uranium Market Revenue (Million) Forecast, by Application 2019 & 2032
- Table 39: Chile Global Power Plant Uranium Market Revenue (Million) Forecast, by Application 2019 & 2032
- Table 40: Colombia Global Power Plant Uranium Market Revenue (Million) Forecast, by Application 2019 & 2032
- Table 41: Ecuador Global Power Plant Uranium Market Revenue (Million) Forecast, by Application 2019 & 2032
- Table 42: Venezuela Global Power Plant Uranium Market Revenue (Million) Forecast, by Application 2019 & 2032
- Table 43: Rest of South America Global Power Plant Uranium Market Revenue (Million) Forecast, by Application 2019 & 2032
- Table 44: Global Power Plant Uranium Market Revenue Million Forecast, by Country 2019 & 2032
- Table 45: United Arab Emirates Global Power Plant Uranium Market Revenue (Million) Forecast, by Application 2019 & 2032
- Table 46: Saudi Arabia Global Power Plant Uranium Market Revenue (Million) Forecast, by Application 2019 & 2032
- Table 47: South Africa Global Power Plant Uranium Market Revenue (Million) Forecast, by Application 2019 & 2032
- Table 48: Rest of Middle East and Africa Global Power Plant Uranium Market Revenue (Million) Forecast, by Application 2019 & 2032
- Table 49: Global Power Plant Uranium Market Revenue Million Forecast, by North America 2019 & 2032
- Table 50: Global Power Plant Uranium Market Revenue Million Forecast, by Asia-Pacific 2019 & 2032
- Table 51: Global Power Plant Uranium Market Revenue Million Forecast, by Europe 2019 & 2032
- Table 52: Global Power Plant Uranium Market Revenue Million Forecast, by Middle-East and Africa 2019 & 2032
- Table 53: Global Power Plant Uranium Market Revenue Million Forecast, by South America 2019 & 2032
- Table 54: Global Power Plant Uranium Market Revenue Million Forecast, by Country 2019 & 2032
- Table 55: United States Global Power Plant Uranium Market Revenue (Million) Forecast, by Application 2019 & 2032
- Table 56: Canada Global Power Plant Uranium Market Revenue (Million) Forecast, by Application 2019 & 2032
- Table 57: Mexico Global Power Plant Uranium Market Revenue (Million) Forecast, by Application 2019 & 2032
- Table 58: Global Power Plant Uranium Market Revenue Million Forecast, by North America 2019 & 2032
- Table 59: Global Power Plant Uranium Market Revenue Million Forecast, by Asia-Pacific 2019 & 2032
- Table 60: Global Power Plant Uranium Market Revenue Million Forecast, by Europe 2019 & 2032
- Table 61: Global Power Plant Uranium Market Revenue Million Forecast, by Middle-East and Africa 2019 & 2032
- Table 62: Global Power Plant Uranium Market Revenue Million Forecast, by South America 2019 & 2032
- Table 63: Global Power Plant Uranium Market Revenue Million Forecast, by Country 2019 & 2032
- Table 64: Brazil Global Power Plant Uranium Market Revenue (Million) Forecast, by Application 2019 & 2032
- Table 65: Argentina Global Power Plant Uranium Market Revenue (Million) Forecast, by Application 2019 & 2032
- Table 66: Rest of South America Global Power Plant Uranium Market Revenue (Million) Forecast, by Application 2019 & 2032
- Table 67: Global Power Plant Uranium Market Revenue Million Forecast, by North America 2019 & 2032
- Table 68: Global Power Plant Uranium Market Revenue Million Forecast, by Asia-Pacific 2019 & 2032
- Table 69: Global Power Plant Uranium Market Revenue Million Forecast, by Europe 2019 & 2032
- Table 70: Global Power Plant Uranium Market Revenue Million Forecast, by Middle-East and Africa 2019 & 2032
- Table 71: Global Power Plant Uranium Market Revenue Million Forecast, by South America 2019 & 2032
- Table 72: Global Power Plant Uranium Market Revenue Million Forecast, by Country 2019 & 2032
- Table 73: United Kingdom Global Power Plant Uranium Market Revenue (Million) Forecast, by Application 2019 & 2032
- Table 74: Germany Global Power Plant Uranium Market Revenue (Million) Forecast, by Application 2019 & 2032
- Table 75: France Global Power Plant Uranium Market Revenue (Million) Forecast, by Application 2019 & 2032
- Table 76: Italy Global Power Plant Uranium Market Revenue (Million) Forecast, by Application 2019 & 2032
- Table 77: Spain Global Power Plant Uranium Market Revenue (Million) Forecast, by Application 2019 & 2032
- Table 78: Russia Global Power Plant Uranium Market Revenue (Million) Forecast, by Application 2019 & 2032
- Table 79: Benelux Global Power Plant Uranium Market Revenue (Million) Forecast, by Application 2019 & 2032
- Table 80: Nordics Global Power Plant Uranium Market Revenue (Million) Forecast, by Application 2019 & 2032
- Table 81: Rest of Europe Global Power Plant Uranium Market Revenue (Million) Forecast, by Application 2019 & 2032
- Table 82: Global Power Plant Uranium Market Revenue Million Forecast, by North America 2019 & 2032
- Table 83: Global Power Plant Uranium Market Revenue Million Forecast, by Asia-Pacific 2019 & 2032
- Table 84: Global Power Plant Uranium Market Revenue Million Forecast, by Europe 2019 & 2032
- Table 85: Global Power Plant Uranium Market Revenue Million Forecast, by Middle-East and Africa 2019 & 2032
- Table 86: Global Power Plant Uranium Market Revenue Million Forecast, by South America 2019 & 2032
- Table 87: Global Power Plant Uranium Market Revenue Million Forecast, by Country 2019 & 2032
- Table 88: Turkey Global Power Plant Uranium Market Revenue (Million) Forecast, by Application 2019 & 2032
- Table 89: Israel Global Power Plant Uranium Market Revenue (Million) Forecast, by Application 2019 & 2032
- Table 90: GCC Global Power Plant Uranium Market Revenue (Million) Forecast, by Application 2019 & 2032
- Table 91: North Africa Global Power Plant Uranium Market Revenue (Million) Forecast, by Application 2019 & 2032
- Table 92: South Africa Global Power Plant Uranium Market Revenue (Million) Forecast, by Application 2019 & 2032
- Table 93: Rest of Middle East & Africa Global Power Plant Uranium Market Revenue (Million) Forecast, by Application 2019 & 2032
- Table 94: Global Power Plant Uranium Market Revenue Million Forecast, by North America 2019 & 2032
- Table 95: Global Power Plant Uranium Market Revenue Million Forecast, by Asia-Pacific 2019 & 2032
- Table 96: Global Power Plant Uranium Market Revenue Million Forecast, by Europe 2019 & 2032
- Table 97: Global Power Plant Uranium Market Revenue Million Forecast, by Middle-East and Africa 2019 & 2032
- Table 98: Global Power Plant Uranium Market Revenue Million Forecast, by South America 2019 & 2032
- Table 99: Global Power Plant Uranium Market Revenue Million Forecast, by Country 2019 & 2032
- Table 100: China Global Power Plant Uranium Market Revenue (Million) Forecast, by Application 2019 & 2032
- Table 101: India Global Power Plant Uranium Market Revenue (Million) Forecast, by Application 2019 & 2032
- Table 102: Japan Global Power Plant Uranium Market Revenue (Million) Forecast, by Application 2019 & 2032
- Table 103: South Korea Global Power Plant Uranium Market Revenue (Million) Forecast, by Application 2019 & 2032
- Table 104: ASEAN Global Power Plant Uranium Market Revenue (Million) Forecast, by Application 2019 & 2032
- Table 105: Oceania Global Power Plant Uranium Market Revenue (Million) Forecast, by Application 2019 & 2032
- Table 106: Rest of Asia Pacific Global Power Plant Uranium Market Revenue (Million) Forecast, by Application 2019 & 2032
Frequently Asked Questions
1. What is the projected Compound Annual Growth Rate (CAGR) of the Global Power Plant Uranium Market?
The projected CAGR is approximately < 1.20%.
2. Which companies are prominent players in the Global Power Plant Uranium Market?
Key companies in the market include General Atomics, Uranium One Inc, Navoi Mining and Metallurgy Combinat, China National Nuclear Corporation, Orano SA, China General Nuclear Power Group (CGN), ARMZ Uranium Holding Co, Cameco Corporation, NAC Kazatomprom JSC, BHP Group Ltd.
3. What are the main segments of the Global Power Plant Uranium Market?
The market segments include North America, Asia-Pacific, Europe, Middle-East and Africa, South America.
4. Can you provide details about the market size?
The market size is estimated to be USD XX Million as of 2022.
5. What are some drivers contributing to market growth?
4.; Increasing Amount of Waste Generation. Growing Concern for Waste Management to Meet the Needs for Sustainable Urban Living4.; Increasing Focus on Non-fossil Fuel Sources of Energy.
6. What are the notable trends driving market growth?
Renewable Energy Likely to Restraint the Market Growth.
7. Are there any restraints impacting market growth?
4.; Expensive Nature of Incinerators.
8. Can you provide examples of recent developments in the market?
In March 2022, India announced to import nearly 100 tonnes of natural uranium and 133 units of fuel assemblies in the FY 2022-23. The uranium is likely to be imported from Canada, Kazakhstan, Russia, and Uzbekistan.
9. What pricing options are available for accessing the report?
Pricing options include single-user, multi-user, and enterprise licenses priced at USD 4750, USD 5250, and USD 8750 respectively.
10. Is the market size provided in terms of value or volume?
The market size is provided in terms of value, measured in Million.
11. Are there any specific market keywords associated with the report?
Yes, the market keyword associated with the report is "Global Power Plant Uranium Market," which aids in identifying and referencing the specific market segment covered.
12. How do I determine which pricing option suits my needs best?
The pricing options vary based on user requirements and access needs. Individual users may opt for single-user licenses, while businesses requiring broader access may choose multi-user or enterprise licenses for cost-effective access to the report.
13. Are there any additional resources or data provided in the Global Power Plant Uranium Market report?
While the report offers comprehensive insights, it's advisable to review the specific contents or supplementary materials provided to ascertain if additional resources or data are available.
14. How can I stay updated on further developments or reports in the Global Power Plant Uranium Market?
To stay informed about further developments, trends, and reports in the Global Power Plant Uranium Market, consider subscribing to industry newsletters, following relevant companies and organizations, or regularly checking reputable industry news sources and publications.
Methodology
Step 1 - Identification of Relevant Samples Size from Population Database


Step 2 - Approaches for Defining Global Market Size (Value, Volume* & Price*)

Note*: In applicable scenarios
Step 3 - Data Sources
Primary Research
- Web Analytics
- Survey Reports
- Research Institute
- Latest Research Reports
- Opinion Leaders
Secondary Research
- Annual Reports
- White Paper
- Latest Press Release
- Industry Association
- Paid Database
- Investor Presentations

Step 4 - Data Triangulation
Involves using different sources of information in order to increase the validity of a study
These sources are likely to be stakeholders in a program - participants, other researchers, program staff, other community members, and so on.
Then we put all data in single framework & apply various statistical tools to find out the dynamic on the market.
During the analysis stage, feedback from the stakeholder groups would be compared to determine areas of agreement as well as areas of divergence
