

Key Insights
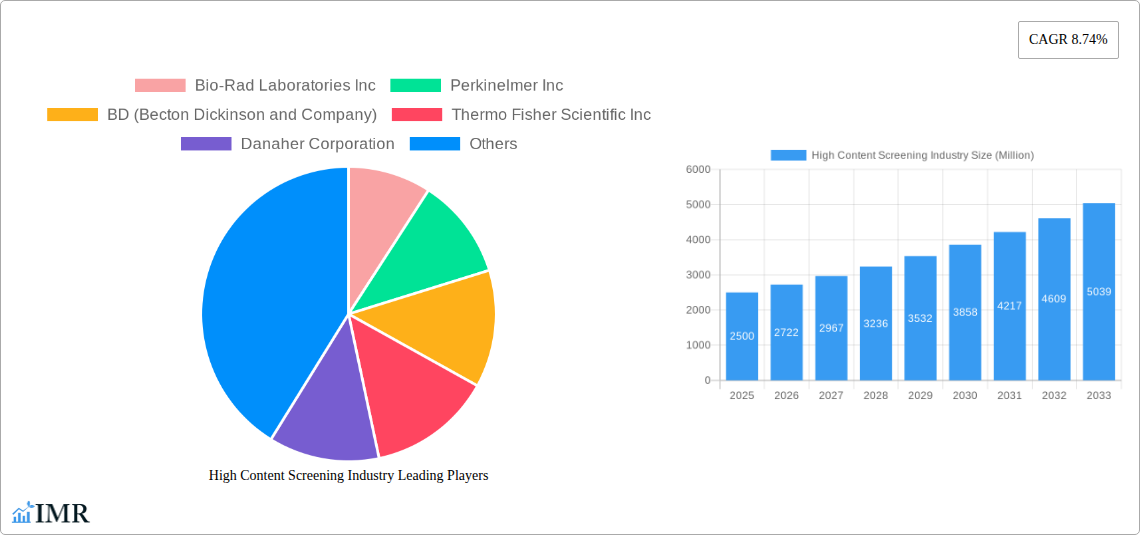
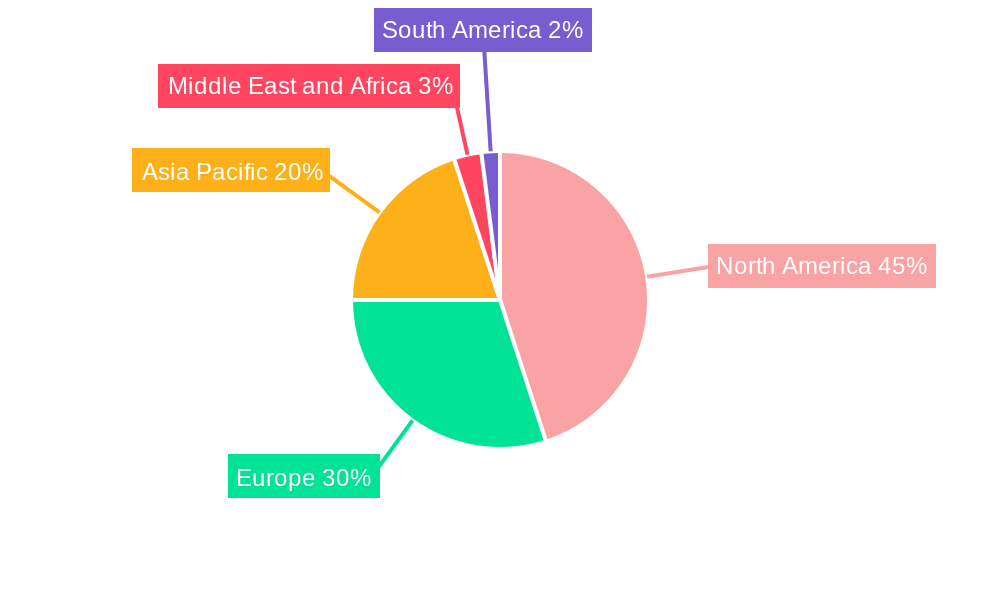
The High Content Screening (HCS) market is experiencing robust growth, driven by the increasing demand for faster and more efficient drug discovery and development processes within the pharmaceutical and biotechnology industries. The market's expansion is fueled by several key factors, including the rising prevalence of chronic diseases necessitating new therapeutic interventions, advancements in imaging technologies and automation leading to higher throughput and data analysis capabilities, and the growing adoption of personalized medicine approaches. The substantial investments in research and development by major pharmaceutical and biotechnology companies further contribute to the market's expansion. While the market is segmented across various products (instruments, consumables, software, services) and applications (primary/secondary screening, target identification, toxicity studies, etc.), the instruments segment, encompassing flow cytometers and other advanced imaging systems, is expected to hold a significant share due to its crucial role in high-throughput screening. The substantial presence of major players like Bio-Rad, PerkinElmer, BD, Thermo Fisher, and Danaher signifies a competitive yet innovative landscape. North America currently dominates the market, given the concentration of pharmaceutical companies and research institutions. However, Asia-Pacific is poised for significant growth, driven by increasing research funding and technological advancements in emerging economies like China and India.
The challenges faced by the HCS market include the high cost of instrumentation and consumables, the need for specialized expertise in data analysis, and the potential for regulatory hurdles in drug development. However, the ongoing technological innovations, coupled with the increasing collaboration between pharmaceutical companies and CROs (Contract Research Organizations), are expected to mitigate these challenges. The market is projected to exhibit sustained growth over the forecast period (2025-2033), with a focus on developing more sophisticated and integrated solutions that address the needs for higher throughput, improved data analysis, and reduced costs. The expansion into new applications, such as exploring novel therapeutic targets and personalized medicine strategies, will further drive market expansion and create new opportunities for market participants. This growth will be distributed across the various geographic regions, but with a particular focus on the rapidly developing markets in Asia and other emerging economies.
High Content Screening (HCS) Industry Market Report: 2019-2033
This comprehensive report provides an in-depth analysis of the High Content Screening (HCS) industry, encompassing market dynamics, growth trends, regional performance, product landscape, key players, and future outlook. The report covers the period 2019-2033, with a base year of 2025 and a forecast period of 2025-2033. It analyzes the parent market of Life Science Research and the child market of High Content Screening. The report is essential for industry professionals, investors, and researchers seeking a clear understanding of this rapidly evolving market.
High Content Screening Industry Market Dynamics & Structure
The HCS market is characterized by a moderately concentrated landscape, with key players like Thermo Fisher Scientific, Danaher Corporation, and PerkinElmer holding significant market share (estimated at xx% collectively in 2025). Technological innovation, particularly in imaging, AI-powered analysis, and automation, is a major driver. Stringent regulatory frameworks, especially concerning data security and compliance, shape industry practices. Competitive pressures stem from substitute technologies like traditional high-throughput screening (HTS) and emerging alternatives. End-user demographics are dominated by pharmaceutical and biotechnology companies, followed by academic and government institutions. M&A activity has been moderate, with approximately xx deals recorded between 2019 and 2024, primarily focused on enhancing technological capabilities and expanding market reach.
- Market Concentration: Moderately concentrated, with top players holding xx% market share in 2025.
- Technological Innovation: AI integration, advanced imaging technologies, and automated workflows are key drivers.
- Regulatory Landscape: Stringent regulations concerning data privacy and validation impact market growth.
- Competitive Substitutes: Traditional HTS methods and emerging alternatives present competitive pressure.
- M&A Activity: Approximately xx deals between 2019-2024, mostly for technological advancement and expansion.
- End-user Demographics: Pharmaceutical and Biotechnology companies are primary users, followed by academic and government research institutions.
High Content Screening Industry Growth Trends & Insights
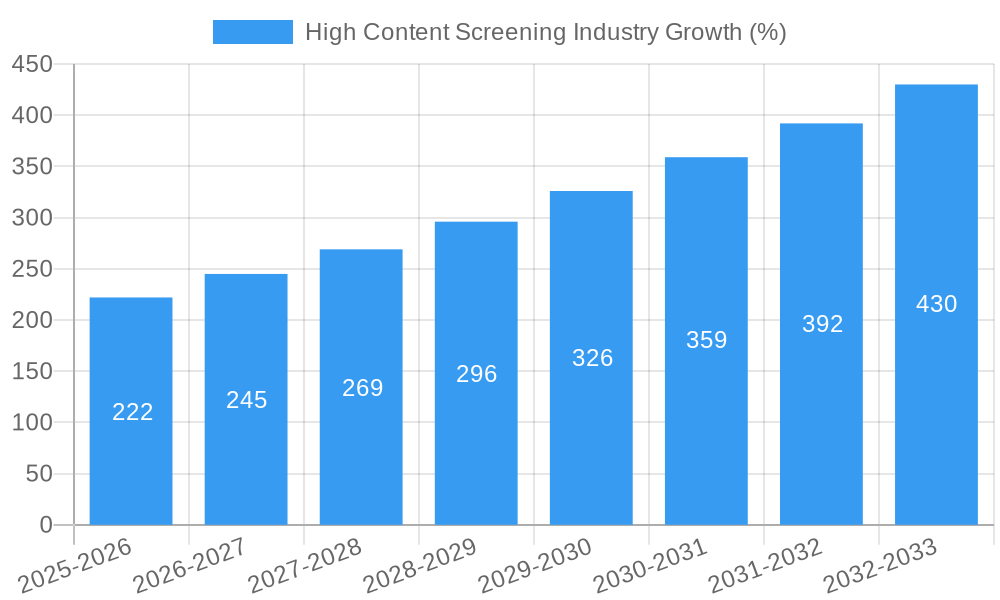
The HCS market experienced robust growth during the historical period (2019-2024), with a CAGR of xx%. This growth is attributed to increased demand for drug discovery and development, personalized medicine initiatives, and rising adoption of HCS in academic research. Technological advancements like high-content imaging and AI-powered data analysis have significantly improved the efficiency and throughput of HCS experiments. Market penetration across various applications (drug discovery, toxicity testing, etc.) is steadily increasing, driving market expansion. Future growth is projected to be driven by the continued development of novel therapeutics, increasing government funding for R&D, and the growing prevalence of chronic diseases. Adoption of cloud-based data management and analysis platforms will further accelerate growth.
Dominant Regions, Countries, or Segments in High Content Screening Industry
North America currently dominates the HCS market, followed by Europe and Asia Pacific. This dominance is primarily driven by a strong presence of major pharmaceutical and biotechnology companies, well-established research infrastructure, and significant investments in R&D. Within product segments, instruments contribute the largest share of market revenue (approximately xx Million in 2025), followed by consumables (xx Million). Among applications, drug discovery and target identification remain the largest segments (xx Million and xx Million respectively in 2025). Contract Research Organizations (CROs) are also a major end-user segment.
- North America: Strong pharmaceutical industry, advanced research infrastructure.
- Europe: Growing investment in life sciences and drug development.
- Asia Pacific: Expanding pharmaceutical sector, rising government funding.
- Dominant Segments: Instruments (xx Million in 2025), Consumables (xx Million in 2025), Drug Discovery Application.
High Content Screening Industry Product Landscape
The HCS product landscape is characterized by sophisticated instruments integrating advanced imaging, automation, and data analysis capabilities. Recent innovations include AI-powered image analysis software and high-throughput screening platforms designed to handle large sample volumes. Unique selling propositions often center on ease of use, high data quality, and streamlined workflows. Continuous technological advancements are pushing the boundaries of resolution, sensitivity, and throughput, leading to more comprehensive and efficient analysis.
Key Drivers, Barriers & Challenges in High Content Screening Industry
Key Drivers:
- Rising demand for drug discovery and development.
- Increasing adoption of personalized medicine.
- Technological advancements in imaging and data analysis.
- Growing government funding for R&D.
Key Challenges:
- High initial investment costs for instruments.
- Complexity of data analysis and interpretation.
- Regulatory hurdles and compliance requirements.
- Competition from alternative screening technologies. This reduces potential market share by approximately xx% annually.
Emerging Opportunities in High Content Screening Industry
- Expansion into emerging markets (e.g., Latin America, Africa).
- Development of innovative applications in areas like disease diagnostics and personalized medicine.
- Integration of HCS with other technologies (e.g., omics technologies, AI).
- Growth in cloud-based HCS platforms and services.
Growth Accelerators in the High Content Screening Industry
Technological breakthroughs, strategic partnerships, and market expansion into untapped regions and applications are key growth accelerators. The increasing adoption of cloud computing and AI/machine learning in HCS is driving efficiency and scalability, further boosting the market. Moreover, collaborative ventures between HCS providers and pharmaceutical companies are accelerating the development of innovative solutions and applications.
Key Players Shaping the High Content Screening Industry Market
- Bio-Rad Laboratories Inc
- PerkinElmer Inc
- BD (Becton Dickinson and Company)
- Thermo Fisher Scientific Inc
- Danaher Corporation
- Merck KGaA
- Yokogawa Electric Corporation
- Agilent Technologies
Notable Milestones in High Content Screening Industry Sector
- September 2022: BD (Becton, Dickinson and Company) launched BD Research Cloud, a cloud-based software solution for streamlining flow cytometry workflows, improving efficiency and data accessibility.
- April 2022: Sysmex Europe launched the CE-IVD-marked Flow Cytometer XF-1600, enhancing clinical flow cytometry capabilities.
In-Depth High Content Screening Industry Market Outlook
The HCS market is poised for continued strong growth, driven by technological innovation and the rising demand for efficient drug discovery and development. Strategic partnerships and expansion into new markets will further fuel this growth. The integration of AI and cloud technologies will play a crucial role in shaping the future of HCS, enabling more advanced analysis and improved accessibility. The market presents significant opportunities for companies offering innovative solutions and services in this dynamic sector.
High Content Screening Industry Segmentation
-
1. Product
-
1.1. Instruments
- 1.1.1. Cell Imaging and Analysis Systems
- 1.1.2. Flow Cytometers
-
1.2. Consumables
- 1.2.1. Reagents and Assay Kits
- 1.2.2. Microplates
- 1.2.3. Other Consumables
- 1.3. Software
- 1.4. Services
-
1.1. Instruments
-
2. Application
- 2.1. Primary and Secondary Screening
- 2.2. Target Identification and Validation
- 2.3. Toxicity Studies
- 2.4. Compound Profiling
- 2.5. Other Applications
-
3. End User
- 3.1. Pharmaceutical and Biotechnology Companies
- 3.2. Academic and Government Institutions
- 3.3. Contract Research Organization
High Content Screening Industry Segmentation By Geography
-
1. North America
- 1.1. United States
- 1.2. Canada
- 1.3. Mexico
-
2. Europe
- 2.1. Germany
- 2.2. United Kingdom
- 2.3. France
- 2.4. Italy
- 2.5. Spain
- 2.6. Rest of Europe
-
3. Asia Pacific
- 3.1. China
- 3.2. Japan
- 3.3. India
- 3.4. Australia
- 3.5. South Korea
- 3.6. Rest of Asia Pacific
-
4. Middle East and Africa
- 4.1. GCC
- 4.2. South Africa
- 4.3. Rest of Middle East and Africa
-
5. South America
- 5.1. Brazil
- 5.2. Argentina
- 5.3. Rest of South America
High Content Screening Industry REPORT HIGHLIGHTS
| Aspects | Details |
|---|---|
| Study Period | 2019-2033 |
| Base Year | 2024 |
| Estimated Year | 2025 |
| Forecast Period | 2025-2033 |
| Historical Period | 2019-2024 |
| Growth Rate | CAGR of 8.74% from 2019-2033 |
| Segmentation |
|
Table of Contents
- 1. Introduction
- 1.1. Research Scope
- 1.2. Market Segmentation
- 1.3. Research Methodology
- 1.4. Definitions and Assumptions
- 2. Executive Summary
- 2.1. Introduction
- 3. Market Dynamics
- 3.1. Introduction
- 3.2. Market Drivers
- 3.2.1. Government Funding and Venture Capital Investments Across Developed Markets; Increasing Applications of High Content Screening in Life Science Research; Advancements in Informatic Solutions and Imaging Systems
- 3.3. Market Restrains
- 3.3.1. Lower Adoption of High Content Screening Instruments Due to Their High Prices
- 3.4. Market Trends
- 3.4.1. Flow Cytometry is Expected to Hold a Significant Market Share Over The Forecast Period
- 4. Market Factor Analysis
- 4.1. Porters Five Forces
- 4.2. Supply/Value Chain
- 4.3. PESTEL analysis
- 4.4. Market Entropy
- 4.5. Patent/Trademark Analysis
- 5. Global High Content Screening Industry Analysis, Insights and Forecast, 2019-2031
- 5.1. Market Analysis, Insights and Forecast - by Product
- 5.1.1. Instruments
- 5.1.1.1. Cell Imaging and Analysis Systems
- 5.1.1.2. Flow Cytometers
- 5.1.2. Consumables
- 5.1.2.1. Reagents and Assay Kits
- 5.1.2.2. Microplates
- 5.1.2.3. Other Consumables
- 5.1.3. Software
- 5.1.4. Services
- 5.1.1. Instruments
- 5.2. Market Analysis, Insights and Forecast - by Application
- 5.2.1. Primary and Secondary Screening
- 5.2.2. Target Identification and Validation
- 5.2.3. Toxicity Studies
- 5.2.4. Compound Profiling
- 5.2.5. Other Applications
- 5.3. Market Analysis, Insights and Forecast - by End User
- 5.3.1. Pharmaceutical and Biotechnology Companies
- 5.3.2. Academic and Government Institutions
- 5.3.3. Contract Research Organization
- 5.4. Market Analysis, Insights and Forecast - by Region
- 5.4.1. North America
- 5.4.2. Europe
- 5.4.3. Asia Pacific
- 5.4.4. Middle East and Africa
- 5.4.5. South America
- 5.1. Market Analysis, Insights and Forecast - by Product
- 6. North America High Content Screening Industry Analysis, Insights and Forecast, 2019-2031
- 6.1. Market Analysis, Insights and Forecast - by Product
- 6.1.1. Instruments
- 6.1.1.1. Cell Imaging and Analysis Systems
- 6.1.1.2. Flow Cytometers
- 6.1.2. Consumables
- 6.1.2.1. Reagents and Assay Kits
- 6.1.2.2. Microplates
- 6.1.2.3. Other Consumables
- 6.1.3. Software
- 6.1.4. Services
- 6.1.1. Instruments
- 6.2. Market Analysis, Insights and Forecast - by Application
- 6.2.1. Primary and Secondary Screening
- 6.2.2. Target Identification and Validation
- 6.2.3. Toxicity Studies
- 6.2.4. Compound Profiling
- 6.2.5. Other Applications
- 6.3. Market Analysis, Insights and Forecast - by End User
- 6.3.1. Pharmaceutical and Biotechnology Companies
- 6.3.2. Academic and Government Institutions
- 6.3.3. Contract Research Organization
- 6.1. Market Analysis, Insights and Forecast - by Product
- 7. Europe High Content Screening Industry Analysis, Insights and Forecast, 2019-2031
- 7.1. Market Analysis, Insights and Forecast - by Product
- 7.1.1. Instruments
- 7.1.1.1. Cell Imaging and Analysis Systems
- 7.1.1.2. Flow Cytometers
- 7.1.2. Consumables
- 7.1.2.1. Reagents and Assay Kits
- 7.1.2.2. Microplates
- 7.1.2.3. Other Consumables
- 7.1.3. Software
- 7.1.4. Services
- 7.1.1. Instruments
- 7.2. Market Analysis, Insights and Forecast - by Application
- 7.2.1. Primary and Secondary Screening
- 7.2.2. Target Identification and Validation
- 7.2.3. Toxicity Studies
- 7.2.4. Compound Profiling
- 7.2.5. Other Applications
- 7.3. Market Analysis, Insights and Forecast - by End User
- 7.3.1. Pharmaceutical and Biotechnology Companies
- 7.3.2. Academic and Government Institutions
- 7.3.3. Contract Research Organization
- 7.1. Market Analysis, Insights and Forecast - by Product
- 8. Asia Pacific High Content Screening Industry Analysis, Insights and Forecast, 2019-2031
- 8.1. Market Analysis, Insights and Forecast - by Product
- 8.1.1. Instruments
- 8.1.1.1. Cell Imaging and Analysis Systems
- 8.1.1.2. Flow Cytometers
- 8.1.2. Consumables
- 8.1.2.1. Reagents and Assay Kits
- 8.1.2.2. Microplates
- 8.1.2.3. Other Consumables
- 8.1.3. Software
- 8.1.4. Services
- 8.1.1. Instruments
- 8.2. Market Analysis, Insights and Forecast - by Application
- 8.2.1. Primary and Secondary Screening
- 8.2.2. Target Identification and Validation
- 8.2.3. Toxicity Studies
- 8.2.4. Compound Profiling
- 8.2.5. Other Applications
- 8.3. Market Analysis, Insights and Forecast - by End User
- 8.3.1. Pharmaceutical and Biotechnology Companies
- 8.3.2. Academic and Government Institutions
- 8.3.3. Contract Research Organization
- 8.1. Market Analysis, Insights and Forecast - by Product
- 9. Middle East and Africa High Content Screening Industry Analysis, Insights and Forecast, 2019-2031
- 9.1. Market Analysis, Insights and Forecast - by Product
- 9.1.1. Instruments
- 9.1.1.1. Cell Imaging and Analysis Systems
- 9.1.1.2. Flow Cytometers
- 9.1.2. Consumables
- 9.1.2.1. Reagents and Assay Kits
- 9.1.2.2. Microplates
- 9.1.2.3. Other Consumables
- 9.1.3. Software
- 9.1.4. Services
- 9.1.1. Instruments
- 9.2. Market Analysis, Insights and Forecast - by Application
- 9.2.1. Primary and Secondary Screening
- 9.2.2. Target Identification and Validation
- 9.2.3. Toxicity Studies
- 9.2.4. Compound Profiling
- 9.2.5. Other Applications
- 9.3. Market Analysis, Insights and Forecast - by End User
- 9.3.1. Pharmaceutical and Biotechnology Companies
- 9.3.2. Academic and Government Institutions
- 9.3.3. Contract Research Organization
- 9.1. Market Analysis, Insights and Forecast - by Product
- 10. South America High Content Screening Industry Analysis, Insights and Forecast, 2019-2031
- 10.1. Market Analysis, Insights and Forecast - by Product
- 10.1.1. Instruments
- 10.1.1.1. Cell Imaging and Analysis Systems
- 10.1.1.2. Flow Cytometers
- 10.1.2. Consumables
- 10.1.2.1. Reagents and Assay Kits
- 10.1.2.2. Microplates
- 10.1.2.3. Other Consumables
- 10.1.3. Software
- 10.1.4. Services
- 10.1.1. Instruments
- 10.2. Market Analysis, Insights and Forecast - by Application
- 10.2.1. Primary and Secondary Screening
- 10.2.2. Target Identification and Validation
- 10.2.3. Toxicity Studies
- 10.2.4. Compound Profiling
- 10.2.5. Other Applications
- 10.3. Market Analysis, Insights and Forecast - by End User
- 10.3.1. Pharmaceutical and Biotechnology Companies
- 10.3.2. Academic and Government Institutions
- 10.3.3. Contract Research Organization
- 10.1. Market Analysis, Insights and Forecast - by Product
- 11. North America High Content Screening Industry Analysis, Insights and Forecast, 2019-2031
- 11.1. Market Analysis, Insights and Forecast - By Country/Sub-region
- 11.1.1 United States
- 11.1.2 Canada
- 11.1.3 Mexico
- 12. Europe High Content Screening Industry Analysis, Insights and Forecast, 2019-2031
- 12.1. Market Analysis, Insights and Forecast - By Country/Sub-region
- 12.1.1 Germany
- 12.1.2 United Kingdom
- 12.1.3 France
- 12.1.4 Italy
- 12.1.5 Spain
- 12.1.6 Rest of Europe
- 13. Asia Pacific High Content Screening Industry Analysis, Insights and Forecast, 2019-2031
- 13.1. Market Analysis, Insights and Forecast - By Country/Sub-region
- 13.1.1 China
- 13.1.2 Japan
- 13.1.3 India
- 13.1.4 Australia
- 13.1.5 South Korea
- 13.1.6 Rest of Asia Pacific
- 14. Middle East and Africa High Content Screening Industry Analysis, Insights and Forecast, 2019-2031
- 14.1. Market Analysis, Insights and Forecast - By Country/Sub-region
- 14.1.1 GCC
- 14.1.2 South Africa
- 14.1.3 Rest of Middle East and Africa
- 15. South America High Content Screening Industry Analysis, Insights and Forecast, 2019-2031
- 15.1. Market Analysis, Insights and Forecast - By Country/Sub-region
- 15.1.1 Brazil
- 15.1.2 Argentina
- 15.1.3 Rest of South America
- 16. Competitive Analysis
- 16.1. Global Market Share Analysis 2024
- 16.2. Company Profiles
- 16.2.1 Bio-Rad Laboratories Inc
- 16.2.1.1. Overview
- 16.2.1.2. Products
- 16.2.1.3. SWOT Analysis
- 16.2.1.4. Recent Developments
- 16.2.1.5. Financials (Based on Availability)
- 16.2.2 Perkinelmer Inc
- 16.2.2.1. Overview
- 16.2.2.2. Products
- 16.2.2.3. SWOT Analysis
- 16.2.2.4. Recent Developments
- 16.2.2.5. Financials (Based on Availability)
- 16.2.3 BD (Becton Dickinson and Company)
- 16.2.3.1. Overview
- 16.2.3.2. Products
- 16.2.3.3. SWOT Analysis
- 16.2.3.4. Recent Developments
- 16.2.3.5. Financials (Based on Availability)
- 16.2.4 Thermo Fisher Scientific Inc
- 16.2.4.1. Overview
- 16.2.4.2. Products
- 16.2.4.3. SWOT Analysis
- 16.2.4.4. Recent Developments
- 16.2.4.5. Financials (Based on Availability)
- 16.2.5 Danaher Corporation
- 16.2.5.1. Overview
- 16.2.5.2. Products
- 16.2.5.3. SWOT Analysis
- 16.2.5.4. Recent Developments
- 16.2.5.5. Financials (Based on Availability)
- 16.2.6 Merck KGaA
- 16.2.6.1. Overview
- 16.2.6.2. Products
- 16.2.6.3. SWOT Analysis
- 16.2.6.4. Recent Developments
- 16.2.6.5. Financials (Based on Availability)
- 16.2.7 Yokogawa Electric Corporation
- 16.2.7.1. Overview
- 16.2.7.2. Products
- 16.2.7.3. SWOT Analysis
- 16.2.7.4. Recent Developments
- 16.2.7.5. Financials (Based on Availability)
- 16.2.8 Agilent Technologies
- 16.2.8.1. Overview
- 16.2.8.2. Products
- 16.2.8.3. SWOT Analysis
- 16.2.8.4. Recent Developments
- 16.2.8.5. Financials (Based on Availability)
- 16.2.1 Bio-Rad Laboratories Inc
List of Figures
- Figure 1: Global High Content Screening Industry Revenue Breakdown (Million, %) by Region 2024 & 2032
- Figure 2: North America High Content Screening Industry Revenue (Million), by Country 2024 & 2032
- Figure 3: North America High Content Screening Industry Revenue Share (%), by Country 2024 & 2032
- Figure 4: Europe High Content Screening Industry Revenue (Million), by Country 2024 & 2032
- Figure 5: Europe High Content Screening Industry Revenue Share (%), by Country 2024 & 2032
- Figure 6: Asia Pacific High Content Screening Industry Revenue (Million), by Country 2024 & 2032
- Figure 7: Asia Pacific High Content Screening Industry Revenue Share (%), by Country 2024 & 2032
- Figure 8: Middle East and Africa High Content Screening Industry Revenue (Million), by Country 2024 & 2032
- Figure 9: Middle East and Africa High Content Screening Industry Revenue Share (%), by Country 2024 & 2032
- Figure 10: South America High Content Screening Industry Revenue (Million), by Country 2024 & 2032
- Figure 11: South America High Content Screening Industry Revenue Share (%), by Country 2024 & 2032
- Figure 12: North America High Content Screening Industry Revenue (Million), by Product 2024 & 2032
- Figure 13: North America High Content Screening Industry Revenue Share (%), by Product 2024 & 2032
- Figure 14: North America High Content Screening Industry Revenue (Million), by Application 2024 & 2032
- Figure 15: North America High Content Screening Industry Revenue Share (%), by Application 2024 & 2032
- Figure 16: North America High Content Screening Industry Revenue (Million), by End User 2024 & 2032
- Figure 17: North America High Content Screening Industry Revenue Share (%), by End User 2024 & 2032
- Figure 18: North America High Content Screening Industry Revenue (Million), by Country 2024 & 2032
- Figure 19: North America High Content Screening Industry Revenue Share (%), by Country 2024 & 2032
- Figure 20: Europe High Content Screening Industry Revenue (Million), by Product 2024 & 2032
- Figure 21: Europe High Content Screening Industry Revenue Share (%), by Product 2024 & 2032
- Figure 22: Europe High Content Screening Industry Revenue (Million), by Application 2024 & 2032
- Figure 23: Europe High Content Screening Industry Revenue Share (%), by Application 2024 & 2032
- Figure 24: Europe High Content Screening Industry Revenue (Million), by End User 2024 & 2032
- Figure 25: Europe High Content Screening Industry Revenue Share (%), by End User 2024 & 2032
- Figure 26: Europe High Content Screening Industry Revenue (Million), by Country 2024 & 2032
- Figure 27: Europe High Content Screening Industry Revenue Share (%), by Country 2024 & 2032
- Figure 28: Asia Pacific High Content Screening Industry Revenue (Million), by Product 2024 & 2032
- Figure 29: Asia Pacific High Content Screening Industry Revenue Share (%), by Product 2024 & 2032
- Figure 30: Asia Pacific High Content Screening Industry Revenue (Million), by Application 2024 & 2032
- Figure 31: Asia Pacific High Content Screening Industry Revenue Share (%), by Application 2024 & 2032
- Figure 32: Asia Pacific High Content Screening Industry Revenue (Million), by End User 2024 & 2032
- Figure 33: Asia Pacific High Content Screening Industry Revenue Share (%), by End User 2024 & 2032
- Figure 34: Asia Pacific High Content Screening Industry Revenue (Million), by Country 2024 & 2032
- Figure 35: Asia Pacific High Content Screening Industry Revenue Share (%), by Country 2024 & 2032
- Figure 36: Middle East and Africa High Content Screening Industry Revenue (Million), by Product 2024 & 2032
- Figure 37: Middle East and Africa High Content Screening Industry Revenue Share (%), by Product 2024 & 2032
- Figure 38: Middle East and Africa High Content Screening Industry Revenue (Million), by Application 2024 & 2032
- Figure 39: Middle East and Africa High Content Screening Industry Revenue Share (%), by Application 2024 & 2032
- Figure 40: Middle East and Africa High Content Screening Industry Revenue (Million), by End User 2024 & 2032
- Figure 41: Middle East and Africa High Content Screening Industry Revenue Share (%), by End User 2024 & 2032
- Figure 42: Middle East and Africa High Content Screening Industry Revenue (Million), by Country 2024 & 2032
- Figure 43: Middle East and Africa High Content Screening Industry Revenue Share (%), by Country 2024 & 2032
- Figure 44: South America High Content Screening Industry Revenue (Million), by Product 2024 & 2032
- Figure 45: South America High Content Screening Industry Revenue Share (%), by Product 2024 & 2032
- Figure 46: South America High Content Screening Industry Revenue (Million), by Application 2024 & 2032
- Figure 47: South America High Content Screening Industry Revenue Share (%), by Application 2024 & 2032
- Figure 48: South America High Content Screening Industry Revenue (Million), by End User 2024 & 2032
- Figure 49: South America High Content Screening Industry Revenue Share (%), by End User 2024 & 2032
- Figure 50: South America High Content Screening Industry Revenue (Million), by Country 2024 & 2032
- Figure 51: South America High Content Screening Industry Revenue Share (%), by Country 2024 & 2032
List of Tables
- Table 1: Global High Content Screening Industry Revenue Million Forecast, by Region 2019 & 2032
- Table 2: Global High Content Screening Industry Revenue Million Forecast, by Product 2019 & 2032
- Table 3: Global High Content Screening Industry Revenue Million Forecast, by Application 2019 & 2032
- Table 4: Global High Content Screening Industry Revenue Million Forecast, by End User 2019 & 2032
- Table 5: Global High Content Screening Industry Revenue Million Forecast, by Region 2019 & 2032
- Table 6: Global High Content Screening Industry Revenue Million Forecast, by Country 2019 & 2032
- Table 7: United States High Content Screening Industry Revenue (Million) Forecast, by Application 2019 & 2032
- Table 8: Canada High Content Screening Industry Revenue (Million) Forecast, by Application 2019 & 2032
- Table 9: Mexico High Content Screening Industry Revenue (Million) Forecast, by Application 2019 & 2032
- Table 10: Global High Content Screening Industry Revenue Million Forecast, by Country 2019 & 2032
- Table 11: Germany High Content Screening Industry Revenue (Million) Forecast, by Application 2019 & 2032
- Table 12: United Kingdom High Content Screening Industry Revenue (Million) Forecast, by Application 2019 & 2032
- Table 13: France High Content Screening Industry Revenue (Million) Forecast, by Application 2019 & 2032
- Table 14: Italy High Content Screening Industry Revenue (Million) Forecast, by Application 2019 & 2032
- Table 15: Spain High Content Screening Industry Revenue (Million) Forecast, by Application 2019 & 2032
- Table 16: Rest of Europe High Content Screening Industry Revenue (Million) Forecast, by Application 2019 & 2032
- Table 17: Global High Content Screening Industry Revenue Million Forecast, by Country 2019 & 2032
- Table 18: China High Content Screening Industry Revenue (Million) Forecast, by Application 2019 & 2032
- Table 19: Japan High Content Screening Industry Revenue (Million) Forecast, by Application 2019 & 2032
- Table 20: India High Content Screening Industry Revenue (Million) Forecast, by Application 2019 & 2032
- Table 21: Australia High Content Screening Industry Revenue (Million) Forecast, by Application 2019 & 2032
- Table 22: South Korea High Content Screening Industry Revenue (Million) Forecast, by Application 2019 & 2032
- Table 23: Rest of Asia Pacific High Content Screening Industry Revenue (Million) Forecast, by Application 2019 & 2032
- Table 24: Global High Content Screening Industry Revenue Million Forecast, by Country 2019 & 2032
- Table 25: GCC High Content Screening Industry Revenue (Million) Forecast, by Application 2019 & 2032
- Table 26: South Africa High Content Screening Industry Revenue (Million) Forecast, by Application 2019 & 2032
- Table 27: Rest of Middle East and Africa High Content Screening Industry Revenue (Million) Forecast, by Application 2019 & 2032
- Table 28: Global High Content Screening Industry Revenue Million Forecast, by Country 2019 & 2032
- Table 29: Brazil High Content Screening Industry Revenue (Million) Forecast, by Application 2019 & 2032
- Table 30: Argentina High Content Screening Industry Revenue (Million) Forecast, by Application 2019 & 2032
- Table 31: Rest of South America High Content Screening Industry Revenue (Million) Forecast, by Application 2019 & 2032
- Table 32: Global High Content Screening Industry Revenue Million Forecast, by Product 2019 & 2032
- Table 33: Global High Content Screening Industry Revenue Million Forecast, by Application 2019 & 2032
- Table 34: Global High Content Screening Industry Revenue Million Forecast, by End User 2019 & 2032
- Table 35: Global High Content Screening Industry Revenue Million Forecast, by Country 2019 & 2032
- Table 36: United States High Content Screening Industry Revenue (Million) Forecast, by Application 2019 & 2032
- Table 37: Canada High Content Screening Industry Revenue (Million) Forecast, by Application 2019 & 2032
- Table 38: Mexico High Content Screening Industry Revenue (Million) Forecast, by Application 2019 & 2032
- Table 39: Global High Content Screening Industry Revenue Million Forecast, by Product 2019 & 2032
- Table 40: Global High Content Screening Industry Revenue Million Forecast, by Application 2019 & 2032
- Table 41: Global High Content Screening Industry Revenue Million Forecast, by End User 2019 & 2032
- Table 42: Global High Content Screening Industry Revenue Million Forecast, by Country 2019 & 2032
- Table 43: Germany High Content Screening Industry Revenue (Million) Forecast, by Application 2019 & 2032
- Table 44: United Kingdom High Content Screening Industry Revenue (Million) Forecast, by Application 2019 & 2032
- Table 45: France High Content Screening Industry Revenue (Million) Forecast, by Application 2019 & 2032
- Table 46: Italy High Content Screening Industry Revenue (Million) Forecast, by Application 2019 & 2032
- Table 47: Spain High Content Screening Industry Revenue (Million) Forecast, by Application 2019 & 2032
- Table 48: Rest of Europe High Content Screening Industry Revenue (Million) Forecast, by Application 2019 & 2032
- Table 49: Global High Content Screening Industry Revenue Million Forecast, by Product 2019 & 2032
- Table 50: Global High Content Screening Industry Revenue Million Forecast, by Application 2019 & 2032
- Table 51: Global High Content Screening Industry Revenue Million Forecast, by End User 2019 & 2032
- Table 52: Global High Content Screening Industry Revenue Million Forecast, by Country 2019 & 2032
- Table 53: China High Content Screening Industry Revenue (Million) Forecast, by Application 2019 & 2032
- Table 54: Japan High Content Screening Industry Revenue (Million) Forecast, by Application 2019 & 2032
- Table 55: India High Content Screening Industry Revenue (Million) Forecast, by Application 2019 & 2032
- Table 56: Australia High Content Screening Industry Revenue (Million) Forecast, by Application 2019 & 2032
- Table 57: South Korea High Content Screening Industry Revenue (Million) Forecast, by Application 2019 & 2032
- Table 58: Rest of Asia Pacific High Content Screening Industry Revenue (Million) Forecast, by Application 2019 & 2032
- Table 59: Global High Content Screening Industry Revenue Million Forecast, by Product 2019 & 2032
- Table 60: Global High Content Screening Industry Revenue Million Forecast, by Application 2019 & 2032
- Table 61: Global High Content Screening Industry Revenue Million Forecast, by End User 2019 & 2032
- Table 62: Global High Content Screening Industry Revenue Million Forecast, by Country 2019 & 2032
- Table 63: GCC High Content Screening Industry Revenue (Million) Forecast, by Application 2019 & 2032
- Table 64: South Africa High Content Screening Industry Revenue (Million) Forecast, by Application 2019 & 2032
- Table 65: Rest of Middle East and Africa High Content Screening Industry Revenue (Million) Forecast, by Application 2019 & 2032
- Table 66: Global High Content Screening Industry Revenue Million Forecast, by Product 2019 & 2032
- Table 67: Global High Content Screening Industry Revenue Million Forecast, by Application 2019 & 2032
- Table 68: Global High Content Screening Industry Revenue Million Forecast, by End User 2019 & 2032
- Table 69: Global High Content Screening Industry Revenue Million Forecast, by Country 2019 & 2032
- Table 70: Brazil High Content Screening Industry Revenue (Million) Forecast, by Application 2019 & 2032
- Table 71: Argentina High Content Screening Industry Revenue (Million) Forecast, by Application 2019 & 2032
- Table 72: Rest of South America High Content Screening Industry Revenue (Million) Forecast, by Application 2019 & 2032
Frequently Asked Questions
1. What is the projected Compound Annual Growth Rate (CAGR) of the High Content Screening Industry?
The projected CAGR is approximately 8.74%.
2. Which companies are prominent players in the High Content Screening Industry?
Key companies in the market include Bio-Rad Laboratories Inc, Perkinelmer Inc, BD (Becton Dickinson and Company), Thermo Fisher Scientific Inc, Danaher Corporation, Merck KGaA, Yokogawa Electric Corporation, Agilent Technologies.
3. What are the main segments of the High Content Screening Industry?
The market segments include Product, Application, End User.
4. Can you provide details about the market size?
The market size is estimated to be USD XX Million as of 2022.
5. What are some drivers contributing to market growth?
Government Funding and Venture Capital Investments Across Developed Markets; Increasing Applications of High Content Screening in Life Science Research; Advancements in Informatic Solutions and Imaging Systems.
6. What are the notable trends driving market growth?
Flow Cytometry is Expected to Hold a Significant Market Share Over The Forecast Period.
7. Are there any restraints impacting market growth?
Lower Adoption of High Content Screening Instruments Due to Their High Prices.
8. Can you provide examples of recent developments in the market?
September 2022: BD (Becton, Dickinson and Company) launched BD Research Cloud, a cloud-based software solution designed to streamline the flow cytometry workflow. Its goal is to simplify the workflow for scientists working in a variety of fields, such as immunology, virology, oncology, and infectious disease monitoring, to enable higher-quality experiments with quicker time to insight.
9. What pricing options are available for accessing the report?
Pricing options include single-user, multi-user, and enterprise licenses priced at USD 4750, USD 5250, and USD 8750 respectively.
10. Is the market size provided in terms of value or volume?
The market size is provided in terms of value, measured in Million.
11. Are there any specific market keywords associated with the report?
Yes, the market keyword associated with the report is "High Content Screening Industry," which aids in identifying and referencing the specific market segment covered.
12. How do I determine which pricing option suits my needs best?
The pricing options vary based on user requirements and access needs. Individual users may opt for single-user licenses, while businesses requiring broader access may choose multi-user or enterprise licenses for cost-effective access to the report.
13. Are there any additional resources or data provided in the High Content Screening Industry report?
While the report offers comprehensive insights, it's advisable to review the specific contents or supplementary materials provided to ascertain if additional resources or data are available.
14. How can I stay updated on further developments or reports in the High Content Screening Industry?
To stay informed about further developments, trends, and reports in the High Content Screening Industry, consider subscribing to industry newsletters, following relevant companies and organizations, or regularly checking reputable industry news sources and publications.
Methodology
Step 1 - Identification of Relevant Samples Size from Population Database


Step 2 - Approaches for Defining Global Market Size (Value, Volume* & Price*)

Note*: In applicable scenarios
Step 3 - Data Sources
Primary Research
- Web Analytics
- Survey Reports
- Research Institute
- Latest Research Reports
- Opinion Leaders
Secondary Research
- Annual Reports
- White Paper
- Latest Press Release
- Industry Association
- Paid Database
- Investor Presentations

Step 4 - Data Triangulation
Involves using different sources of information in order to increase the validity of a study
These sources are likely to be stakeholders in a program - participants, other researchers, program staff, other community members, and so on.
Then we put all data in single framework & apply various statistical tools to find out the dynamic on the market.
During the analysis stage, feedback from the stakeholder groups would be compared to determine areas of agreement as well as areas of divergence
