

Key Insights
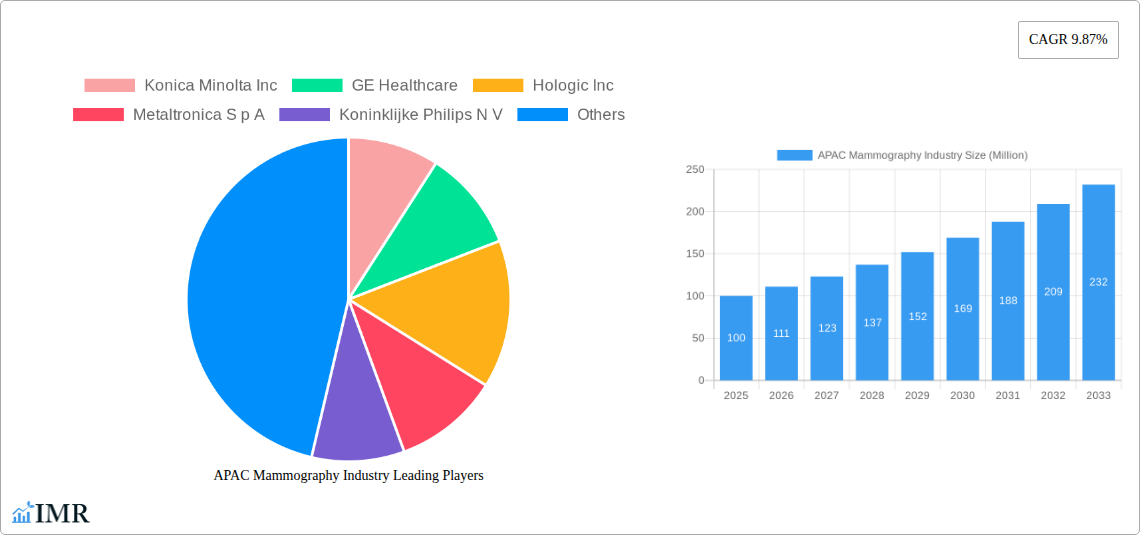
The Asia-Pacific (APAC) mammography market, valued at approximately $100 million in 2025 (estimated based on global market size and regional market share distribution in similar medical equipment sectors), is poised for substantial growth, driven by rising prevalence of breast cancer, increasing healthcare expenditure, and expanding awareness of preventive screening. The region's diverse demographics and varying levels of healthcare infrastructure create unique opportunities and challenges. While developed economies like Japan, South Korea, and Australia lead in adoption of advanced technologies like digital mammography and breast tomosynthesis, developing nations such as India and Southeast Asia present significant growth potential as healthcare infrastructure improves and access to screening expands. This growth is further fueled by government initiatives promoting early detection programs and rising disposable incomes allowing for increased healthcare spending. However, challenges remain, including uneven distribution of healthcare resources across the region, limited access to advanced technologies in underserved areas, and the need for skilled professionals to operate and interpret mammography results. Addressing these challenges through targeted investments in infrastructure, training, and affordable technology solutions will be crucial for realizing the full potential of the APAC mammography market.
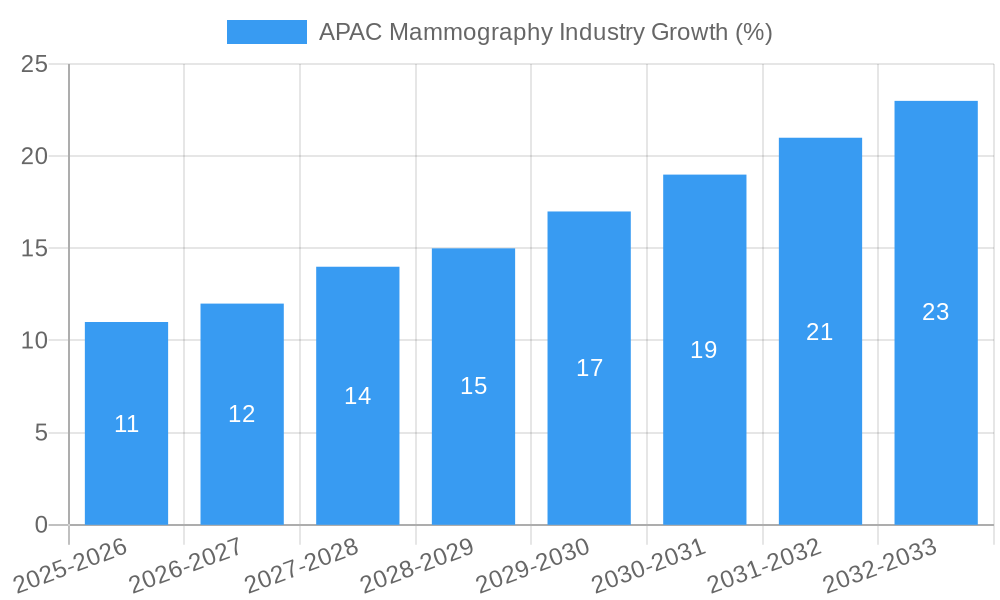
The forecast period (2025-2033) anticipates a strong CAGR, likely exceeding the global average of 9.87%, potentially reaching 11-12% due to the high growth potential in emerging markets within APAC. This accelerated growth will be primarily driven by increasing awareness of breast cancer prevention, coupled with government initiatives to improve healthcare infrastructure and affordability of diagnostic imaging technologies in many APAC countries. Technological advancements in mammography equipment, such as AI-assisted image analysis and improved image quality, further contribute to this market expansion. However, the pace of growth may be tempered by factors such as cost sensitivity in certain markets, the need for continuous professional training, and potential regulatory hurdles in specific countries regarding the adoption of new technologies. Competitive dynamics will play a significant role, with established players and emerging local manufacturers vying for market share.
APAC Mammography Industry Market Report: 2019-2033
This comprehensive report provides an in-depth analysis of the Asia-Pacific (APAC) mammography market, covering the period from 2019 to 2033. It examines market dynamics, growth trends, dominant segments, product landscapes, key challenges, emerging opportunities, and key players, offering valuable insights for industry professionals, investors, and strategists. The report leverages extensive data analysis to provide a robust forecast for the future of APAC mammography, with a focus on the parent market (Medical Imaging Equipment) and its child market (Mammography Equipment).
APAC Mammography Industry Market Dynamics & Structure
The APAC mammography market is characterized by a moderately concentrated landscape, with key players such as Konica Minolta Inc, GE Healthcare, Hologic Inc, and Siemens Healthineers AG holding significant market share. Technological innovation, particularly in digital mammography and breast tomosynthesis, is a major driver of growth. Stringent regulatory frameworks governing medical device approvals vary across countries within the region, influencing market access and adoption rates. The market faces competition from alternative diagnostic methods, however, the increasing incidence of breast cancer is a key factor fueling demand. Furthermore, a rising number of mergers and acquisitions (M&A) activities are reshaping the competitive dynamics.
- Market Concentration: Moderately concentrated, with the top 5 players holding approximately xx% of the market share in 2025 (Estimated).
- Technological Innovation: Rapid advancements in digital mammography, breast tomosynthesis, and AI-powered image analysis are key drivers.
- Regulatory Landscape: Varies across APAC countries, impacting market entry and product approval timelines.
- Competitive Substitutes: Ultrasound, MRI, and other imaging modalities present some level of competition.
- M&A Activity: xx M&A deals were recorded in the APAC mammography market between 2019 and 2024, contributing to market consolidation.
- End-User Demographics: Growing aging population and increased awareness of breast cancer are driving demand.
APAC Mammography Industry Growth Trends & Insights
The APAC mammography market experienced significant growth during the historical period (2019-2024), driven by factors such as rising breast cancer incidence, increasing healthcare expenditure, and technological advancements. The market size is projected to reach xx million units by 2025 (Estimated) and continue its growth trajectory with a Compound Annual Growth Rate (CAGR) of xx% during the forecast period (2025-2033). This growth is being fueled by increased adoption of advanced technologies like digital mammography and breast tomosynthesis, particularly in urban areas with better healthcare infrastructure. Consumer behavior is shifting towards a preference for minimally invasive procedures and advanced diagnostic capabilities, further driving market expansion. The penetration rate of digital mammography systems is steadily increasing, and the demand for advanced imaging techniques, such as tomosynthesis, is growing. Furthermore, rising government initiatives focused on early detection and improved access to healthcare are supporting market expansion.
Dominant Regions, Countries, or Segments in APAC Mammography Industry
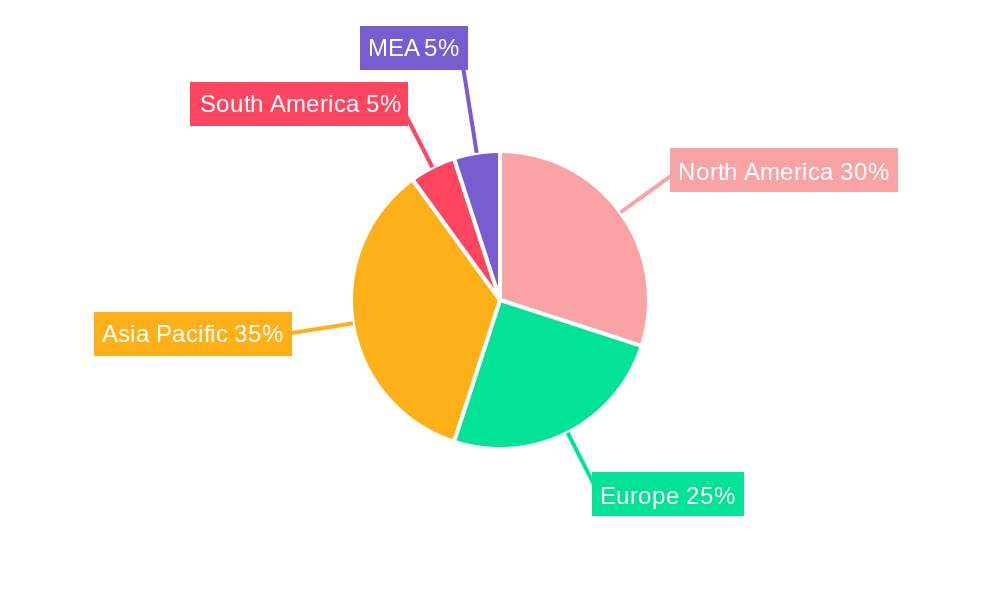
China and India are expected to be the leading markets in the APAC region due to their large populations, rising healthcare expenditure, and increasing prevalence of breast cancer. Within the product type segment, Digital Systems are the dominant segment, driven by superior image quality, improved diagnostic accuracy, and workflow efficiency. Hospitals are the largest end-users, accounting for a significant share of the market due to their comprehensive diagnostic capabilities.
- Leading Region: China and India.
- Key Growth Drivers:
- Increasing prevalence of breast cancer.
- Growing healthcare infrastructure and expenditure.
- Government initiatives for early cancer detection.
- Rising disposable income and increasing awareness.
- Dominant Segments:
- Product Type: Digital Systems (xx million units in 2025, Estimated)
- End User: Hospitals (xx million units in 2025, Estimated)
APAC Mammography Industry Product Landscape
The APAC mammography market offers a range of products, from traditional analog systems to advanced digital mammography and breast tomosynthesis systems. Recent innovations include AI-powered image analysis tools that enhance diagnostic accuracy and reduce the workload on radiologists. Key features driving product differentiation include image quality, speed of acquisition, patient comfort, and workflow efficiency. Many manufacturers are integrating advanced features, such as automated breast volume assessment and tomosynthesis, to offer better diagnostic capabilities and improved patient experience.
Key Drivers, Barriers & Challenges in APAC Mammography Industry
Key Drivers:
- Increasing prevalence of breast cancer.
- Growing healthcare expenditure and infrastructure development.
- Technological advancements in mammography systems.
- Government initiatives promoting early detection and improved access to healthcare.
Key Challenges:
- High initial investment costs for advanced systems.
- Limited skilled radiologists in certain areas, particularly in rural communities.
- Stringent regulatory requirements for medical device approval, leading to longer time-to-market.
- Competition from other diagnostic imaging modalities.
Emerging Opportunities in APAP Mammography Industry
- Expansion into untapped rural markets in APAC.
- Increasing adoption of AI-powered image analysis tools.
- Growing demand for mobile mammography units to improve access to healthcare in remote areas.
- Development of personalized mammography solutions based on individual patient risk factors.
Growth Accelerators in the APAC Mammography Industry
Technological breakthroughs in AI-driven image analysis, coupled with strategic partnerships between medical device manufacturers and healthcare providers, will be key drivers of market expansion. Furthermore, proactive government policies promoting early detection programs and expanding healthcare infrastructure are expected to accelerate market growth throughout the forecast period.
Key Players Shaping the APAC Mammography Industry Market
- Konica Minolta Inc
- GE Healthcare
- Hologic Inc
- Metaltronica S p A
- Koninklijke Philips N V
- Siemens Healthineers AG
- Carestream Health
- Planmed Oy
- Canon Medical Systems Corporation
- Fujifilm Holdings Corporation
Notable Milestones in APAC Mammography Industry Sector
- 2020: Introduction of AI-powered image analysis software by several key players.
- 2021: Launch of several new breast tomosynthesis systems with improved image quality and patient comfort features.
- 2022: Several strategic partnerships formed between medical device manufacturers and healthcare providers to expand access to mammography services.
- 2023: Significant increase in investments in digital mammography infrastructure in several APAC countries.
- 2024: Launch of mobile mammography units in remote areas to address geographical disparities in healthcare access. (Further milestones to be added based on available data.)
In-Depth APAC Mammography Industry Market Outlook
The APAC mammography market presents substantial long-term growth potential, driven by a confluence of technological advancements, increasing healthcare spending, rising breast cancer incidence, and supportive government policies. Strategic opportunities exist for market entrants and established players to capitalize on the expanding demand for advanced mammography solutions and focus on underserved markets. The ongoing technological innovations, including AI-powered analysis and improved image quality, are expected to further drive market growth, while increased government funding and health awareness campaigns will promote wider adoption.
APAC Mammography Industry Segmentation
-
1. Product Type
- 1.1. Digital Systems
- 1.2. Analog Systems
- 1.3. Breast Tomosynthesis
- 1.4. Film Screen Systems
- 1.5. Other Product Types
-
2. End Users
- 2.1. Hospitals
- 2.2. Diagnostic Centers
- 2.3. Others
-
3. Geography
-
3.1. Asia-Pacific
- 3.1.1. China
- 3.1.2. Japan
- 3.1.3. India
- 3.1.4. Australia
- 3.1.5. South korea
- 3.1.6. Rest of Asia-Pacific
-
3.1. Asia-Pacific
APAC Mammography Industry Segmentation By Geography
-
1. Asia Pacific
- 1.1. China
- 1.2. Japan
- 1.3. India
- 1.4. Australia
- 1.5. South korea
- 1.6. Rest of Asia Pacific
APAC Mammography Industry REPORT HIGHLIGHTS
| Aspects | Details |
|---|---|
| Study Period | 2019-2033 |
| Base Year | 2024 |
| Estimated Year | 2025 |
| Forecast Period | 2025-2033 |
| Historical Period | 2019-2024 |
| Growth Rate | CAGR of 9.87% from 2019-2033 |
| Segmentation |
|
Table of Contents
- 1. Introduction
- 1.1. Research Scope
- 1.2. Market Segmentation
- 1.3. Research Methodology
- 1.4. Definitions and Assumptions
- 2. Executive Summary
- 2.1. Introduction
- 3. Market Dynamics
- 3.1. Introduction
- 3.2. Market Drivers
- 3.2.1. ; Rising Incidences of Breast Cancer; Advancements in the Technologies of Breast Imaging Modalities
- 3.3. Market Restrains
- 3.3.1. ; High Cost of Imaging Devices; Risk of Adverse Effects of Radiation Exposure
- 3.4. Market Trends
- 3.4.1. Digital Mammography Segment is Expected to Hold the Largest Market Share in the Asia-Pacifc Mammography Market
- 4. Market Factor Analysis
- 4.1. Porters Five Forces
- 4.2. Supply/Value Chain
- 4.3. PESTEL analysis
- 4.4. Market Entropy
- 4.5. Patent/Trademark Analysis
- 5. Global APAC Mammography Industry Analysis, Insights and Forecast, 2019-2031
- 5.1. Market Analysis, Insights and Forecast - by Product Type
- 5.1.1. Digital Systems
- 5.1.2. Analog Systems
- 5.1.3. Breast Tomosynthesis
- 5.1.4. Film Screen Systems
- 5.1.5. Other Product Types
- 5.2. Market Analysis, Insights and Forecast - by End Users
- 5.2.1. Hospitals
- 5.2.2. Diagnostic Centers
- 5.2.3. Others
- 5.3. Market Analysis, Insights and Forecast - by Geography
- 5.3.1. Asia-Pacific
- 5.3.1.1. China
- 5.3.1.2. Japan
- 5.3.1.3. India
- 5.3.1.4. Australia
- 5.3.1.5. South korea
- 5.3.1.6. Rest of Asia-Pacific
- 5.3.1. Asia-Pacific
- 5.4. Market Analysis, Insights and Forecast - by Region
- 5.4.1. Asia Pacific
- 5.1. Market Analysis, Insights and Forecast - by Product Type
- 6. North America APAC Mammography Industry Analysis, Insights and Forecast, 2019-2031
- 6.1. Market Analysis, Insights and Forecast - By Country/Sub-region
- 6.1.1 United States
- 6.1.2 Canada
- 6.1.3 Mexico
- 7. Europe APAC Mammography Industry Analysis, Insights and Forecast, 2019-2031
- 7.1. Market Analysis, Insights and Forecast - By Country/Sub-region
- 7.1.1 Germany
- 7.1.2 United Kingdom
- 7.1.3 France
- 7.1.4 Spain
- 7.1.5 Italy
- 7.1.6 Spain
- 7.1.7 Belgium
- 7.1.8 Netherland
- 7.1.9 Nordics
- 7.1.10 Rest of Europe
- 8. Asia Pacific APAC Mammography Industry Analysis, Insights and Forecast, 2019-2031
- 8.1. Market Analysis, Insights and Forecast - By Country/Sub-region
- 8.1.1 China
- 8.1.2 Japan
- 8.1.3 India
- 8.1.4 South Korea
- 8.1.5 Southeast Asia
- 8.1.6 Australia
- 8.1.7 Indonesia
- 8.1.8 Phillipes
- 8.1.9 Singapore
- 8.1.10 Thailandc
- 8.1.11 Rest of Asia Pacific
- 9. South America APAC Mammography Industry Analysis, Insights and Forecast, 2019-2031
- 9.1. Market Analysis, Insights and Forecast - By Country/Sub-region
- 9.1.1 Brazil
- 9.1.2 Argentina
- 9.1.3 Peru
- 9.1.4 Chile
- 9.1.5 Colombia
- 9.1.6 Ecuador
- 9.1.7 Venezuela
- 9.1.8 Rest of South America
- 10. MEA APAC Mammography Industry Analysis, Insights and Forecast, 2019-2031
- 10.1. Market Analysis, Insights and Forecast - By Country/Sub-region
- 10.1.1 United Arab Emirates
- 10.1.2 Saudi Arabia
- 10.1.3 South Africa
- 10.1.4 Rest of Middle East and Africa
- 11. Competitive Analysis
- 11.1. Global Market Share Analysis 2024
- 11.2. Company Profiles
- 11.2.1 Konica Minolta Inc
- 11.2.1.1. Overview
- 11.2.1.2. Products
- 11.2.1.3. SWOT Analysis
- 11.2.1.4. Recent Developments
- 11.2.1.5. Financials (Based on Availability)
- 11.2.2 GE Healthcare
- 11.2.2.1. Overview
- 11.2.2.2. Products
- 11.2.2.3. SWOT Analysis
- 11.2.2.4. Recent Developments
- 11.2.2.5. Financials (Based on Availability)
- 11.2.3 Hologic Inc
- 11.2.3.1. Overview
- 11.2.3.2. Products
- 11.2.3.3. SWOT Analysis
- 11.2.3.4. Recent Developments
- 11.2.3.5. Financials (Based on Availability)
- 11.2.4 Metaltronica S p A
- 11.2.4.1. Overview
- 11.2.4.2. Products
- 11.2.4.3. SWOT Analysis
- 11.2.4.4. Recent Developments
- 11.2.4.5. Financials (Based on Availability)
- 11.2.5 Koninklijke Philips N V
- 11.2.5.1. Overview
- 11.2.5.2. Products
- 11.2.5.3. SWOT Analysis
- 11.2.5.4. Recent Developments
- 11.2.5.5. Financials (Based on Availability)
- 11.2.6 Siemens Healthineers AG
- 11.2.6.1. Overview
- 11.2.6.2. Products
- 11.2.6.3. SWOT Analysis
- 11.2.6.4. Recent Developments
- 11.2.6.5. Financials (Based on Availability)
- 11.2.7 Carestream Health
- 11.2.7.1. Overview
- 11.2.7.2. Products
- 11.2.7.3. SWOT Analysis
- 11.2.7.4. Recent Developments
- 11.2.7.5. Financials (Based on Availability)
- 11.2.8 Planmed Oy
- 11.2.8.1. Overview
- 11.2.8.2. Products
- 11.2.8.3. SWOT Analysis
- 11.2.8.4. Recent Developments
- 11.2.8.5. Financials (Based on Availability)
- 11.2.9 Canon Medical Systems Corporation
- 11.2.9.1. Overview
- 11.2.9.2. Products
- 11.2.9.3. SWOT Analysis
- 11.2.9.4. Recent Developments
- 11.2.9.5. Financials (Based on Availability)
- 11.2.10 Fujifilm Holdings Corporation
- 11.2.10.1. Overview
- 11.2.10.2. Products
- 11.2.10.3. SWOT Analysis
- 11.2.10.4. Recent Developments
- 11.2.10.5. Financials (Based on Availability)
- 11.2.1 Konica Minolta Inc
List of Figures
- Figure 1: Global APAC Mammography Industry Revenue Breakdown (Million, %) by Region 2024 & 2032
- Figure 2: North America APAC Mammography Industry Revenue (Million), by Country 2024 & 2032
- Figure 3: North America APAC Mammography Industry Revenue Share (%), by Country 2024 & 2032
- Figure 4: Europe APAC Mammography Industry Revenue (Million), by Country 2024 & 2032
- Figure 5: Europe APAC Mammography Industry Revenue Share (%), by Country 2024 & 2032
- Figure 6: Asia Pacific APAC Mammography Industry Revenue (Million), by Country 2024 & 2032
- Figure 7: Asia Pacific APAC Mammography Industry Revenue Share (%), by Country 2024 & 2032
- Figure 8: South America APAC Mammography Industry Revenue (Million), by Country 2024 & 2032
- Figure 9: South America APAC Mammography Industry Revenue Share (%), by Country 2024 & 2032
- Figure 10: MEA APAC Mammography Industry Revenue (Million), by Country 2024 & 2032
- Figure 11: MEA APAC Mammography Industry Revenue Share (%), by Country 2024 & 2032
- Figure 12: Asia Pacific APAC Mammography Industry Revenue (Million), by Product Type 2024 & 2032
- Figure 13: Asia Pacific APAC Mammography Industry Revenue Share (%), by Product Type 2024 & 2032
- Figure 14: Asia Pacific APAC Mammography Industry Revenue (Million), by End Users 2024 & 2032
- Figure 15: Asia Pacific APAC Mammography Industry Revenue Share (%), by End Users 2024 & 2032
- Figure 16: Asia Pacific APAC Mammography Industry Revenue (Million), by Geography 2024 & 2032
- Figure 17: Asia Pacific APAC Mammography Industry Revenue Share (%), by Geography 2024 & 2032
- Figure 18: Asia Pacific APAC Mammography Industry Revenue (Million), by Country 2024 & 2032
- Figure 19: Asia Pacific APAC Mammography Industry Revenue Share (%), by Country 2024 & 2032
List of Tables
- Table 1: Global APAC Mammography Industry Revenue Million Forecast, by Region 2019 & 2032
- Table 2: Global APAC Mammography Industry Revenue Million Forecast, by Product Type 2019 & 2032
- Table 3: Global APAC Mammography Industry Revenue Million Forecast, by End Users 2019 & 2032
- Table 4: Global APAC Mammography Industry Revenue Million Forecast, by Geography 2019 & 2032
- Table 5: Global APAC Mammography Industry Revenue Million Forecast, by Region 2019 & 2032
- Table 6: Global APAC Mammography Industry Revenue Million Forecast, by Country 2019 & 2032
- Table 7: United States APAC Mammography Industry Revenue (Million) Forecast, by Application 2019 & 2032
- Table 8: Canada APAC Mammography Industry Revenue (Million) Forecast, by Application 2019 & 2032
- Table 9: Mexico APAC Mammography Industry Revenue (Million) Forecast, by Application 2019 & 2032
- Table 10: Global APAC Mammography Industry Revenue Million Forecast, by Country 2019 & 2032
- Table 11: Germany APAC Mammography Industry Revenue (Million) Forecast, by Application 2019 & 2032
- Table 12: United Kingdom APAC Mammography Industry Revenue (Million) Forecast, by Application 2019 & 2032
- Table 13: France APAC Mammography Industry Revenue (Million) Forecast, by Application 2019 & 2032
- Table 14: Spain APAC Mammography Industry Revenue (Million) Forecast, by Application 2019 & 2032
- Table 15: Italy APAC Mammography Industry Revenue (Million) Forecast, by Application 2019 & 2032
- Table 16: Spain APAC Mammography Industry Revenue (Million) Forecast, by Application 2019 & 2032
- Table 17: Belgium APAC Mammography Industry Revenue (Million) Forecast, by Application 2019 & 2032
- Table 18: Netherland APAC Mammography Industry Revenue (Million) Forecast, by Application 2019 & 2032
- Table 19: Nordics APAC Mammography Industry Revenue (Million) Forecast, by Application 2019 & 2032
- Table 20: Rest of Europe APAC Mammography Industry Revenue (Million) Forecast, by Application 2019 & 2032
- Table 21: Global APAC Mammography Industry Revenue Million Forecast, by Country 2019 & 2032
- Table 22: China APAC Mammography Industry Revenue (Million) Forecast, by Application 2019 & 2032
- Table 23: Japan APAC Mammography Industry Revenue (Million) Forecast, by Application 2019 & 2032
- Table 24: India APAC Mammography Industry Revenue (Million) Forecast, by Application 2019 & 2032
- Table 25: South Korea APAC Mammography Industry Revenue (Million) Forecast, by Application 2019 & 2032
- Table 26: Southeast Asia APAC Mammography Industry Revenue (Million) Forecast, by Application 2019 & 2032
- Table 27: Australia APAC Mammography Industry Revenue (Million) Forecast, by Application 2019 & 2032
- Table 28: Indonesia APAC Mammography Industry Revenue (Million) Forecast, by Application 2019 & 2032
- Table 29: Phillipes APAC Mammography Industry Revenue (Million) Forecast, by Application 2019 & 2032
- Table 30: Singapore APAC Mammography Industry Revenue (Million) Forecast, by Application 2019 & 2032
- Table 31: Thailandc APAC Mammography Industry Revenue (Million) Forecast, by Application 2019 & 2032
- Table 32: Rest of Asia Pacific APAC Mammography Industry Revenue (Million) Forecast, by Application 2019 & 2032
- Table 33: Global APAC Mammography Industry Revenue Million Forecast, by Country 2019 & 2032
- Table 34: Brazil APAC Mammography Industry Revenue (Million) Forecast, by Application 2019 & 2032
- Table 35: Argentina APAC Mammography Industry Revenue (Million) Forecast, by Application 2019 & 2032
- Table 36: Peru APAC Mammography Industry Revenue (Million) Forecast, by Application 2019 & 2032
- Table 37: Chile APAC Mammography Industry Revenue (Million) Forecast, by Application 2019 & 2032
- Table 38: Colombia APAC Mammography Industry Revenue (Million) Forecast, by Application 2019 & 2032
- Table 39: Ecuador APAC Mammography Industry Revenue (Million) Forecast, by Application 2019 & 2032
- Table 40: Venezuela APAC Mammography Industry Revenue (Million) Forecast, by Application 2019 & 2032
- Table 41: Rest of South America APAC Mammography Industry Revenue (Million) Forecast, by Application 2019 & 2032
- Table 42: Global APAC Mammography Industry Revenue Million Forecast, by Country 2019 & 2032
- Table 43: United Arab Emirates APAC Mammography Industry Revenue (Million) Forecast, by Application 2019 & 2032
- Table 44: Saudi Arabia APAC Mammography Industry Revenue (Million) Forecast, by Application 2019 & 2032
- Table 45: South Africa APAC Mammography Industry Revenue (Million) Forecast, by Application 2019 & 2032
- Table 46: Rest of Middle East and Africa APAC Mammography Industry Revenue (Million) Forecast, by Application 2019 & 2032
- Table 47: Global APAC Mammography Industry Revenue Million Forecast, by Product Type 2019 & 2032
- Table 48: Global APAC Mammography Industry Revenue Million Forecast, by End Users 2019 & 2032
- Table 49: Global APAC Mammography Industry Revenue Million Forecast, by Geography 2019 & 2032
- Table 50: Global APAC Mammography Industry Revenue Million Forecast, by Country 2019 & 2032
- Table 51: China APAC Mammography Industry Revenue (Million) Forecast, by Application 2019 & 2032
- Table 52: Japan APAC Mammography Industry Revenue (Million) Forecast, by Application 2019 & 2032
- Table 53: India APAC Mammography Industry Revenue (Million) Forecast, by Application 2019 & 2032
- Table 54: Australia APAC Mammography Industry Revenue (Million) Forecast, by Application 2019 & 2032
- Table 55: South korea APAC Mammography Industry Revenue (Million) Forecast, by Application 2019 & 2032
- Table 56: Rest of Asia Pacific APAC Mammography Industry Revenue (Million) Forecast, by Application 2019 & 2032
Frequently Asked Questions
1. What is the projected Compound Annual Growth Rate (CAGR) of the APAC Mammography Industry?
The projected CAGR is approximately 9.87%.
2. Which companies are prominent players in the APAC Mammography Industry?
Key companies in the market include Konica Minolta Inc, GE Healthcare, Hologic Inc, Metaltronica S p A, Koninklijke Philips N V, Siemens Healthineers AG, Carestream Health, Planmed Oy, Canon Medical Systems Corporation, Fujifilm Holdings Corporation.
3. What are the main segments of the APAC Mammography Industry?
The market segments include Product Type, End Users, Geography.
4. Can you provide details about the market size?
The market size is estimated to be USD 521.17 Million as of 2022.
5. What are some drivers contributing to market growth?
; Rising Incidences of Breast Cancer; Advancements in the Technologies of Breast Imaging Modalities.
6. What are the notable trends driving market growth?
Digital Mammography Segment is Expected to Hold the Largest Market Share in the Asia-Pacifc Mammography Market.
7. Are there any restraints impacting market growth?
; High Cost of Imaging Devices; Risk of Adverse Effects of Radiation Exposure.
8. Can you provide examples of recent developments in the market?
N/A
9. What pricing options are available for accessing the report?
Pricing options include single-user, multi-user, and enterprise licenses priced at USD 4750, USD 5250, and USD 8750 respectively.
10. Is the market size provided in terms of value or volume?
The market size is provided in terms of value, measured in Million.
11. Are there any specific market keywords associated with the report?
Yes, the market keyword associated with the report is "APAC Mammography Industry," which aids in identifying and referencing the specific market segment covered.
12. How do I determine which pricing option suits my needs best?
The pricing options vary based on user requirements and access needs. Individual users may opt for single-user licenses, while businesses requiring broader access may choose multi-user or enterprise licenses for cost-effective access to the report.
13. Are there any additional resources or data provided in the APAC Mammography Industry report?
While the report offers comprehensive insights, it's advisable to review the specific contents or supplementary materials provided to ascertain if additional resources or data are available.
14. How can I stay updated on further developments or reports in the APAC Mammography Industry?
To stay informed about further developments, trends, and reports in the APAC Mammography Industry, consider subscribing to industry newsletters, following relevant companies and organizations, or regularly checking reputable industry news sources and publications.
Methodology
Step 1 - Identification of Relevant Samples Size from Population Database


Step 2 - Approaches for Defining Global Market Size (Value, Volume* & Price*)

Note*: In applicable scenarios
Step 3 - Data Sources
Primary Research
- Web Analytics
- Survey Reports
- Research Institute
- Latest Research Reports
- Opinion Leaders
Secondary Research
- Annual Reports
- White Paper
- Latest Press Release
- Industry Association
- Paid Database
- Investor Presentations

Step 4 - Data Triangulation
Involves using different sources of information in order to increase the validity of a study
These sources are likely to be stakeholders in a program - participants, other researchers, program staff, other community members, and so on.
Then we put all data in single framework & apply various statistical tools to find out the dynamic on the market.
During the analysis stage, feedback from the stakeholder groups would be compared to determine areas of agreement as well as areas of divergence
