

Key Insights
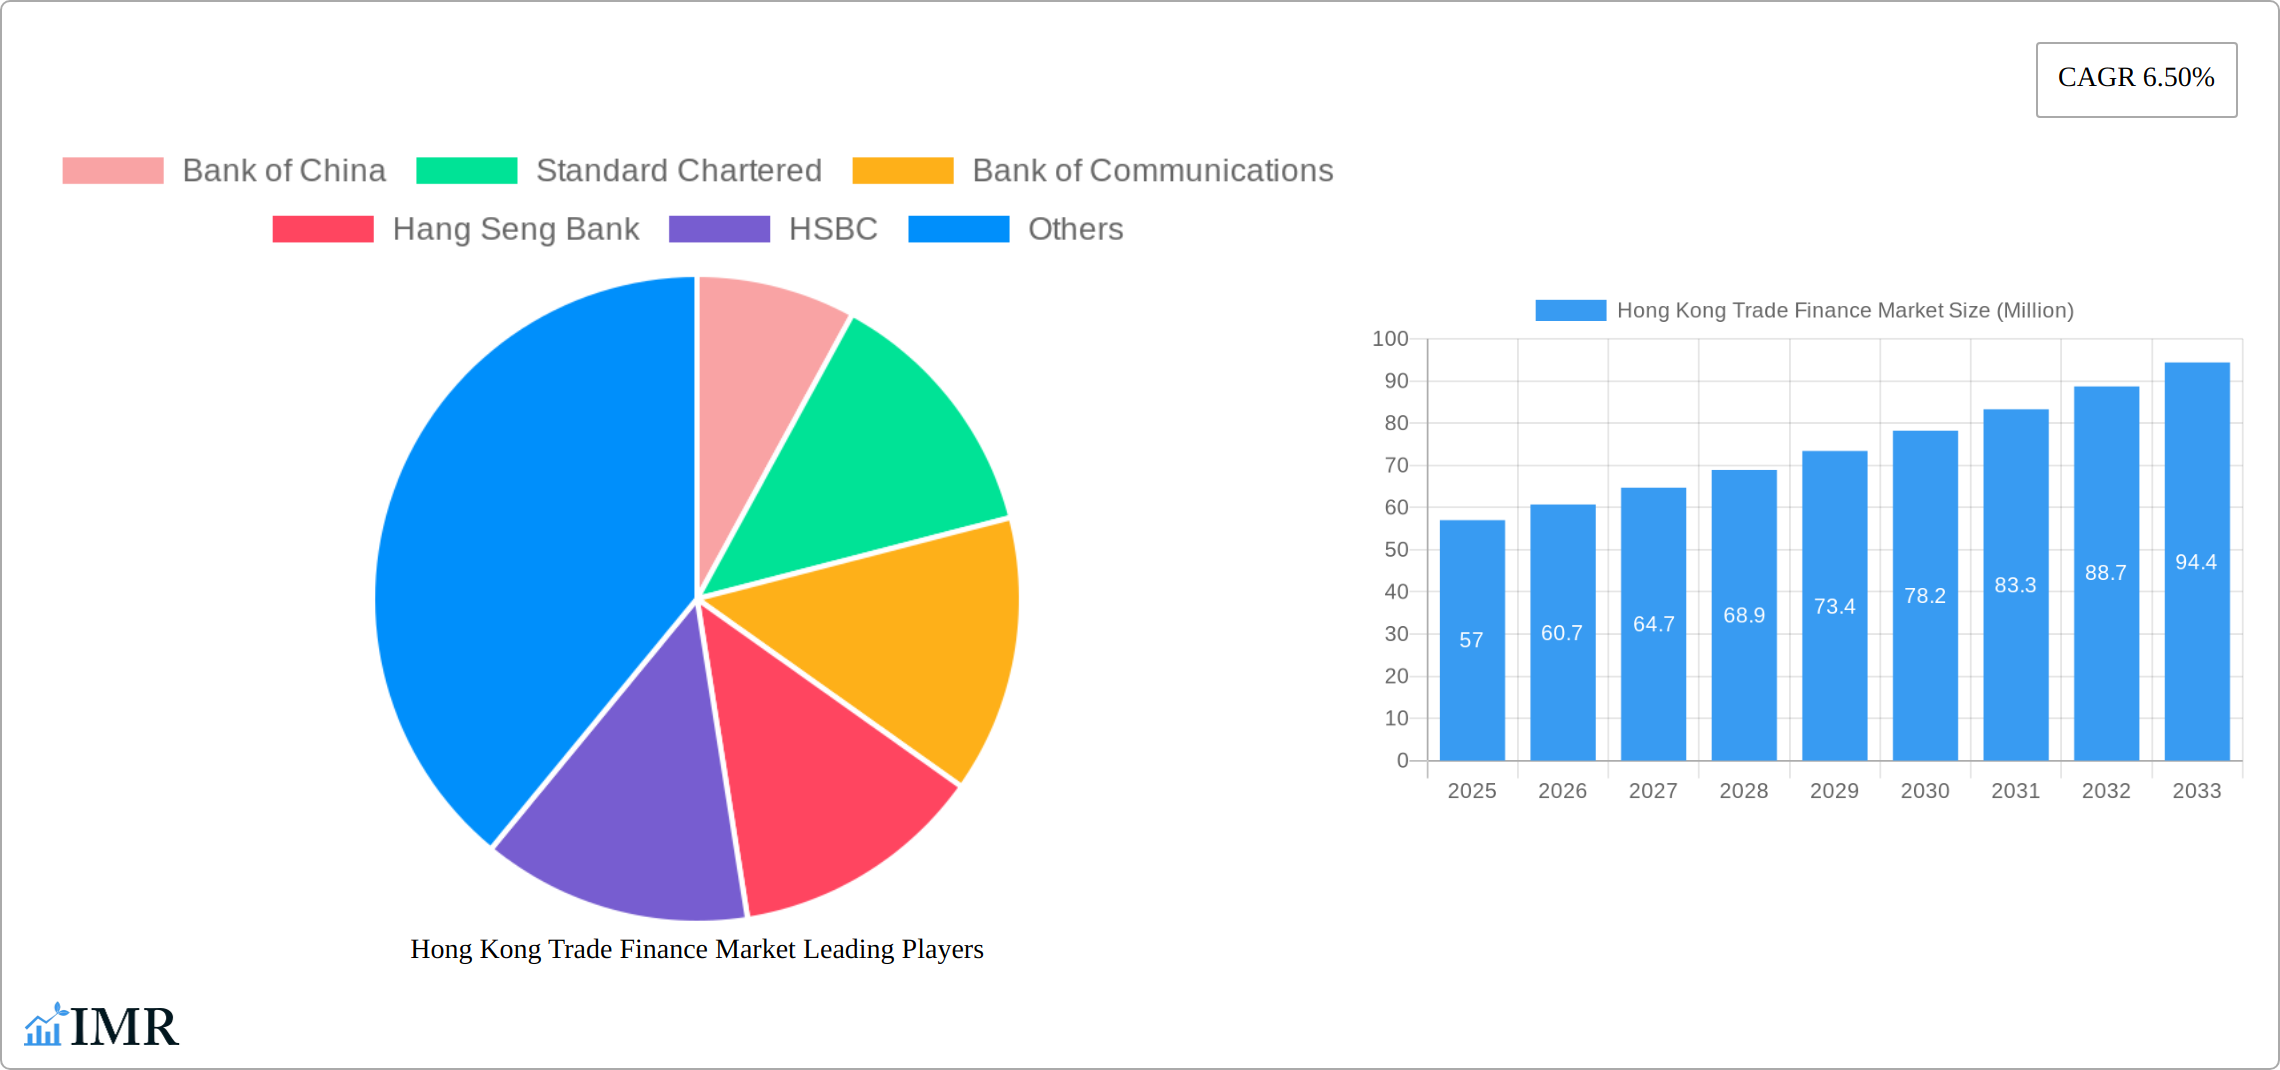
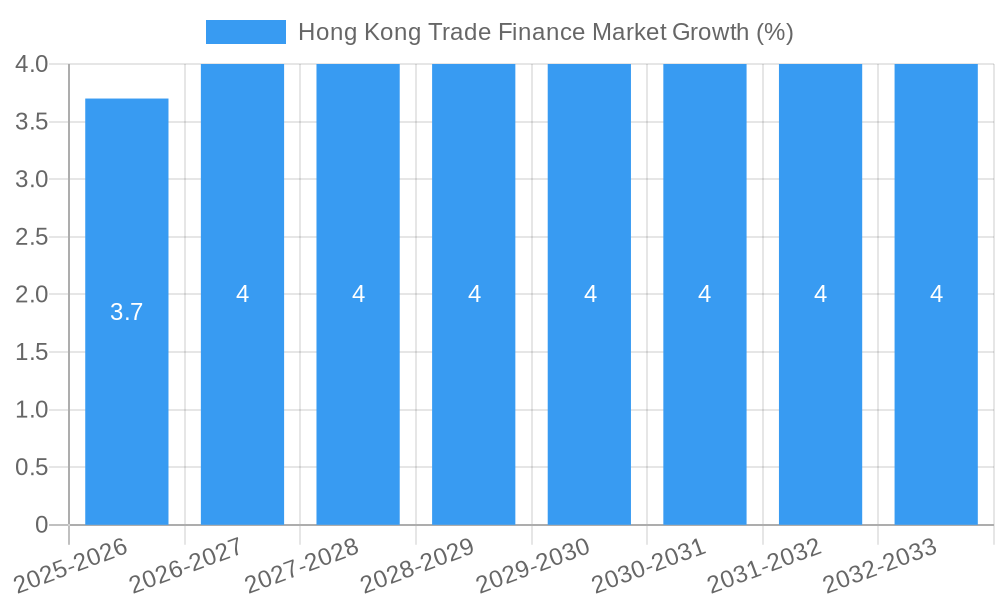
The Hong Kong Trade Finance market, valued at $57 million in 2025, is projected to experience robust growth, driven by the city's strategic position as a global financial hub and its robust trade relationships with mainland China and other Asian economies. A Compound Annual Growth Rate (CAGR) of 6.50% from 2025 to 2033 indicates a significant expansion of the market, reaching an estimated value exceeding $100 million by 2033. This growth is fueled by increasing international trade, the rising adoption of digital trade finance solutions, and the supportive regulatory environment in Hong Kong. Key players like Bank of China, HSBC, and Standard Chartered are leveraging their established networks and technological capabilities to capture market share. However, challenges remain, including geopolitical uncertainties, fluctuating global exchange rates, and the potential for increased competition from fintech companies offering innovative trade finance platforms. The market's segmentation likely includes various trade finance products such as letters of credit, documentary collections, and supply chain finance solutions, each contributing differently to the overall market size and growth. Further analysis of specific product segment performance and geographical distribution within Hong Kong would provide a more granular understanding of market dynamics.
The competitive landscape is dominated by established banking institutions, but the emergence of fintech firms offering innovative solutions presents both opportunities and challenges. These fintech players are disrupting the traditional banking model through automation, improved efficiency, and enhanced transparency in trade finance processes. The Hong Kong Trade Finance market is likely to witness increased consolidation and strategic partnerships between banks and fintech companies in the coming years. Government initiatives aimed at fostering innovation and improving the ease of doing business in Hong Kong will also play a vital role in shaping future market trends. Monitoring regulatory changes and technological advancements will be crucial for understanding the long-term trajectory of this market.
Hong Kong Trade Finance Market: A Comprehensive Report (2019-2033)
This comprehensive report provides an in-depth analysis of the Hong Kong Trade Finance Market, encompassing historical data (2019-2024), current estimates (2025), and future forecasts (2025-2033). The report offers invaluable insights into market dynamics, growth trends, key players, and emerging opportunities, making it an essential resource for industry professionals, investors, and strategic decision-makers. The report covers the parent market of Financial Services and the child market of Trade Finance, providing a granular view of the Hong Kong landscape. Market size is presented in Million units.
Hong Kong Trade Finance Market Dynamics & Structure
This section analyzes the Hong Kong Trade Finance Market's competitive landscape, regulatory environment, and technological advancements. We examine market concentration, identifying key players and their market share, alongside the impact of mergers and acquisitions (M&A) activities. The study also explores innovation drivers, competitive substitutes, end-user demographics and the overall structure of the market.
- Market Concentration: The market exhibits a high degree of concentration with a few major players holding significant market share. The top five banks (HSBC, Bank of China, Standard Chartered, Hang Seng Bank, and Bank of Communications) likely control over xx% of the market in 2025.
- Technological Innovation: Blockchain technology and AI-powered solutions are driving innovation, but adoption faces challenges including legacy systems and regulatory uncertainty.
- Regulatory Framework: The Hong Kong Monetary Authority (HKMA) plays a crucial role in shaping the regulatory landscape, influencing market stability and innovation.
- M&A Activity: The acquisition of RBC Investor Services Trust by Standard Chartered in May 2023 exemplifies the ongoing consolidation within the sector. We estimate xx M&A deals in the trade finance sector within the forecast period.
- Competitive Substitutes: Fintech solutions and alternative financing options represent emerging competitive threats, challenging traditional banking models.
Hong Kong Trade Finance Market Growth Trends & Insights
This section details the growth trajectory of the Hong Kong Trade Finance Market, analyzing market size evolution, adoption rates, and technological disruptions. Data reveals a Compound Annual Growth Rate (CAGR) of xx% during the historical period (2019-2024), projected to moderate to xx% during the forecast period (2025-2033). This moderation reflects the saturation of existing markets and increased regulatory scrutiny. The market penetration rate for digital trade finance solutions is estimated at xx% in 2025, with potential for significant growth. The increasing adoption of digital solutions, fueled by the ongoing push for digitalization within the financial sector and increasing trade activities within the Greater Bay Area, is a significant driver of growth. Consumer behavior shifts towards greater demand for streamlined, efficient, and transparent trade finance solutions significantly impacts the growth dynamics.
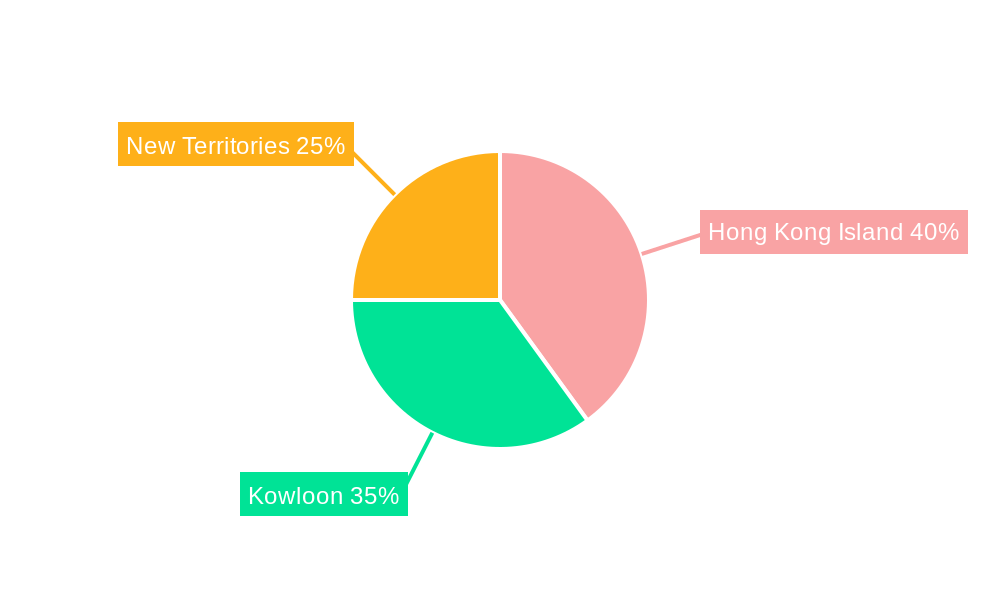
Dominant Regions, Countries, or Segments in Hong Kong Trade Finance Market
Hong Kong’s strategic location and its role as a major trading hub within the Greater Bay Area (GBA) contribute significantly to the dominance of this region. The GBA initiative fosters increased cross-border trade and investment, fueling demand for trade finance services.
- Key Drivers:
- Economic policies: Government support for trade and investment initiatives directly stimulates market expansion.
- Infrastructure: Well-developed infrastructure, including ports and logistics networks, facilitates efficient trade flows.
- Strong regulatory framework: A robust and reliable regulatory environment encourages business confidence and attracts investors.
- Dominance Factors:
- High trade volume: Hong Kong's position as a global trade and finance center drives substantial demand for trade finance services.
- Geographic location: Its strategic location within Asia facilitates trade between China, other Asian countries and the rest of the world.
- Developed financial infrastructure: A well-established banking system and sophisticated financial markets provide strong support for the sector.
Hong Kong Trade Finance Market Product Landscape
The Hong Kong Trade Finance Market offers a diverse range of products, from traditional letters of credit and guarantees to innovative digital solutions. These digital solutions leverage blockchain, AI, and big data analytics to enhance efficiency, transparency, and security, while also providing faster processing times and reduced costs. Product innovation focuses on streamlining processes, improving security, and providing enhanced customer experiences. Key performance indicators include transaction speed, cost efficiency, and security measures employed.
Key Drivers, Barriers & Challenges in Hong Kong Trade Finance Market
Key Drivers:
- The growth of e-commerce and cross-border trade.
- The increasing adoption of digital technologies, such as blockchain and AI.
- Supportive government policies and initiatives, such as the Belt and Road Initiative.
Key Challenges:
- Increased regulatory scrutiny and compliance costs.
- The risk of cyberattacks and data breaches.
- Competition from fintech companies and alternative financing options. The impact of these challenges is estimated to reduce market growth by xx% during the forecast period.
Emerging Opportunities in Hong Kong Trade Finance Market
- The expansion of trade finance solutions into underserved markets.
- The development of innovative applications of blockchain and AI technology.
- The growth of cross-border trade within the Greater Bay Area.
Growth Accelerators in the Hong Kong Trade Finance Market Industry
Technological advancements, strategic partnerships between banks and fintech companies, and the government's continued support for trade initiatives will fuel long-term growth in the Hong Kong Trade Finance Market. The ongoing development and implementation of digital trade finance solutions will be a primary growth catalyst, significantly enhancing the efficiency and accessibility of trade finance services for businesses of all sizes.
Key Players Shaping the Hong Kong Trade Finance Market Market
- Bank of China
- Standard Chartered
- Bank of Communications
- Hang Seng Bank
- HSBC
- DBS Hong Kong
- China Citic Bank International
- CMB Wing Lung Bank
- Shanghai Commercial Bank
- Public Bank
- List Not Exhaustive
Notable Milestones in Hong Kong Trade Finance Market Sector
- August 2023: Hang Seng Bank expands its presence in cross-border wealth management using the "Wealth Connect" system.
- May 2023: Standard Chartered completes acquisition of RBC Investor Services Trust, establishing Standard Chartered Trustee (Hong Kong) Ltd.
In-Depth Hong Kong Trade Finance Market Market Outlook
The Hong Kong Trade Finance Market is poised for continued growth, driven by technological innovation, supportive government policies, and the increasing importance of cross-border trade. Strategic opportunities exist for players that embrace digitalization, forge strategic partnerships, and cater to the evolving needs of businesses operating in the increasingly interconnected global economy. The market's future potential is substantial, offering significant returns for businesses that can effectively navigate the evolving market landscape.
Hong Kong Trade Finance Market Segmentation
-
1. Service Provider
- 1.1. Banks
- 1.2. Trade Finance Companies
- 1.3. Insurance Companies
- 1.4. Other Service Providers
-
2. Application
- 2.1. Domestic
- 2.2. International
Hong Kong Trade Finance Market Segmentation By Geography
-
1. North America
- 1.1. United States
- 1.2. Canada
- 1.3. Mexico
-
2. South America
- 2.1. Brazil
- 2.2. Argentina
- 2.3. Rest of South America
-
3. Europe
- 3.1. United Kingdom
- 3.2. Germany
- 3.3. France
- 3.4. Italy
- 3.5. Spain
- 3.6. Russia
- 3.7. Benelux
- 3.8. Nordics
- 3.9. Rest of Europe
-
4. Middle East & Africa
- 4.1. Turkey
- 4.2. Israel
- 4.3. GCC
- 4.4. North Africa
- 4.5. South Africa
- 4.6. Rest of Middle East & Africa
-
5. Asia Pacific
- 5.1. China
- 5.2. India
- 5.3. Japan
- 5.4. South Korea
- 5.5. ASEAN
- 5.6. Oceania
- 5.7. Rest of Asia Pacific
Hong Kong Trade Finance Market REPORT HIGHLIGHTS
| Aspects | Details |
|---|---|
| Study Period | 2019-2033 |
| Base Year | 2024 |
| Estimated Year | 2025 |
| Forecast Period | 2025-2033 |
| Historical Period | 2019-2024 |
| Growth Rate | CAGR of 6.50% from 2019-2033 |
| Segmentation |
|
Table of Contents
- 1. Introduction
- 1.1. Research Scope
- 1.2. Market Segmentation
- 1.3. Research Methodology
- 1.4. Definitions and Assumptions
- 2. Executive Summary
- 2.1. Introduction
- 3. Market Dynamics
- 3.1. Introduction
- 3.2. Market Drivers
- 3.2.1. Accelerated Digital Adoption is Driving the Market; Economic Conditions
- 3.3. Market Restrains
- 3.3.1. Accelerated Digital Adoption is Driving the Market; Economic Conditions
- 3.4. Market Trends
- 3.4.1. Technological Advancements and Digitalization are Driving the Market
- 4. Market Factor Analysis
- 4.1. Porters Five Forces
- 4.2. Supply/Value Chain
- 4.3. PESTEL analysis
- 4.4. Market Entropy
- 4.5. Patent/Trademark Analysis
- 5. Global Hong Kong Trade Finance Market Analysis, Insights and Forecast, 2019-2031
- 5.1. Market Analysis, Insights and Forecast - by Service Provider
- 5.1.1. Banks
- 5.1.2. Trade Finance Companies
- 5.1.3. Insurance Companies
- 5.1.4. Other Service Providers
- 5.2. Market Analysis, Insights and Forecast - by Application
- 5.2.1. Domestic
- 5.2.2. International
- 5.3. Market Analysis, Insights and Forecast - by Region
- 5.3.1. North America
- 5.3.2. South America
- 5.3.3. Europe
- 5.3.4. Middle East & Africa
- 5.3.5. Asia Pacific
- 5.1. Market Analysis, Insights and Forecast - by Service Provider
- 6. North America Hong Kong Trade Finance Market Analysis, Insights and Forecast, 2019-2031
- 6.1. Market Analysis, Insights and Forecast - by Service Provider
- 6.1.1. Banks
- 6.1.2. Trade Finance Companies
- 6.1.3. Insurance Companies
- 6.1.4. Other Service Providers
- 6.2. Market Analysis, Insights and Forecast - by Application
- 6.2.1. Domestic
- 6.2.2. International
- 6.1. Market Analysis, Insights and Forecast - by Service Provider
- 7. South America Hong Kong Trade Finance Market Analysis, Insights and Forecast, 2019-2031
- 7.1. Market Analysis, Insights and Forecast - by Service Provider
- 7.1.1. Banks
- 7.1.2. Trade Finance Companies
- 7.1.3. Insurance Companies
- 7.1.4. Other Service Providers
- 7.2. Market Analysis, Insights and Forecast - by Application
- 7.2.1. Domestic
- 7.2.2. International
- 7.1. Market Analysis, Insights and Forecast - by Service Provider
- 8. Europe Hong Kong Trade Finance Market Analysis, Insights and Forecast, 2019-2031
- 8.1. Market Analysis, Insights and Forecast - by Service Provider
- 8.1.1. Banks
- 8.1.2. Trade Finance Companies
- 8.1.3. Insurance Companies
- 8.1.4. Other Service Providers
- 8.2. Market Analysis, Insights and Forecast - by Application
- 8.2.1. Domestic
- 8.2.2. International
- 8.1. Market Analysis, Insights and Forecast - by Service Provider
- 9. Middle East & Africa Hong Kong Trade Finance Market Analysis, Insights and Forecast, 2019-2031
- 9.1. Market Analysis, Insights and Forecast - by Service Provider
- 9.1.1. Banks
- 9.1.2. Trade Finance Companies
- 9.1.3. Insurance Companies
- 9.1.4. Other Service Providers
- 9.2. Market Analysis, Insights and Forecast - by Application
- 9.2.1. Domestic
- 9.2.2. International
- 9.1. Market Analysis, Insights and Forecast - by Service Provider
- 10. Asia Pacific Hong Kong Trade Finance Market Analysis, Insights and Forecast, 2019-2031
- 10.1. Market Analysis, Insights and Forecast - by Service Provider
- 10.1.1. Banks
- 10.1.2. Trade Finance Companies
- 10.1.3. Insurance Companies
- 10.1.4. Other Service Providers
- 10.2. Market Analysis, Insights and Forecast - by Application
- 10.2.1. Domestic
- 10.2.2. International
- 10.1. Market Analysis, Insights and Forecast - by Service Provider
- 11. Competitive Analysis
- 11.1. Global Market Share Analysis 2024
- 11.2. Company Profiles
- 11.2.1 Bank of China
- 11.2.1.1. Overview
- 11.2.1.2. Products
- 11.2.1.3. SWOT Analysis
- 11.2.1.4. Recent Developments
- 11.2.1.5. Financials (Based on Availability)
- 11.2.2 Standard Chartered
- 11.2.2.1. Overview
- 11.2.2.2. Products
- 11.2.2.3. SWOT Analysis
- 11.2.2.4. Recent Developments
- 11.2.2.5. Financials (Based on Availability)
- 11.2.3 Bank of Communications
- 11.2.3.1. Overview
- 11.2.3.2. Products
- 11.2.3.3. SWOT Analysis
- 11.2.3.4. Recent Developments
- 11.2.3.5. Financials (Based on Availability)
- 11.2.4 Hang Seng Bank
- 11.2.4.1. Overview
- 11.2.4.2. Products
- 11.2.4.3. SWOT Analysis
- 11.2.4.4. Recent Developments
- 11.2.4.5. Financials (Based on Availability)
- 11.2.5 HSBC
- 11.2.5.1. Overview
- 11.2.5.2. Products
- 11.2.5.3. SWOT Analysis
- 11.2.5.4. Recent Developments
- 11.2.5.5. Financials (Based on Availability)
- 11.2.6 DBS Hong Kong
- 11.2.6.1. Overview
- 11.2.6.2. Products
- 11.2.6.3. SWOT Analysis
- 11.2.6.4. Recent Developments
- 11.2.6.5. Financials (Based on Availability)
- 11.2.7 China Citic Bank International
- 11.2.7.1. Overview
- 11.2.7.2. Products
- 11.2.7.3. SWOT Analysis
- 11.2.7.4. Recent Developments
- 11.2.7.5. Financials (Based on Availability)
- 11.2.8 CMB Wing Lung Bank
- 11.2.8.1. Overview
- 11.2.8.2. Products
- 11.2.8.3. SWOT Analysis
- 11.2.8.4. Recent Developments
- 11.2.8.5. Financials (Based on Availability)
- 11.2.9 Shanghai Commercial Bank
- 11.2.9.1. Overview
- 11.2.9.2. Products
- 11.2.9.3. SWOT Analysis
- 11.2.9.4. Recent Developments
- 11.2.9.5. Financials (Based on Availability)
- 11.2.10 Public Bank**List Not Exhaustive
- 11.2.10.1. Overview
- 11.2.10.2. Products
- 11.2.10.3. SWOT Analysis
- 11.2.10.4. Recent Developments
- 11.2.10.5. Financials (Based on Availability)
- 11.2.1 Bank of China
List of Figures
- Figure 1: Global Hong Kong Trade Finance Market Revenue Breakdown (Million, %) by Region 2024 & 2032
- Figure 2: Global Hong Kong Trade Finance Market Volume Breakdown (Billion, %) by Region 2024 & 2032
- Figure 3: North America Hong Kong Trade Finance Market Revenue (Million), by Service Provider 2024 & 2032
- Figure 4: North America Hong Kong Trade Finance Market Volume (Billion), by Service Provider 2024 & 2032
- Figure 5: North America Hong Kong Trade Finance Market Revenue Share (%), by Service Provider 2024 & 2032
- Figure 6: North America Hong Kong Trade Finance Market Volume Share (%), by Service Provider 2024 & 2032
- Figure 7: North America Hong Kong Trade Finance Market Revenue (Million), by Application 2024 & 2032
- Figure 8: North America Hong Kong Trade Finance Market Volume (Billion), by Application 2024 & 2032
- Figure 9: North America Hong Kong Trade Finance Market Revenue Share (%), by Application 2024 & 2032
- Figure 10: North America Hong Kong Trade Finance Market Volume Share (%), by Application 2024 & 2032
- Figure 11: North America Hong Kong Trade Finance Market Revenue (Million), by Country 2024 & 2032
- Figure 12: North America Hong Kong Trade Finance Market Volume (Billion), by Country 2024 & 2032
- Figure 13: North America Hong Kong Trade Finance Market Revenue Share (%), by Country 2024 & 2032
- Figure 14: North America Hong Kong Trade Finance Market Volume Share (%), by Country 2024 & 2032
- Figure 15: South America Hong Kong Trade Finance Market Revenue (Million), by Service Provider 2024 & 2032
- Figure 16: South America Hong Kong Trade Finance Market Volume (Billion), by Service Provider 2024 & 2032
- Figure 17: South America Hong Kong Trade Finance Market Revenue Share (%), by Service Provider 2024 & 2032
- Figure 18: South America Hong Kong Trade Finance Market Volume Share (%), by Service Provider 2024 & 2032
- Figure 19: South America Hong Kong Trade Finance Market Revenue (Million), by Application 2024 & 2032
- Figure 20: South America Hong Kong Trade Finance Market Volume (Billion), by Application 2024 & 2032
- Figure 21: South America Hong Kong Trade Finance Market Revenue Share (%), by Application 2024 & 2032
- Figure 22: South America Hong Kong Trade Finance Market Volume Share (%), by Application 2024 & 2032
- Figure 23: South America Hong Kong Trade Finance Market Revenue (Million), by Country 2024 & 2032
- Figure 24: South America Hong Kong Trade Finance Market Volume (Billion), by Country 2024 & 2032
- Figure 25: South America Hong Kong Trade Finance Market Revenue Share (%), by Country 2024 & 2032
- Figure 26: South America Hong Kong Trade Finance Market Volume Share (%), by Country 2024 & 2032
- Figure 27: Europe Hong Kong Trade Finance Market Revenue (Million), by Service Provider 2024 & 2032
- Figure 28: Europe Hong Kong Trade Finance Market Volume (Billion), by Service Provider 2024 & 2032
- Figure 29: Europe Hong Kong Trade Finance Market Revenue Share (%), by Service Provider 2024 & 2032
- Figure 30: Europe Hong Kong Trade Finance Market Volume Share (%), by Service Provider 2024 & 2032
- Figure 31: Europe Hong Kong Trade Finance Market Revenue (Million), by Application 2024 & 2032
- Figure 32: Europe Hong Kong Trade Finance Market Volume (Billion), by Application 2024 & 2032
- Figure 33: Europe Hong Kong Trade Finance Market Revenue Share (%), by Application 2024 & 2032
- Figure 34: Europe Hong Kong Trade Finance Market Volume Share (%), by Application 2024 & 2032
- Figure 35: Europe Hong Kong Trade Finance Market Revenue (Million), by Country 2024 & 2032
- Figure 36: Europe Hong Kong Trade Finance Market Volume (Billion), by Country 2024 & 2032
- Figure 37: Europe Hong Kong Trade Finance Market Revenue Share (%), by Country 2024 & 2032
- Figure 38: Europe Hong Kong Trade Finance Market Volume Share (%), by Country 2024 & 2032
- Figure 39: Middle East & Africa Hong Kong Trade Finance Market Revenue (Million), by Service Provider 2024 & 2032
- Figure 40: Middle East & Africa Hong Kong Trade Finance Market Volume (Billion), by Service Provider 2024 & 2032
- Figure 41: Middle East & Africa Hong Kong Trade Finance Market Revenue Share (%), by Service Provider 2024 & 2032
- Figure 42: Middle East & Africa Hong Kong Trade Finance Market Volume Share (%), by Service Provider 2024 & 2032
- Figure 43: Middle East & Africa Hong Kong Trade Finance Market Revenue (Million), by Application 2024 & 2032
- Figure 44: Middle East & Africa Hong Kong Trade Finance Market Volume (Billion), by Application 2024 & 2032
- Figure 45: Middle East & Africa Hong Kong Trade Finance Market Revenue Share (%), by Application 2024 & 2032
- Figure 46: Middle East & Africa Hong Kong Trade Finance Market Volume Share (%), by Application 2024 & 2032
- Figure 47: Middle East & Africa Hong Kong Trade Finance Market Revenue (Million), by Country 2024 & 2032
- Figure 48: Middle East & Africa Hong Kong Trade Finance Market Volume (Billion), by Country 2024 & 2032
- Figure 49: Middle East & Africa Hong Kong Trade Finance Market Revenue Share (%), by Country 2024 & 2032
- Figure 50: Middle East & Africa Hong Kong Trade Finance Market Volume Share (%), by Country 2024 & 2032
- Figure 51: Asia Pacific Hong Kong Trade Finance Market Revenue (Million), by Service Provider 2024 & 2032
- Figure 52: Asia Pacific Hong Kong Trade Finance Market Volume (Billion), by Service Provider 2024 & 2032
- Figure 53: Asia Pacific Hong Kong Trade Finance Market Revenue Share (%), by Service Provider 2024 & 2032
- Figure 54: Asia Pacific Hong Kong Trade Finance Market Volume Share (%), by Service Provider 2024 & 2032
- Figure 55: Asia Pacific Hong Kong Trade Finance Market Revenue (Million), by Application 2024 & 2032
- Figure 56: Asia Pacific Hong Kong Trade Finance Market Volume (Billion), by Application 2024 & 2032
- Figure 57: Asia Pacific Hong Kong Trade Finance Market Revenue Share (%), by Application 2024 & 2032
- Figure 58: Asia Pacific Hong Kong Trade Finance Market Volume Share (%), by Application 2024 & 2032
- Figure 59: Asia Pacific Hong Kong Trade Finance Market Revenue (Million), by Country 2024 & 2032
- Figure 60: Asia Pacific Hong Kong Trade Finance Market Volume (Billion), by Country 2024 & 2032
- Figure 61: Asia Pacific Hong Kong Trade Finance Market Revenue Share (%), by Country 2024 & 2032
- Figure 62: Asia Pacific Hong Kong Trade Finance Market Volume Share (%), by Country 2024 & 2032
List of Tables
- Table 1: Global Hong Kong Trade Finance Market Revenue Million Forecast, by Region 2019 & 2032
- Table 2: Global Hong Kong Trade Finance Market Volume Billion Forecast, by Region 2019 & 2032
- Table 3: Global Hong Kong Trade Finance Market Revenue Million Forecast, by Service Provider 2019 & 2032
- Table 4: Global Hong Kong Trade Finance Market Volume Billion Forecast, by Service Provider 2019 & 2032
- Table 5: Global Hong Kong Trade Finance Market Revenue Million Forecast, by Application 2019 & 2032
- Table 6: Global Hong Kong Trade Finance Market Volume Billion Forecast, by Application 2019 & 2032
- Table 7: Global Hong Kong Trade Finance Market Revenue Million Forecast, by Region 2019 & 2032
- Table 8: Global Hong Kong Trade Finance Market Volume Billion Forecast, by Region 2019 & 2032
- Table 9: Global Hong Kong Trade Finance Market Revenue Million Forecast, by Service Provider 2019 & 2032
- Table 10: Global Hong Kong Trade Finance Market Volume Billion Forecast, by Service Provider 2019 & 2032
- Table 11: Global Hong Kong Trade Finance Market Revenue Million Forecast, by Application 2019 & 2032
- Table 12: Global Hong Kong Trade Finance Market Volume Billion Forecast, by Application 2019 & 2032
- Table 13: Global Hong Kong Trade Finance Market Revenue Million Forecast, by Country 2019 & 2032
- Table 14: Global Hong Kong Trade Finance Market Volume Billion Forecast, by Country 2019 & 2032
- Table 15: United States Hong Kong Trade Finance Market Revenue (Million) Forecast, by Application 2019 & 2032
- Table 16: United States Hong Kong Trade Finance Market Volume (Billion) Forecast, by Application 2019 & 2032
- Table 17: Canada Hong Kong Trade Finance Market Revenue (Million) Forecast, by Application 2019 & 2032
- Table 18: Canada Hong Kong Trade Finance Market Volume (Billion) Forecast, by Application 2019 & 2032
- Table 19: Mexico Hong Kong Trade Finance Market Revenue (Million) Forecast, by Application 2019 & 2032
- Table 20: Mexico Hong Kong Trade Finance Market Volume (Billion) Forecast, by Application 2019 & 2032
- Table 21: Global Hong Kong Trade Finance Market Revenue Million Forecast, by Service Provider 2019 & 2032
- Table 22: Global Hong Kong Trade Finance Market Volume Billion Forecast, by Service Provider 2019 & 2032
- Table 23: Global Hong Kong Trade Finance Market Revenue Million Forecast, by Application 2019 & 2032
- Table 24: Global Hong Kong Trade Finance Market Volume Billion Forecast, by Application 2019 & 2032
- Table 25: Global Hong Kong Trade Finance Market Revenue Million Forecast, by Country 2019 & 2032
- Table 26: Global Hong Kong Trade Finance Market Volume Billion Forecast, by Country 2019 & 2032
- Table 27: Brazil Hong Kong Trade Finance Market Revenue (Million) Forecast, by Application 2019 & 2032
- Table 28: Brazil Hong Kong Trade Finance Market Volume (Billion) Forecast, by Application 2019 & 2032
- Table 29: Argentina Hong Kong Trade Finance Market Revenue (Million) Forecast, by Application 2019 & 2032
- Table 30: Argentina Hong Kong Trade Finance Market Volume (Billion) Forecast, by Application 2019 & 2032
- Table 31: Rest of South America Hong Kong Trade Finance Market Revenue (Million) Forecast, by Application 2019 & 2032
- Table 32: Rest of South America Hong Kong Trade Finance Market Volume (Billion) Forecast, by Application 2019 & 2032
- Table 33: Global Hong Kong Trade Finance Market Revenue Million Forecast, by Service Provider 2019 & 2032
- Table 34: Global Hong Kong Trade Finance Market Volume Billion Forecast, by Service Provider 2019 & 2032
- Table 35: Global Hong Kong Trade Finance Market Revenue Million Forecast, by Application 2019 & 2032
- Table 36: Global Hong Kong Trade Finance Market Volume Billion Forecast, by Application 2019 & 2032
- Table 37: Global Hong Kong Trade Finance Market Revenue Million Forecast, by Country 2019 & 2032
- Table 38: Global Hong Kong Trade Finance Market Volume Billion Forecast, by Country 2019 & 2032
- Table 39: United Kingdom Hong Kong Trade Finance Market Revenue (Million) Forecast, by Application 2019 & 2032
- Table 40: United Kingdom Hong Kong Trade Finance Market Volume (Billion) Forecast, by Application 2019 & 2032
- Table 41: Germany Hong Kong Trade Finance Market Revenue (Million) Forecast, by Application 2019 & 2032
- Table 42: Germany Hong Kong Trade Finance Market Volume (Billion) Forecast, by Application 2019 & 2032
- Table 43: France Hong Kong Trade Finance Market Revenue (Million) Forecast, by Application 2019 & 2032
- Table 44: France Hong Kong Trade Finance Market Volume (Billion) Forecast, by Application 2019 & 2032
- Table 45: Italy Hong Kong Trade Finance Market Revenue (Million) Forecast, by Application 2019 & 2032
- Table 46: Italy Hong Kong Trade Finance Market Volume (Billion) Forecast, by Application 2019 & 2032
- Table 47: Spain Hong Kong Trade Finance Market Revenue (Million) Forecast, by Application 2019 & 2032
- Table 48: Spain Hong Kong Trade Finance Market Volume (Billion) Forecast, by Application 2019 & 2032
- Table 49: Russia Hong Kong Trade Finance Market Revenue (Million) Forecast, by Application 2019 & 2032
- Table 50: Russia Hong Kong Trade Finance Market Volume (Billion) Forecast, by Application 2019 & 2032
- Table 51: Benelux Hong Kong Trade Finance Market Revenue (Million) Forecast, by Application 2019 & 2032
- Table 52: Benelux Hong Kong Trade Finance Market Volume (Billion) Forecast, by Application 2019 & 2032
- Table 53: Nordics Hong Kong Trade Finance Market Revenue (Million) Forecast, by Application 2019 & 2032
- Table 54: Nordics Hong Kong Trade Finance Market Volume (Billion) Forecast, by Application 2019 & 2032
- Table 55: Rest of Europe Hong Kong Trade Finance Market Revenue (Million) Forecast, by Application 2019 & 2032
- Table 56: Rest of Europe Hong Kong Trade Finance Market Volume (Billion) Forecast, by Application 2019 & 2032
- Table 57: Global Hong Kong Trade Finance Market Revenue Million Forecast, by Service Provider 2019 & 2032
- Table 58: Global Hong Kong Trade Finance Market Volume Billion Forecast, by Service Provider 2019 & 2032
- Table 59: Global Hong Kong Trade Finance Market Revenue Million Forecast, by Application 2019 & 2032
- Table 60: Global Hong Kong Trade Finance Market Volume Billion Forecast, by Application 2019 & 2032
- Table 61: Global Hong Kong Trade Finance Market Revenue Million Forecast, by Country 2019 & 2032
- Table 62: Global Hong Kong Trade Finance Market Volume Billion Forecast, by Country 2019 & 2032
- Table 63: Turkey Hong Kong Trade Finance Market Revenue (Million) Forecast, by Application 2019 & 2032
- Table 64: Turkey Hong Kong Trade Finance Market Volume (Billion) Forecast, by Application 2019 & 2032
- Table 65: Israel Hong Kong Trade Finance Market Revenue (Million) Forecast, by Application 2019 & 2032
- Table 66: Israel Hong Kong Trade Finance Market Volume (Billion) Forecast, by Application 2019 & 2032
- Table 67: GCC Hong Kong Trade Finance Market Revenue (Million) Forecast, by Application 2019 & 2032
- Table 68: GCC Hong Kong Trade Finance Market Volume (Billion) Forecast, by Application 2019 & 2032
- Table 69: North Africa Hong Kong Trade Finance Market Revenue (Million) Forecast, by Application 2019 & 2032
- Table 70: North Africa Hong Kong Trade Finance Market Volume (Billion) Forecast, by Application 2019 & 2032
- Table 71: South Africa Hong Kong Trade Finance Market Revenue (Million) Forecast, by Application 2019 & 2032
- Table 72: South Africa Hong Kong Trade Finance Market Volume (Billion) Forecast, by Application 2019 & 2032
- Table 73: Rest of Middle East & Africa Hong Kong Trade Finance Market Revenue (Million) Forecast, by Application 2019 & 2032
- Table 74: Rest of Middle East & Africa Hong Kong Trade Finance Market Volume (Billion) Forecast, by Application 2019 & 2032
- Table 75: Global Hong Kong Trade Finance Market Revenue Million Forecast, by Service Provider 2019 & 2032
- Table 76: Global Hong Kong Trade Finance Market Volume Billion Forecast, by Service Provider 2019 & 2032
- Table 77: Global Hong Kong Trade Finance Market Revenue Million Forecast, by Application 2019 & 2032
- Table 78: Global Hong Kong Trade Finance Market Volume Billion Forecast, by Application 2019 & 2032
- Table 79: Global Hong Kong Trade Finance Market Revenue Million Forecast, by Country 2019 & 2032
- Table 80: Global Hong Kong Trade Finance Market Volume Billion Forecast, by Country 2019 & 2032
- Table 81: China Hong Kong Trade Finance Market Revenue (Million) Forecast, by Application 2019 & 2032
- Table 82: China Hong Kong Trade Finance Market Volume (Billion) Forecast, by Application 2019 & 2032
- Table 83: India Hong Kong Trade Finance Market Revenue (Million) Forecast, by Application 2019 & 2032
- Table 84: India Hong Kong Trade Finance Market Volume (Billion) Forecast, by Application 2019 & 2032
- Table 85: Japan Hong Kong Trade Finance Market Revenue (Million) Forecast, by Application 2019 & 2032
- Table 86: Japan Hong Kong Trade Finance Market Volume (Billion) Forecast, by Application 2019 & 2032
- Table 87: South Korea Hong Kong Trade Finance Market Revenue (Million) Forecast, by Application 2019 & 2032
- Table 88: South Korea Hong Kong Trade Finance Market Volume (Billion) Forecast, by Application 2019 & 2032
- Table 89: ASEAN Hong Kong Trade Finance Market Revenue (Million) Forecast, by Application 2019 & 2032
- Table 90: ASEAN Hong Kong Trade Finance Market Volume (Billion) Forecast, by Application 2019 & 2032
- Table 91: Oceania Hong Kong Trade Finance Market Revenue (Million) Forecast, by Application 2019 & 2032
- Table 92: Oceania Hong Kong Trade Finance Market Volume (Billion) Forecast, by Application 2019 & 2032
- Table 93: Rest of Asia Pacific Hong Kong Trade Finance Market Revenue (Million) Forecast, by Application 2019 & 2032
- Table 94: Rest of Asia Pacific Hong Kong Trade Finance Market Volume (Billion) Forecast, by Application 2019 & 2032
Frequently Asked Questions
1. What is the projected Compound Annual Growth Rate (CAGR) of the Hong Kong Trade Finance Market?
The projected CAGR is approximately 6.50%.
2. Which companies are prominent players in the Hong Kong Trade Finance Market?
Key companies in the market include Bank of China, Standard Chartered, Bank of Communications, Hang Seng Bank, HSBC, DBS Hong Kong, China Citic Bank International, CMB Wing Lung Bank, Shanghai Commercial Bank, Public Bank**List Not Exhaustive.
3. What are the main segments of the Hong Kong Trade Finance Market?
The market segments include Service Provider, Application.
4. Can you provide details about the market size?
The market size is estimated to be USD 57 Million as of 2022.
5. What are some drivers contributing to market growth?
Accelerated Digital Adoption is Driving the Market; Economic Conditions.
6. What are the notable trends driving market growth?
Technological Advancements and Digitalization are Driving the Market.
7. Are there any restraints impacting market growth?
Accelerated Digital Adoption is Driving the Market; Economic Conditions.
8. Can you provide examples of recent developments in the market?
August 2023: Hang Seng Bank increased its presence in the cross-border wealth management sector by leveraging the "Wealth Connect" system, which connects mainland China, Hong Kong, and the Greater Bay Area.
9. What pricing options are available for accessing the report?
Pricing options include single-user, multi-user, and enterprise licenses priced at USD 3800, USD 4500, and USD 5800 respectively.
10. Is the market size provided in terms of value or volume?
The market size is provided in terms of value, measured in Million and volume, measured in Billion.
11. Are there any specific market keywords associated with the report?
Yes, the market keyword associated with the report is "Hong Kong Trade Finance Market," which aids in identifying and referencing the specific market segment covered.
12. How do I determine which pricing option suits my needs best?
The pricing options vary based on user requirements and access needs. Individual users may opt for single-user licenses, while businesses requiring broader access may choose multi-user or enterprise licenses for cost-effective access to the report.
13. Are there any additional resources or data provided in the Hong Kong Trade Finance Market report?
While the report offers comprehensive insights, it's advisable to review the specific contents or supplementary materials provided to ascertain if additional resources or data are available.
14. How can I stay updated on further developments or reports in the Hong Kong Trade Finance Market?
To stay informed about further developments, trends, and reports in the Hong Kong Trade Finance Market, consider subscribing to industry newsletters, following relevant companies and organizations, or regularly checking reputable industry news sources and publications.
Methodology
Step 1 - Identification of Relevant Samples Size from Population Database


Step 2 - Approaches for Defining Global Market Size (Value, Volume* & Price*)

Note*: In applicable scenarios
Step 3 - Data Sources
Primary Research
- Web Analytics
- Survey Reports
- Research Institute
- Latest Research Reports
- Opinion Leaders
Secondary Research
- Annual Reports
- White Paper
- Latest Press Release
- Industry Association
- Paid Database
- Investor Presentations

Step 4 - Data Triangulation
Involves using different sources of information in order to increase the validity of a study
These sources are likely to be stakeholders in a program - participants, other researchers, program staff, other community members, and so on.
Then we put all data in single framework & apply various statistical tools to find out the dynamic on the market.
During the analysis stage, feedback from the stakeholder groups would be compared to determine areas of agreement as well as areas of divergence
