

Key Insights
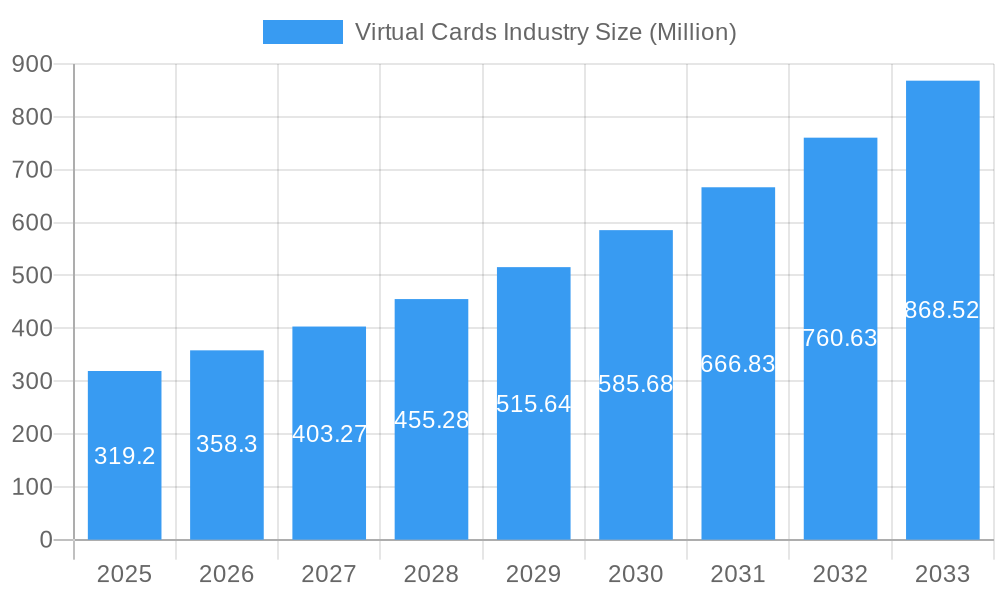
The virtual cards market is experiencing robust growth, projected to reach $319.20 million in 2025 and maintain a Compound Annual Growth Rate (CAGR) exceeding 12% through 2033. This expansion is driven by several key factors. The increasing adoption of digital payment solutions across both B2B and B2C sectors fuels demand for secure and efficient virtual card transactions. Furthermore, the rise of e-commerce and online marketplaces necessitates convenient and trackable payment methods, solidifying the role of virtual cards. The market segmentation reveals a strong presence across diverse product types, including B2B virtual cards used for streamlined vendor payments, B2C remote payment cards for online purchases, and B2C POS virtual cards for enhanced security at physical points of sale. End-user segments show significant growth in both consumer and business applications, driven by factors like enhanced security features, fraud prevention mechanisms, and improved expense management capabilities. The geographic distribution shows strong growth across all regions, with North America and Asia-Pacific leading the market due to their advanced digital infrastructure and high adoption rates of online transactions.
Virtual Cards Industry Market Size (In Million)
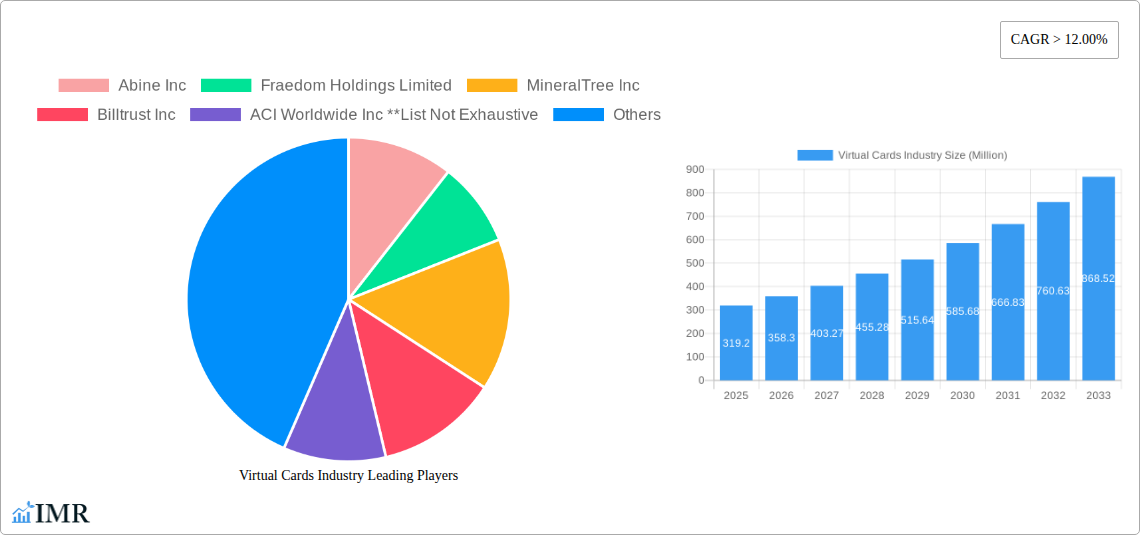
The competitive landscape is characterized by a mix of established players like American Express, Mastercard, and JPMorgan Chase, alongside specialized fintech companies such as Abine Inc, Fraedom Holdings Limited, and MineralTree Inc. These companies are investing heavily in innovation, expanding their product offerings, and forging strategic partnerships to capture market share. Growth is further fueled by increasing regulatory support for digital payment methods and a shift towards contactless transactions. While certain restraints, such as security concerns and the need for robust fraud detection systems, exist, the overall market outlook remains positive, promising sustained growth driven by technological advancements and evolving consumer preferences for digital payment solutions. The market is poised to witness significant innovation in areas like biometrics, AI-powered fraud detection, and integration with other financial services.
Virtual Cards Industry Company Market Share
Virtual Cards Industry Market Report: 2019-2033
This comprehensive report provides a detailed analysis of the Virtual Cards industry, encompassing market dynamics, growth trends, regional segmentation, product landscape, key players, and future outlook. The study period spans from 2019 to 2033, with 2025 serving as the base and estimated year. The report leverages extensive data analysis to provide actionable insights for industry professionals, investors, and stakeholders. The report covers both parent market (Payment Processing) and child market (Virtual Cards) to provide comprehensive market overview.
Study Period: 2019-2033 Base Year: 2025 Estimated Year: 2025 Forecast Period: 2025-2033 Historical Period: 2019-2024
Virtual Cards Industry Market Dynamics & Structure
The global virtual cards market is experiencing robust growth, driven by the increasing adoption of digital payment methods and the expanding e-commerce landscape. Market concentration is moderate, with several key players vying for market share. Technological advancements, such as tokenization and enhanced security features, are key innovation drivers. Regulatory frameworks, however, vary across regions, influencing market dynamics. Competitive substitutes include traditional credit and debit cards, but virtual cards offer superior security and convenience. End-user demographics are shifting towards younger, digitally savvy consumers and businesses prioritizing streamlined financial management. M&A activity remains significant, with larger players acquiring smaller fintech companies to enhance their product offerings and expand market reach.
- Market Concentration: Moderate, with a few dominant players and numerous smaller niche players.
- Technological Innovation: Tokenization, enhanced security protocols, biometrics, AI-driven fraud detection are key drivers.
- Regulatory Landscape: Varies significantly across regions, impacting market expansion and adoption.
- Competitive Substitutes: Traditional credit/debit cards, mobile wallets (e.g., Apple Pay, Google Pay).
- End-User Demographics: Shifting towards younger generations and businesses seeking efficiency.
- M&A Activity: Significant, with xx deals recorded between 2019 and 2024, representing a xx% increase over the previous period. Market share consolidation is expected to continue.
Virtual Cards Industry Growth Trends & Insights
The virtual cards market is experiencing significant growth, propelled by the increasing preference for contactless and digital payments. The market size is projected to reach xx Million by 2025 and xx Million by 2033, exhibiting a CAGR of xx% during the forecast period. This expansion is attributed to rising e-commerce transactions, increasing smartphone penetration, and the growing adoption of virtual cards across various industries. Technological advancements, such as improved security features and seamless integration with existing payment systems, are further fueling market growth. Consumer behavior is evolving towards cashless transactions and preference for convenient and secure online payment methods. Market penetration is anticipated to increase from xx% in 2025 to xx% by 2033.
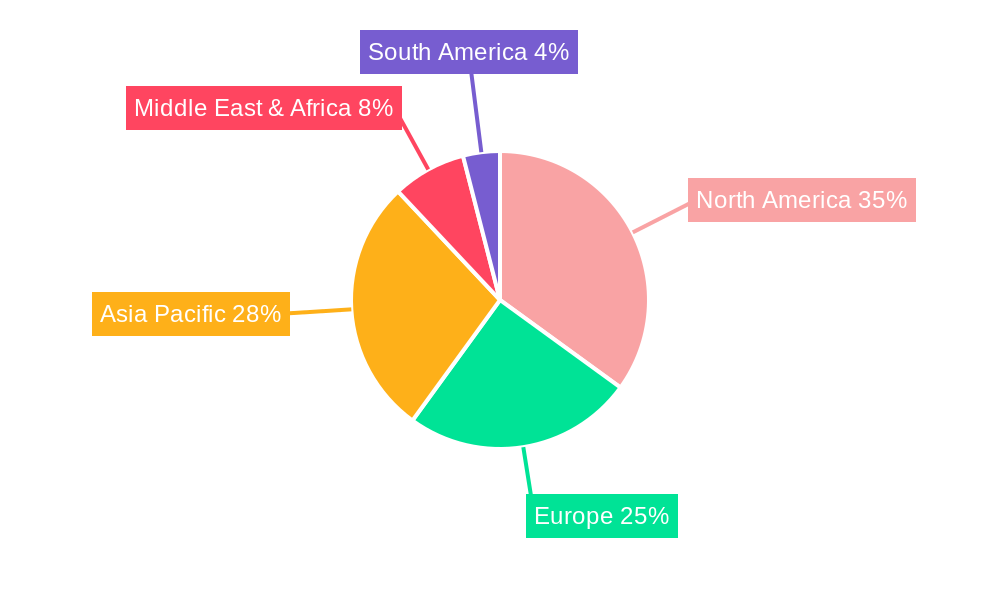
Dominant Regions, Countries, or Segments in Virtual Cards Industry
North America currently dominates the virtual cards market, driven by high digital adoption rates, robust e-commerce infrastructure, and strong regulatory support. However, Asia-Pacific is experiencing the fastest growth, fueled by a burgeoning middle class, rapid smartphone penetration, and expanding digital payment ecosystems. Within product types, B2B virtual cards hold the largest market share due to widespread enterprise adoption for expense management and supplier payments. The Consumer Use segment is experiencing rapid growth, particularly within B2C Remote Payment Virtual Cards.
- North America: High adoption rates, robust e-commerce infrastructure, and strong regulatory support.
- Asia-Pacific: Fastest-growing region due to increasing smartphone penetration and expanding digital payment ecosystems.
- B2B Virtual Cards: Largest segment driven by enterprise adoption for expense management and supplier payments.
- B2C Remote Payment Virtual Cards: Rapid growth in consumer segment fueled by e-commerce and online transactions.
- Key Drivers: Favorable government policies, robust digital infrastructure, increasing internet and smartphone penetration.
Virtual Cards Industry Product Landscape
Virtual cards offer a wide array of functionalities, from single-use cards for online purchases to recurring-payment solutions for subscription services. Innovations focus on enhanced security, including tokenization and biometric authentication. Furthermore, integration with accounting and expense management software streamlines business processes. Key performance indicators include transaction volumes, fraud rates, and customer satisfaction. Unique selling propositions include improved security, cost-effectiveness, and real-time transaction monitoring. Technological advancements such as AI-powered fraud detection systems are enhancing the overall user experience.
Key Drivers, Barriers & Challenges in Virtual Cards Industry
Key Drivers:
- The increasing popularity of e-commerce and digital payments.
- The growing need for secure and convenient payment solutions.
- Technological advancements, such as tokenization and biometric authentication.
- Government initiatives promoting digital financial inclusion.
Key Challenges:
- Security concerns related to data breaches and fraud.
- Regulatory hurdles and compliance requirements across various jurisdictions.
- Competition from traditional payment methods and other digital wallets.
- The need for widespread consumer education and awareness. Lack of consumer trust, particularly in emerging markets, hinders wider adoption. Estimated impact on market growth: xx% reduction by 2033.
Emerging Opportunities in Virtual Cards Industry
Untapped markets in developing economies present significant opportunities for growth. Innovative applications, such as integrating virtual cards with loyalty programs and rewards systems, can enhance customer engagement. The growing adoption of virtual cards in the healthcare and travel industries offers lucrative opportunities. Evolving consumer preferences, such as demand for personalized payment solutions, also create avenues for innovation.
Growth Accelerators in the Virtual Cards Industry
Technological breakthroughs in areas like blockchain and AI are poised to revolutionize the virtual card industry. Strategic partnerships between fintech companies and established financial institutions will accelerate market penetration. Expanding into new geographic markets, particularly in developing countries with high growth potential, will further drive expansion.
Key Players Shaping the Virtual Cards Industry Market
- Abine Inc
- Fraedom Holdings Limited
- MineralTree Inc
- Billtrust Inc
- ACI Worldwide Inc
- American Express Company
- Mastercard Incorporated
- JPMorgan Chase & Co
- Alipay com Co Ltd
- Skrill USA Inc
Notable Milestones in Virtual Cards Industry Sector
- December 2023: Conferma Pay and Mastercard expanded their partnership to enable mobile virtual card payments, enhancing convenience for corporate customers.
- May 2022: Mastercard and OPay partnered to expand financial inclusion and digital commerce across the Middle East and Africa.
In-Depth Virtual Cards Industry Market Outlook
The virtual cards market is poised for continued robust growth, driven by technological advancements, strategic partnerships, and increasing consumer adoption. The future holds immense potential for innovation, with new applications and functionalities emerging to meet evolving customer needs. Strategic investments in security infrastructure and expansion into untapped markets will be critical for success in this dynamic landscape. The market is expected to witness significant consolidation as larger players acquire smaller companies to expand their product offerings and market reach.
Virtual Cards Industry Segmentation
-
1. Product Type
- 1.1. B2B Virtual Cards
- 1.2. B2C Remote Payment Virtual Cards
- 1.3. B2C POS Virtual Cards
-
2. End User
- 2.1. Consumer Use
- 2.2. Business Use
Virtual Cards Industry Segmentation By Geography
-
1. North America
- 1.1. United States
- 1.2. Canada
- 1.3. Rest of North America
-
2. South America
- 2.1. Brazil
- 2.2. Peru
- 2.3. Rest of South America
-
3. Europe
- 3.1. United Kingdom
- 3.2. Germany
- 3.3. Rest of Europe
-
4. Asia Pacific
- 4.1. India
- 4.2. Japan
- 4.3. Rest of Asia Pacific
- 5. Middle East
-
6. Saudi Arabia
- 6.1. United Arab Emirates
- 6.2. Rest of Middle East
Virtual Cards Industry Regional Market Share
Geographic Coverage of Virtual Cards Industry
Virtual Cards Industry REPORT HIGHLIGHTS
| Aspects | Details |
|---|---|
| Study Period | 2020-2034 |
| Base Year | 2025 |
| Estimated Year | 2026 |
| Forecast Period | 2026-2034 |
| Historical Period | 2020-2025 |
| Growth Rate | CAGR of > 12.00% from 2020-2034 |
| Segmentation |
|
Table of Contents
- 1. Introduction
- 1.1. Research Scope
- 1.2. Market Segmentation
- 1.3. Research Objective
- 1.4. Definitions and Assumptions
- 2. Executive Summary
- 2.1. Market Snapshot
- 3. Market Dynamics
- 3.1. Market Drivers
- 3.2. Market Restrains
- 3.3. Market Trends
- 3.4. Market Opportunities
- 4. Market Factor Analysis
- 4.1. Porters Five Forces
- 4.1.1. Bargaining Power of Suppliers
- 4.1.2. Bargaining Power of Buyers
- 4.1.3. Threat of New Entrants
- 4.1.4. Threat of Substitutes
- 4.1.5. Competitive Rivalry
- 4.2. PESTEL analysis
- 4.3. BCG Analysis
- 4.3.1. Stars (High Growth, High Market Share)
- 4.3.2. Cash Cows (Low Growth, High Market Share)
- 4.3.3. Question Mark (High Growth, Low Market Share)
- 4.3.4. Dogs (Low Growth, Low Market Share)
- 4.4. Ansoff Matrix Analysis
- 4.5. Supply Chain Analysis
- 4.6. Regulatory Landscape
- 4.7. Current Market Potential and Opportunity Assessment (TAM–SAM–SOM Framework)
- 4.8. IMR Analyst Note
- 4.1. Porters Five Forces
- 5. Market Analysis, Insights and Forecast 2021-2033
- 5.1. Market Analysis, Insights and Forecast - by Product Type
- 5.1.1. B2B Virtual Cards
- 5.1.2. B2C Remote Payment Virtual Cards
- 5.1.3. B2C POS Virtual Cards
- 5.2. Market Analysis, Insights and Forecast - by End User
- 5.2.1. Consumer Use
- 5.2.2. Business Use
- 5.3. Market Analysis, Insights and Forecast - by Region
- 5.3.1. North America
- 5.3.2. South America
- 5.3.3. Europe
- 5.3.4. Asia Pacific
- 5.3.5. Middle East
- 5.3.6. Saudi Arabia
- 5.1. Market Analysis, Insights and Forecast - by Product Type
- 6. Virtual Cards Industry Analysis, Insights and Forecast, 2021-2033
- 6.1. Market Analysis, Insights and Forecast - by Product Type
- 6.1.1. B2B Virtual Cards
- 6.1.2. B2C Remote Payment Virtual Cards
- 6.1.3. B2C POS Virtual Cards
- 6.2. Market Analysis, Insights and Forecast - by End User
- 6.2.1. Consumer Use
- 6.2.2. Business Use
- 6.1. Market Analysis, Insights and Forecast - by Product Type
- 7. North America Virtual Cards Industry Analysis, Insights and Forecast, 2020-2032
- 7.1. Market Analysis, Insights and Forecast - by Product Type
- 7.1.1. B2B Virtual Cards
- 7.1.2. B2C Remote Payment Virtual Cards
- 7.1.3. B2C POS Virtual Cards
- 7.2. Market Analysis, Insights and Forecast - by End User
- 7.2.1. Consumer Use
- 7.2.2. Business Use
- 7.1. Market Analysis, Insights and Forecast - by Product Type
- 8. South America Virtual Cards Industry Analysis, Insights and Forecast, 2020-2032
- 8.1. Market Analysis, Insights and Forecast - by Product Type
- 8.1.1. B2B Virtual Cards
- 8.1.2. B2C Remote Payment Virtual Cards
- 8.1.3. B2C POS Virtual Cards
- 8.2. Market Analysis, Insights and Forecast - by End User
- 8.2.1. Consumer Use
- 8.2.2. Business Use
- 8.1. Market Analysis, Insights and Forecast - by Product Type
- 9. Europe Virtual Cards Industry Analysis, Insights and Forecast, 2020-2032
- 9.1. Market Analysis, Insights and Forecast - by Product Type
- 9.1.1. B2B Virtual Cards
- 9.1.2. B2C Remote Payment Virtual Cards
- 9.1.3. B2C POS Virtual Cards
- 9.2. Market Analysis, Insights and Forecast - by End User
- 9.2.1. Consumer Use
- 9.2.2. Business Use
- 9.1. Market Analysis, Insights and Forecast - by Product Type
- 10. Asia Pacific Virtual Cards Industry Analysis, Insights and Forecast, 2020-2032
- 10.1. Market Analysis, Insights and Forecast - by Product Type
- 10.1.1. B2B Virtual Cards
- 10.1.2. B2C Remote Payment Virtual Cards
- 10.1.3. B2C POS Virtual Cards
- 10.2. Market Analysis, Insights and Forecast - by End User
- 10.2.1. Consumer Use
- 10.2.2. Business Use
- 10.1. Market Analysis, Insights and Forecast - by Product Type
- 11. Middle East Virtual Cards Industry Analysis, Insights and Forecast, 2020-2032
- 11.1. Market Analysis, Insights and Forecast - by Product Type
- 11.1.1. B2B Virtual Cards
- 11.1.2. B2C Remote Payment Virtual Cards
- 11.1.3. B2C POS Virtual Cards
- 11.2. Market Analysis, Insights and Forecast - by End User
- 11.2.1. Consumer Use
- 11.2.2. Business Use
- 11.1. Market Analysis, Insights and Forecast - by Product Type
- 12. Saudi Arabia Virtual Cards Industry Analysis, Insights and Forecast, 2020-2032
- 12.1. Market Analysis, Insights and Forecast - by Product Type
- 12.1.1. B2B Virtual Cards
- 12.1.2. B2C Remote Payment Virtual Cards
- 12.1.3. B2C POS Virtual Cards
- 12.2. Market Analysis, Insights and Forecast - by End User
- 12.2.1. Consumer Use
- 12.2.2. Business Use
- 12.1. Market Analysis, Insights and Forecast - by Product Type
- 13. Competitive Analysis
- 13.1. Company Profiles
- 13.1.1 Abine Inc
- 13.1.1.1. Company Overview
- 13.1.1.2. Products
- 13.1.1.3. Company Financials
- 13.1.1.4. SWOT Analysis
- 13.1.2 Fraedom Holdings Limited
- 13.1.2.1. Company Overview
- 13.1.2.2. Products
- 13.1.2.3. Company Financials
- 13.1.2.4. SWOT Analysis
- 13.1.3 MineralTree Inc
- 13.1.3.1. Company Overview
- 13.1.3.2. Products
- 13.1.3.3. Company Financials
- 13.1.3.4. SWOT Analysis
- 13.1.4 Billtrust Inc
- 13.1.4.1. Company Overview
- 13.1.4.2. Products
- 13.1.4.3. Company Financials
- 13.1.4.4. SWOT Analysis
- 13.1.5 ACI Worldwide Inc **List Not Exhaustive
- 13.1.5.1. Company Overview
- 13.1.5.2. Products
- 13.1.5.3. Company Financials
- 13.1.5.4. SWOT Analysis
- 13.1.6 American Express Company
- 13.1.6.1. Company Overview
- 13.1.6.2. Products
- 13.1.6.3. Company Financials
- 13.1.6.4. SWOT Analysis
- 13.1.7 Mastercard Incorporated
- 13.1.7.1. Company Overview
- 13.1.7.2. Products
- 13.1.7.3. Company Financials
- 13.1.7.4. SWOT Analysis
- 13.1.8 JPMorgan Chase & Co
- 13.1.8.1. Company Overview
- 13.1.8.2. Products
- 13.1.8.3. Company Financials
- 13.1.8.4. SWOT Analysis
- 13.1.9 Alipay com Co Ltd
- 13.1.9.1. Company Overview
- 13.1.9.2. Products
- 13.1.9.3. Company Financials
- 13.1.9.4. SWOT Analysis
- 13.1.10 Skrill USA Inc
- 13.1.10.1. Company Overview
- 13.1.10.2. Products
- 13.1.10.3. Company Financials
- 13.1.10.4. SWOT Analysis
- 13.1.1 Abine Inc
- 13.2. Market Entropy
- 13.2.1 Company's Key Areas Served
- 13.2.2 Recent Developments
- 13.3. Company Market Share Analysis 2025
- 13.3.1 Top 5 Companies Market Share Analysis
- 13.3.2 Top 3 Companies Market Share Analysis
- 13.4. List of Potential Customers
- 14. Research Methodology
List of Figures
- Figure 1: Virtual Cards Industry Revenue Breakdown (Million, %) by Product 2025 & 2033
- Figure 2: Virtual Cards Industry Share (%) by Company 2025
List of Tables
- Table 1: Virtual Cards Industry Revenue Million Forecast, by Product Type 2020 & 2033
- Table 2: Virtual Cards Industry Revenue Million Forecast, by End User 2020 & 2033
- Table 3: Virtual Cards Industry Revenue Million Forecast, by Region 2020 & 2033
- Table 4: Virtual Cards Industry Revenue Million Forecast, by Product Type 2020 & 2033
- Table 5: Virtual Cards Industry Revenue Million Forecast, by End User 2020 & 2033
- Table 6: Virtual Cards Industry Revenue Million Forecast, by Country 2020 & 2033
- Table 7: United States Virtual Cards Industry Revenue (Million) Forecast, by Application 2020 & 2033
- Table 8: Canada Virtual Cards Industry Revenue (Million) Forecast, by Application 2020 & 2033
- Table 9: Rest of North America Virtual Cards Industry Revenue (Million) Forecast, by Application 2020 & 2033
- Table 10: Virtual Cards Industry Revenue Million Forecast, by Product Type 2020 & 2033
- Table 11: Virtual Cards Industry Revenue Million Forecast, by End User 2020 & 2033
- Table 12: Virtual Cards Industry Revenue Million Forecast, by Country 2020 & 2033
- Table 13: Brazil Virtual Cards Industry Revenue (Million) Forecast, by Application 2020 & 2033
- Table 14: Peru Virtual Cards Industry Revenue (Million) Forecast, by Application 2020 & 2033
- Table 15: Rest of South America Virtual Cards Industry Revenue (Million) Forecast, by Application 2020 & 2033
- Table 16: Virtual Cards Industry Revenue Million Forecast, by Product Type 2020 & 2033
- Table 17: Virtual Cards Industry Revenue Million Forecast, by End User 2020 & 2033
- Table 18: Virtual Cards Industry Revenue Million Forecast, by Country 2020 & 2033
- Table 19: United Kingdom Virtual Cards Industry Revenue (Million) Forecast, by Application 2020 & 2033
- Table 20: Germany Virtual Cards Industry Revenue (Million) Forecast, by Application 2020 & 2033
- Table 21: Rest of Europe Virtual Cards Industry Revenue (Million) Forecast, by Application 2020 & 2033
- Table 22: Virtual Cards Industry Revenue Million Forecast, by Product Type 2020 & 2033
- Table 23: Virtual Cards Industry Revenue Million Forecast, by End User 2020 & 2033
- Table 24: Virtual Cards Industry Revenue Million Forecast, by Country 2020 & 2033
- Table 25: India Virtual Cards Industry Revenue (Million) Forecast, by Application 2020 & 2033
- Table 26: Japan Virtual Cards Industry Revenue (Million) Forecast, by Application 2020 & 2033
- Table 27: Rest of Asia Pacific Virtual Cards Industry Revenue (Million) Forecast, by Application 2020 & 2033
- Table 28: Virtual Cards Industry Revenue Million Forecast, by Product Type 2020 & 2033
- Table 29: Virtual Cards Industry Revenue Million Forecast, by End User 2020 & 2033
- Table 30: Virtual Cards Industry Revenue Million Forecast, by Country 2020 & 2033
- Table 31: Virtual Cards Industry Revenue Million Forecast, by Product Type 2020 & 2033
- Table 32: Virtual Cards Industry Revenue Million Forecast, by End User 2020 & 2033
- Table 33: Virtual Cards Industry Revenue Million Forecast, by Country 2020 & 2033
- Table 34: United Arab Emirates Virtual Cards Industry Revenue (Million) Forecast, by Application 2020 & 2033
- Table 35: Rest of Middle East Virtual Cards Industry Revenue (Million) Forecast, by Application 2020 & 2033
Frequently Asked Questions
1. What is the projected Compound Annual Growth Rate (CAGR) of the Virtual Cards Industry?
The projected CAGR is approximately > 12.00%.
2. Which companies are prominent players in the Virtual Cards Industry?
Key companies in the market include Abine Inc, Fraedom Holdings Limited, MineralTree Inc, Billtrust Inc, ACI Worldwide Inc **List Not Exhaustive, American Express Company, Mastercard Incorporated, JPMorgan Chase & Co, Alipay com Co Ltd, Skrill USA Inc.
3. What are the main segments of the Virtual Cards Industry?
The market segments include Product Type, End User.
4. Can you provide details about the market size?
The market size is estimated to be USD 319.20 Million as of 2022.
5. What are some drivers contributing to market growth?
Digital Transformation is Driving the Market.
6. What are the notable trends driving market growth?
Increasing Online Transactions is Augmenting the Virtual Cards Market in Asia-Pacific.
7. Are there any restraints impacting market growth?
Connectivity and Technical Issues is Restraining the Market.
8. Can you provide examples of recent developments in the market?
December 2023: Conferma Pay and Mastercard expanded their partnership to enable mobile virtual card payments. Mastercard’s commercial bank clients were expected to be able to offer the convenience of contactless virtual card payments to their corporate customers using Conferma Pay.
9. What pricing options are available for accessing the report?
Pricing options include single-user, multi-user, and enterprise licenses priced at USD 3800, USD 4500, and USD 5800 respectively.
10. Is the market size provided in terms of value or volume?
The market size is provided in terms of value, measured in Million.
11. Are there any specific market keywords associated with the report?
Yes, the market keyword associated with the report is "Virtual Cards Industry," which aids in identifying and referencing the specific market segment covered.
12. How do I determine which pricing option suits my needs best?
The pricing options vary based on user requirements and access needs. Individual users may opt for single-user licenses, while businesses requiring broader access may choose multi-user or enterprise licenses for cost-effective access to the report.
13. Are there any additional resources or data provided in the Virtual Cards Industry report?
While the report offers comprehensive insights, it's advisable to review the specific contents or supplementary materials provided to ascertain if additional resources or data are available.
14. How can I stay updated on further developments or reports in the Virtual Cards Industry?
To stay informed about further developments, trends, and reports in the Virtual Cards Industry, consider subscribing to industry newsletters, following relevant companies and organizations, or regularly checking reputable industry news sources and publications.
Methodology
Step 1 - Identification of Relevant Samples Size from Population Database


Step 2 - Approaches for Defining Global Market Size (Value, Volume* & Price*)

Note*: In applicable scenarios
Step 3 - Data Sources
Primary Research
- Web Analytics
- Survey Reports
- Research Institute
- Latest Research Reports
- Opinion Leaders
Secondary Research
- Annual Reports
- White Paper
- Latest Press Release
- Industry Association
- Paid Database
- Investor Presentations

Step 4 - Data Triangulation
Involves using different sources of information in order to increase the validity of a study
These sources are likely to be stakeholders in a program - participants, other researchers, program staff, other community members, and so on.
Then we put all data in single framework & apply various statistical tools to find out the dynamic on the market.
During the analysis stage, feedback from the stakeholder groups would be compared to determine areas of agreement as well as areas of divergence