

Key Insights
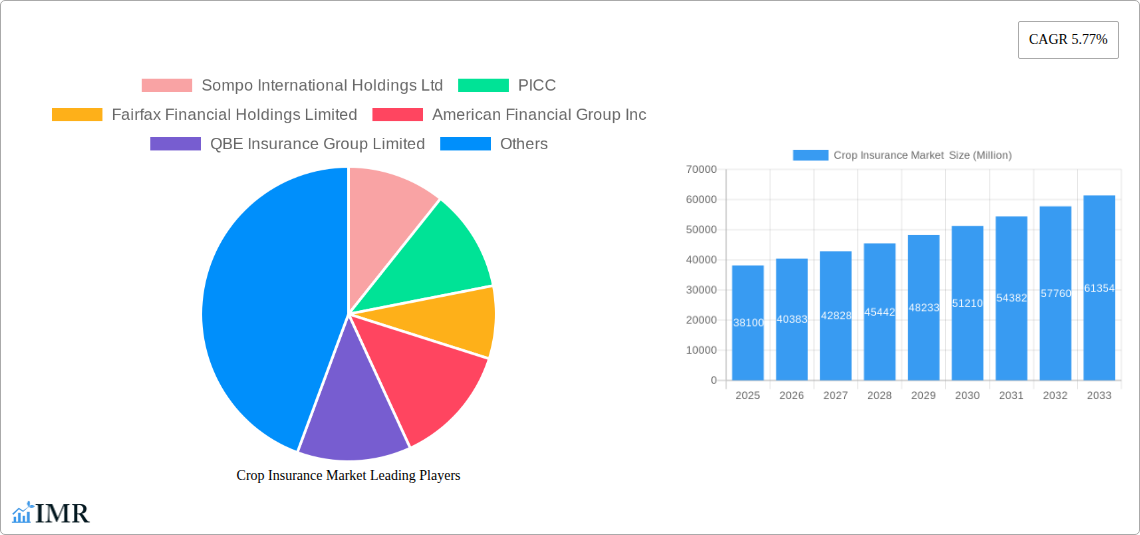
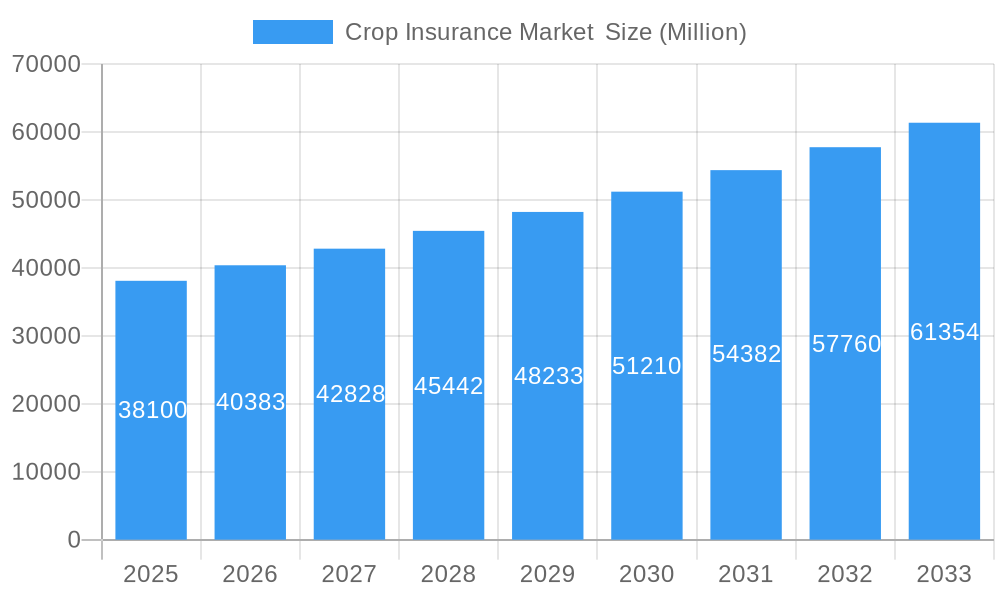
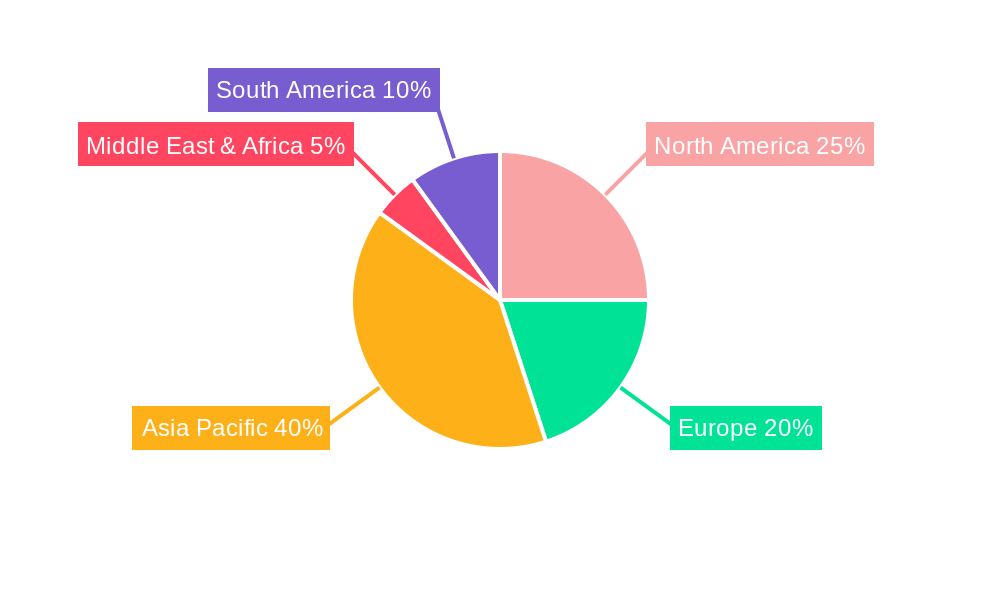
The global crop insurance market, valued at $38.10 billion in 2025, is projected to experience robust growth, exhibiting a compound annual growth rate (CAGR) of 5.77% from 2025 to 2033. This expansion is driven by several key factors. Increasing frequency and severity of climate change-related events, such as droughts, floods, and extreme weather patterns, are significantly impacting agricultural yields, compelling farmers to seek greater risk mitigation through insurance. Government initiatives and subsidies aimed at promoting agricultural insurance penetration in developing nations are also contributing to market growth. Furthermore, technological advancements, including the use of remote sensing, precision agriculture, and data analytics, are improving risk assessment and claims processing efficiency, making crop insurance more accessible and affordable. The market is segmented by coverage type (localized calamities, sowing/planting/germination risk, standing crop loss, post-harvest losses), distribution channel (banks, insurance companies, brokers and agents), and insurance type (multiple peril crop insurance, actual production history, crop revenue coverage). The Asia-Pacific region, with its large agricultural sector and growing awareness of risk management, is expected to be a key driver of market growth, followed by North America and Europe. Competition among established players like Sompo International Holdings Ltd, PICC, Fairfax Financial Holdings Limited, and several others is intensifying, leading to product innovation and competitive pricing.
Crop Insurance Market Market Size (In Billion)
The market's growth trajectory is not without its challenges. Regulatory hurdles, lack of awareness among farmers in certain regions, and difficulties in accurately assessing crop losses in remote areas remain significant restraints. However, ongoing efforts to improve insurance products, strengthen distribution networks, and leverage technology are expected to mitigate these challenges. The shift towards more sophisticated insurance products like index-based insurance, tailored to specific climate risks and farming practices, is also gaining momentum, providing new avenues for market expansion. The diverse range of insurance types and coverage options caters to the varying needs of farmers across different regions and agricultural contexts. This market diversity ensures sustainable growth and resilience in the face of evolving agricultural landscapes.
Crop Insurance Market Company Market Share
Crop Insurance Market: A Comprehensive Market Report (2019-2033)
This comprehensive report provides a detailed analysis of the Crop Insurance Market, encompassing its current state, future projections, and key players. With a focus on market segments like Multiple Peril Crop Insurance, Actual Production History, and Crop Revenue Coverage, this report offers invaluable insights for industry professionals, investors, and stakeholders. The study period covers 2019-2033, with 2025 as the base and estimated year. The forecast period is 2025-2033, and the historical period is 2019-2024. The market size is projected to reach xx Million by 2033.
Crop Insurance Market Dynamics & Structure
This section delves into the intricate dynamics shaping the Crop Insurance Market. We analyze market concentration, revealing the dominance of key players like Sompo International Holdings Ltd, PICC, Fairfax Financial Holdings Limited, American Financial Group Inc, QBE Insurance Group Limited, ICICI Lombard General Insurance Company Limited, Zurich, Chubb, Tokio Marine HCC, and Agriculture Insurance Company of India Limited (AIC), while acknowledging that this list is not exhaustive. The report quantifies market share for major players and examines the impact of mergers and acquisitions (M&A) activity, estimating xx M&A deals in the past five years.
- Market Concentration: The market exhibits a moderately concentrated structure with a few large players holding significant market share. The Herfindahl-Hirschman Index (HHI) is estimated at xx, indicating a moderately competitive landscape.
- Technological Innovation: Technological advancements in data analytics, remote sensing, and precision agriculture are driving innovation in crop insurance product offerings and risk assessment methodologies. However, data access and integration challenges pose barriers to widespread adoption.
- Regulatory Framework: Government regulations and subsidies significantly influence market growth and product offerings, varying across regions. The report examines the impact of specific regulations in key markets.
- Competitive Product Substitutes: Alternative risk management tools, such as futures contracts and hedging strategies, compete with crop insurance. The report assesses their relative market impact and factors influencing choices by farmers.
- End-User Demographics: The report analyzes the demographic profile of farmers utilizing crop insurance, identifying factors influencing adoption rates such as farm size, technological proficiency, and access to financial resources.
- M&A Trends: Consolidation through M&A activities is reshaping the market landscape, driving efficiency and expanding service offerings. The report analyzes recent M&A trends and their implications for market competitiveness.
Crop Insurance Market Growth Trends & Insights
This section presents a comprehensive analysis of the Crop Insurance Market's growth trajectory, leveraging data and insights to project future market size. The report projects a Compound Annual Growth Rate (CAGR) of xx% during the forecast period (2025-2033), driven by factors such as increasing climate change risks, government support programs, and growing farmer awareness of risk mitigation strategies. Market penetration is currently estimated at xx%, with significant potential for growth, particularly in emerging economies. The analysis includes a detailed assessment of adoption rates across different regions and crop types. The evolving consumer behavior with respect to the shift from traditional insurance to technology-driven insurance solutions is also analyzed. Technological disruptions such as AI and machine learning are expected to play a role in the improved risk assessment and more customized insurance products.
Dominant Regions, Countries, or Segments in Crop Insurance Market
This section identifies the leading regions, countries, and segments within the Crop Insurance Market driving overall growth. The market is geographically diverse, with significant growth potential across both developed and developing nations.
By Coverage:
- Standing Crop Loss: This segment is projected to hold the largest market share due to the substantial economic impact of crop damage from various weather events and disease outbreaks.
- Multiple Peril Crop Insurance: This segment is experiencing significant growth due to its comprehensive coverage, protecting against a range of risks, making it attractive to farmers.
By Distribution Channel:
- Insurance Companies: This channel remains the dominant distribution channel given their established infrastructure and expertise.
By Type:
- Multiple Peril Crop Insurance: Dominates due to its comprehensive coverage.
The key drivers for dominance in these segments include supportive government policies, favorable economic conditions in certain regions, and increasing farmer awareness of the benefits of crop insurance. The report further details the growth potential within each segment, including regional variations and specific market dynamics.
Crop Insurance Market Product Landscape
Crop insurance products are evolving, incorporating technological advancements such as remote sensing, AI-driven risk assessment, and precision agriculture data integration. This is leading to the development of more accurate and customized insurance plans, offering improved risk mitigation for farmers. Unique selling propositions include tailored coverage options, simplified claim processes, and proactive risk management support, while technological advancements enhance risk assessment accuracy and efficiency.
Key Drivers, Barriers & Challenges in Crop Insurance Market
Key Drivers:
- Increasing Frequency and Severity of Climate Change related events: Extreme weather events and unpredictable climate patterns are driving demand for comprehensive crop insurance.
- Government Support and Subsidies: Government initiatives and subsidies are boosting affordability and adoption of crop insurance schemes, especially in developing countries.
- Technological Advancements: Innovations in remote sensing and data analytics are improving risk assessment and claim processing.
Key Challenges:
- Data Availability and Accuracy: Access to reliable and accurate data for risk assessment remains a challenge in many regions, limiting the effectiveness of some insurance products.
- High Administrative Costs: High administrative costs associated with claim processing and underwriting can impede widespread adoption, particularly for smallholder farmers.
- Complexity and Understanding: The complexity of crop insurance products can pose a barrier to adoption for farmers lacking financial literacy.
Emerging Opportunities in Crop Insurance Market
Emerging opportunities include expansion into underserved markets in developing countries, the development of parametric insurance products utilizing weather index data, and the integration of climate risk modeling into insurance product design. Furthermore, the integration of blockchain technology for enhanced security and transparency in the claims process represents a significant opportunity.
Growth Accelerators in the Crop Insurance Market Industry
Long-term growth will be accelerated by technological breakthroughs enabling more precise risk assessment, strategic partnerships between insurers and agricultural technology companies, and expansion into new geographic markets. Government initiatives promoting financial inclusion and digital literacy will further facilitate adoption.
Key Players Shaping the Crop Insurance Market Market
- Sompo International Holdings Ltd
- PICC
- Fairfax Financial Holdings Limited
- American Financial Group Inc
- QBE Insurance Group Limited
- ICICI Lombard General Insurance Company Limited
- Zurich
- Chubb
- Tokio Marine HCC
- Agriculture Insurance Company of India Limited (AIC)
Notable Milestones in Crop Insurance Market Sector
- September 2023: Launch of the Shrimp Crop Insurance scheme by the Agricultural Insurance Company of India, expanding coverage to aquaculture.
- July 2023: American Financial Group's acquisition of Crop Risk Services (CRS), strengthening its position in the US multi-peril crop insurance market.
In-Depth Crop Insurance Market Market Outlook
The future of the Crop Insurance Market is bright, driven by increasing climate risks, technological advancements, and supportive government policies. Strategic opportunities exist for companies to leverage technology, expand into new markets, and develop innovative product offerings catering to evolving farmer needs. This includes expansion into parametric insurance, leveraging big data for risk modeling, and offering comprehensive risk management solutions that extend beyond basic crop insurance.
Crop Insurance Market Segmentation
-
1. Type
- 1.1. Multiple Peril Crop Insurance
- 1.2. Actual Production History
- 1.3. Crop Revenue Coverage
-
2. Coverage
- 2.1. Localized Calamities
- 2.2. Sowing/Planting/Germination Risk
- 2.3. Standing Crop Loss
- 2.4. Post-harvest Losses
-
3. Distribution Channel
- 3.1. Banks
- 3.2. Insurance Companies
- 3.3. Brokers and Agents
- 3.4. Other Distribution Channels
Crop Insurance Market Segmentation By Geography
-
1. North America
- 1.1. United States
- 1.2. Canada
- 1.3. Mexico
-
2. South America
- 2.1. Brazil
- 2.2. Argentina
- 2.3. Rest of South America
-
3. Europe
- 3.1. United Kingdom
- 3.2. Germany
- 3.3. France
- 3.4. Italy
- 3.5. Spain
- 3.6. Russia
- 3.7. Benelux
- 3.8. Nordics
- 3.9. Rest of Europe
-
4. Middle East & Africa
- 4.1. Turkey
- 4.2. Israel
- 4.3. GCC
- 4.4. North Africa
- 4.5. South Africa
- 4.6. Rest of Middle East & Africa
-
5. Asia Pacific
- 5.1. China
- 5.2. India
- 5.3. Japan
- 5.4. South Korea
- 5.5. ASEAN
- 5.6. Oceania
- 5.7. Rest of Asia Pacific
Crop Insurance Market Regional Market Share
Geographic Coverage of Crop Insurance Market
Crop Insurance Market REPORT HIGHLIGHTS
| Aspects | Details |
|---|---|
| Study Period | 2020-2034 |
| Base Year | 2025 |
| Estimated Year | 2026 |
| Forecast Period | 2026-2034 |
| Historical Period | 2020-2025 |
| Growth Rate | CAGR of 5.77% from 2020-2034 |
| Segmentation |
|
Table of Contents
- 1. Introduction
- 1.1. Research Scope
- 1.2. Market Segmentation
- 1.3. Research Objective
- 1.4. Definitions and Assumptions
- 2. Executive Summary
- 2.1. Market Snapshot
- 3. Market Dynamics
- 3.1. Market Drivers
- 3.2. Market Restrains
- 3.3. Market Trends
- 3.4. Market Opportunities
- 4. Market Factor Analysis
- 4.1. Porters Five Forces
- 4.1.1. Bargaining Power of Suppliers
- 4.1.2. Bargaining Power of Buyers
- 4.1.3. Threat of New Entrants
- 4.1.4. Threat of Substitutes
- 4.1.5. Competitive Rivalry
- 4.2. PESTEL analysis
- 4.3. BCG Analysis
- 4.3.1. Stars (High Growth, High Market Share)
- 4.3.2. Cash Cows (Low Growth, High Market Share)
- 4.3.3. Question Mark (High Growth, Low Market Share)
- 4.3.4. Dogs (Low Growth, Low Market Share)
- 4.4. Ansoff Matrix Analysis
- 4.5. Supply Chain Analysis
- 4.6. Regulatory Landscape
- 4.7. Current Market Potential and Opportunity Assessment (TAM–SAM–SOM Framework)
- 4.8. IMR Analyst Note
- 4.1. Porters Five Forces
- 5. Market Analysis, Insights and Forecast 2021-2033
- 5.1. Market Analysis, Insights and Forecast - by Type
- 5.1.1. Multiple Peril Crop Insurance
- 5.1.2. Actual Production History
- 5.1.3. Crop Revenue Coverage
- 5.2. Market Analysis, Insights and Forecast - by Coverage
- 5.2.1. Localized Calamities
- 5.2.2. Sowing/Planting/Germination Risk
- 5.2.3. Standing Crop Loss
- 5.2.4. Post-harvest Losses
- 5.3. Market Analysis, Insights and Forecast - by Distribution Channel
- 5.3.1. Banks
- 5.3.2. Insurance Companies
- 5.3.3. Brokers and Agents
- 5.3.4. Other Distribution Channels
- 5.4. Market Analysis, Insights and Forecast - by Region
- 5.4.1. North America
- 5.4.2. South America
- 5.4.3. Europe
- 5.4.4. Middle East & Africa
- 5.4.5. Asia Pacific
- 5.1. Market Analysis, Insights and Forecast - by Type
- 6. Global Crop Insurance Market Analysis, Insights and Forecast, 2021-2033
- 6.1. Market Analysis, Insights and Forecast - by Type
- 6.1.1. Multiple Peril Crop Insurance
- 6.1.2. Actual Production History
- 6.1.3. Crop Revenue Coverage
- 6.2. Market Analysis, Insights and Forecast - by Coverage
- 6.2.1. Localized Calamities
- 6.2.2. Sowing/Planting/Germination Risk
- 6.2.3. Standing Crop Loss
- 6.2.4. Post-harvest Losses
- 6.3. Market Analysis, Insights and Forecast - by Distribution Channel
- 6.3.1. Banks
- 6.3.2. Insurance Companies
- 6.3.3. Brokers and Agents
- 6.3.4. Other Distribution Channels
- 6.1. Market Analysis, Insights and Forecast - by Type
- 7. North America Crop Insurance Market Analysis, Insights and Forecast, 2020-2032
- 7.1. Market Analysis, Insights and Forecast - by Type
- 7.1.1. Multiple Peril Crop Insurance
- 7.1.2. Actual Production History
- 7.1.3. Crop Revenue Coverage
- 7.2. Market Analysis, Insights and Forecast - by Coverage
- 7.2.1. Localized Calamities
- 7.2.2. Sowing/Planting/Germination Risk
- 7.2.3. Standing Crop Loss
- 7.2.4. Post-harvest Losses
- 7.3. Market Analysis, Insights and Forecast - by Distribution Channel
- 7.3.1. Banks
- 7.3.2. Insurance Companies
- 7.3.3. Brokers and Agents
- 7.3.4. Other Distribution Channels
- 7.1. Market Analysis, Insights and Forecast - by Type
- 8. South America Crop Insurance Market Analysis, Insights and Forecast, 2020-2032
- 8.1. Market Analysis, Insights and Forecast - by Type
- 8.1.1. Multiple Peril Crop Insurance
- 8.1.2. Actual Production History
- 8.1.3. Crop Revenue Coverage
- 8.2. Market Analysis, Insights and Forecast - by Coverage
- 8.2.1. Localized Calamities
- 8.2.2. Sowing/Planting/Germination Risk
- 8.2.3. Standing Crop Loss
- 8.2.4. Post-harvest Losses
- 8.3. Market Analysis, Insights and Forecast - by Distribution Channel
- 8.3.1. Banks
- 8.3.2. Insurance Companies
- 8.3.3. Brokers and Agents
- 8.3.4. Other Distribution Channels
- 8.1. Market Analysis, Insights and Forecast - by Type
- 9. Europe Crop Insurance Market Analysis, Insights and Forecast, 2020-2032
- 9.1. Market Analysis, Insights and Forecast - by Type
- 9.1.1. Multiple Peril Crop Insurance
- 9.1.2. Actual Production History
- 9.1.3. Crop Revenue Coverage
- 9.2. Market Analysis, Insights and Forecast - by Coverage
- 9.2.1. Localized Calamities
- 9.2.2. Sowing/Planting/Germination Risk
- 9.2.3. Standing Crop Loss
- 9.2.4. Post-harvest Losses
- 9.3. Market Analysis, Insights and Forecast - by Distribution Channel
- 9.3.1. Banks
- 9.3.2. Insurance Companies
- 9.3.3. Brokers and Agents
- 9.3.4. Other Distribution Channels
- 9.1. Market Analysis, Insights and Forecast - by Type
- 10. Middle East & Africa Crop Insurance Market Analysis, Insights and Forecast, 2020-2032
- 10.1. Market Analysis, Insights and Forecast - by Type
- 10.1.1. Multiple Peril Crop Insurance
- 10.1.2. Actual Production History
- 10.1.3. Crop Revenue Coverage
- 10.2. Market Analysis, Insights and Forecast - by Coverage
- 10.2.1. Localized Calamities
- 10.2.2. Sowing/Planting/Germination Risk
- 10.2.3. Standing Crop Loss
- 10.2.4. Post-harvest Losses
- 10.3. Market Analysis, Insights and Forecast - by Distribution Channel
- 10.3.1. Banks
- 10.3.2. Insurance Companies
- 10.3.3. Brokers and Agents
- 10.3.4. Other Distribution Channels
- 10.1. Market Analysis, Insights and Forecast - by Type
- 11. Asia Pacific Crop Insurance Market Analysis, Insights and Forecast, 2020-2032
- 11.1. Market Analysis, Insights and Forecast - by Type
- 11.1.1. Multiple Peril Crop Insurance
- 11.1.2. Actual Production History
- 11.1.3. Crop Revenue Coverage
- 11.2. Market Analysis, Insights and Forecast - by Coverage
- 11.2.1. Localized Calamities
- 11.2.2. Sowing/Planting/Germination Risk
- 11.2.3. Standing Crop Loss
- 11.2.4. Post-harvest Losses
- 11.3. Market Analysis, Insights and Forecast - by Distribution Channel
- 11.3.1. Banks
- 11.3.2. Insurance Companies
- 11.3.3. Brokers and Agents
- 11.3.4. Other Distribution Channels
- 11.1. Market Analysis, Insights and Forecast - by Type
- 12. Competitive Analysis
- 12.1. Company Profiles
- 12.1.1 Sompo International Holdings Ltd
- 12.1.1.1. Company Overview
- 12.1.1.2. Products
- 12.1.1.3. Company Financials
- 12.1.1.4. SWOT Analysis
- 12.1.2 PICC
- 12.1.2.1. Company Overview
- 12.1.2.2. Products
- 12.1.2.3. Company Financials
- 12.1.2.4. SWOT Analysis
- 12.1.3 Fairfax Financial Holdings Limited
- 12.1.3.1. Company Overview
- 12.1.3.2. Products
- 12.1.3.3. Company Financials
- 12.1.3.4. SWOT Analysis
- 12.1.4 American Financial Group Inc
- 12.1.4.1. Company Overview
- 12.1.4.2. Products
- 12.1.4.3. Company Financials
- 12.1.4.4. SWOT Analysis
- 12.1.5 QBE Insurance Group Limited
- 12.1.5.1. Company Overview
- 12.1.5.2. Products
- 12.1.5.3. Company Financials
- 12.1.5.4. SWOT Analysis
- 12.1.6 ICICI Lombard General Insurance Company Limited
- 12.1.6.1. Company Overview
- 12.1.6.2. Products
- 12.1.6.3. Company Financials
- 12.1.6.4. SWOT Analysis
- 12.1.7 Zurich**List Not Exhaustive
- 12.1.7.1. Company Overview
- 12.1.7.2. Products
- 12.1.7.3. Company Financials
- 12.1.7.4. SWOT Analysis
- 12.1.8 Chubb
- 12.1.8.1. Company Overview
- 12.1.8.2. Products
- 12.1.8.3. Company Financials
- 12.1.8.4. SWOT Analysis
- 12.1.9 Tokio Marine HCC
- 12.1.9.1. Company Overview
- 12.1.9.2. Products
- 12.1.9.3. Company Financials
- 12.1.9.4. SWOT Analysis
- 12.1.10 Agriculture Insurance Company of India Limited (AIC)
- 12.1.10.1. Company Overview
- 12.1.10.2. Products
- 12.1.10.3. Company Financials
- 12.1.10.4. SWOT Analysis
- 12.1.1 Sompo International Holdings Ltd
- 12.2. Market Entropy
- 12.2.1 Company's Key Areas Served
- 12.2.2 Recent Developments
- 12.3. Company Market Share Analysis 2025
- 12.3.1 Top 5 Companies Market Share Analysis
- 12.3.2 Top 3 Companies Market Share Analysis
- 12.4. List of Potential Customers
- 13. Research Methodology
List of Figures
- Figure 1: Global Crop Insurance Market Revenue Breakdown (Million, %) by Region 2025 & 2033
- Figure 2: North America Crop Insurance Market Revenue (Million), by Type 2025 & 2033
- Figure 3: North America Crop Insurance Market Revenue Share (%), by Type 2025 & 2033
- Figure 4: North America Crop Insurance Market Revenue (Million), by Coverage 2025 & 2033
- Figure 5: North America Crop Insurance Market Revenue Share (%), by Coverage 2025 & 2033
- Figure 6: North America Crop Insurance Market Revenue (Million), by Distribution Channel 2025 & 2033
- Figure 7: North America Crop Insurance Market Revenue Share (%), by Distribution Channel 2025 & 2033
- Figure 8: North America Crop Insurance Market Revenue (Million), by Country 2025 & 2033
- Figure 9: North America Crop Insurance Market Revenue Share (%), by Country 2025 & 2033
- Figure 10: South America Crop Insurance Market Revenue (Million), by Type 2025 & 2033
- Figure 11: South America Crop Insurance Market Revenue Share (%), by Type 2025 & 2033
- Figure 12: South America Crop Insurance Market Revenue (Million), by Coverage 2025 & 2033
- Figure 13: South America Crop Insurance Market Revenue Share (%), by Coverage 2025 & 2033
- Figure 14: South America Crop Insurance Market Revenue (Million), by Distribution Channel 2025 & 2033
- Figure 15: South America Crop Insurance Market Revenue Share (%), by Distribution Channel 2025 & 2033
- Figure 16: South America Crop Insurance Market Revenue (Million), by Country 2025 & 2033
- Figure 17: South America Crop Insurance Market Revenue Share (%), by Country 2025 & 2033
- Figure 18: Europe Crop Insurance Market Revenue (Million), by Type 2025 & 2033
- Figure 19: Europe Crop Insurance Market Revenue Share (%), by Type 2025 & 2033
- Figure 20: Europe Crop Insurance Market Revenue (Million), by Coverage 2025 & 2033
- Figure 21: Europe Crop Insurance Market Revenue Share (%), by Coverage 2025 & 2033
- Figure 22: Europe Crop Insurance Market Revenue (Million), by Distribution Channel 2025 & 2033
- Figure 23: Europe Crop Insurance Market Revenue Share (%), by Distribution Channel 2025 & 2033
- Figure 24: Europe Crop Insurance Market Revenue (Million), by Country 2025 & 2033
- Figure 25: Europe Crop Insurance Market Revenue Share (%), by Country 2025 & 2033
- Figure 26: Middle East & Africa Crop Insurance Market Revenue (Million), by Type 2025 & 2033
- Figure 27: Middle East & Africa Crop Insurance Market Revenue Share (%), by Type 2025 & 2033
- Figure 28: Middle East & Africa Crop Insurance Market Revenue (Million), by Coverage 2025 & 2033
- Figure 29: Middle East & Africa Crop Insurance Market Revenue Share (%), by Coverage 2025 & 2033
- Figure 30: Middle East & Africa Crop Insurance Market Revenue (Million), by Distribution Channel 2025 & 2033
- Figure 31: Middle East & Africa Crop Insurance Market Revenue Share (%), by Distribution Channel 2025 & 2033
- Figure 32: Middle East & Africa Crop Insurance Market Revenue (Million), by Country 2025 & 2033
- Figure 33: Middle East & Africa Crop Insurance Market Revenue Share (%), by Country 2025 & 2033
- Figure 34: Asia Pacific Crop Insurance Market Revenue (Million), by Type 2025 & 2033
- Figure 35: Asia Pacific Crop Insurance Market Revenue Share (%), by Type 2025 & 2033
- Figure 36: Asia Pacific Crop Insurance Market Revenue (Million), by Coverage 2025 & 2033
- Figure 37: Asia Pacific Crop Insurance Market Revenue Share (%), by Coverage 2025 & 2033
- Figure 38: Asia Pacific Crop Insurance Market Revenue (Million), by Distribution Channel 2025 & 2033
- Figure 39: Asia Pacific Crop Insurance Market Revenue Share (%), by Distribution Channel 2025 & 2033
- Figure 40: Asia Pacific Crop Insurance Market Revenue (Million), by Country 2025 & 2033
- Figure 41: Asia Pacific Crop Insurance Market Revenue Share (%), by Country 2025 & 2033
List of Tables
- Table 1: Global Crop Insurance Market Revenue Million Forecast, by Type 2020 & 2033
- Table 2: Global Crop Insurance Market Revenue Million Forecast, by Coverage 2020 & 2033
- Table 3: Global Crop Insurance Market Revenue Million Forecast, by Distribution Channel 2020 & 2033
- Table 4: Global Crop Insurance Market Revenue Million Forecast, by Region 2020 & 2033
- Table 5: Global Crop Insurance Market Revenue Million Forecast, by Type 2020 & 2033
- Table 6: Global Crop Insurance Market Revenue Million Forecast, by Coverage 2020 & 2033
- Table 7: Global Crop Insurance Market Revenue Million Forecast, by Distribution Channel 2020 & 2033
- Table 8: Global Crop Insurance Market Revenue Million Forecast, by Country 2020 & 2033
- Table 9: United States Crop Insurance Market Revenue (Million) Forecast, by Application 2020 & 2033
- Table 10: Canada Crop Insurance Market Revenue (Million) Forecast, by Application 2020 & 2033
- Table 11: Mexico Crop Insurance Market Revenue (Million) Forecast, by Application 2020 & 2033
- Table 12: Global Crop Insurance Market Revenue Million Forecast, by Type 2020 & 2033
- Table 13: Global Crop Insurance Market Revenue Million Forecast, by Coverage 2020 & 2033
- Table 14: Global Crop Insurance Market Revenue Million Forecast, by Distribution Channel 2020 & 2033
- Table 15: Global Crop Insurance Market Revenue Million Forecast, by Country 2020 & 2033
- Table 16: Brazil Crop Insurance Market Revenue (Million) Forecast, by Application 2020 & 2033
- Table 17: Argentina Crop Insurance Market Revenue (Million) Forecast, by Application 2020 & 2033
- Table 18: Rest of South America Crop Insurance Market Revenue (Million) Forecast, by Application 2020 & 2033
- Table 19: Global Crop Insurance Market Revenue Million Forecast, by Type 2020 & 2033
- Table 20: Global Crop Insurance Market Revenue Million Forecast, by Coverage 2020 & 2033
- Table 21: Global Crop Insurance Market Revenue Million Forecast, by Distribution Channel 2020 & 2033
- Table 22: Global Crop Insurance Market Revenue Million Forecast, by Country 2020 & 2033
- Table 23: United Kingdom Crop Insurance Market Revenue (Million) Forecast, by Application 2020 & 2033
- Table 24: Germany Crop Insurance Market Revenue (Million) Forecast, by Application 2020 & 2033
- Table 25: France Crop Insurance Market Revenue (Million) Forecast, by Application 2020 & 2033
- Table 26: Italy Crop Insurance Market Revenue (Million) Forecast, by Application 2020 & 2033
- Table 27: Spain Crop Insurance Market Revenue (Million) Forecast, by Application 2020 & 2033
- Table 28: Russia Crop Insurance Market Revenue (Million) Forecast, by Application 2020 & 2033
- Table 29: Benelux Crop Insurance Market Revenue (Million) Forecast, by Application 2020 & 2033
- Table 30: Nordics Crop Insurance Market Revenue (Million) Forecast, by Application 2020 & 2033
- Table 31: Rest of Europe Crop Insurance Market Revenue (Million) Forecast, by Application 2020 & 2033
- Table 32: Global Crop Insurance Market Revenue Million Forecast, by Type 2020 & 2033
- Table 33: Global Crop Insurance Market Revenue Million Forecast, by Coverage 2020 & 2033
- Table 34: Global Crop Insurance Market Revenue Million Forecast, by Distribution Channel 2020 & 2033
- Table 35: Global Crop Insurance Market Revenue Million Forecast, by Country 2020 & 2033
- Table 36: Turkey Crop Insurance Market Revenue (Million) Forecast, by Application 2020 & 2033
- Table 37: Israel Crop Insurance Market Revenue (Million) Forecast, by Application 2020 & 2033
- Table 38: GCC Crop Insurance Market Revenue (Million) Forecast, by Application 2020 & 2033
- Table 39: North Africa Crop Insurance Market Revenue (Million) Forecast, by Application 2020 & 2033
- Table 40: South Africa Crop Insurance Market Revenue (Million) Forecast, by Application 2020 & 2033
- Table 41: Rest of Middle East & Africa Crop Insurance Market Revenue (Million) Forecast, by Application 2020 & 2033
- Table 42: Global Crop Insurance Market Revenue Million Forecast, by Type 2020 & 2033
- Table 43: Global Crop Insurance Market Revenue Million Forecast, by Coverage 2020 & 2033
- Table 44: Global Crop Insurance Market Revenue Million Forecast, by Distribution Channel 2020 & 2033
- Table 45: Global Crop Insurance Market Revenue Million Forecast, by Country 2020 & 2033
- Table 46: China Crop Insurance Market Revenue (Million) Forecast, by Application 2020 & 2033
- Table 47: India Crop Insurance Market Revenue (Million) Forecast, by Application 2020 & 2033
- Table 48: Japan Crop Insurance Market Revenue (Million) Forecast, by Application 2020 & 2033
- Table 49: South Korea Crop Insurance Market Revenue (Million) Forecast, by Application 2020 & 2033
- Table 50: ASEAN Crop Insurance Market Revenue (Million) Forecast, by Application 2020 & 2033
- Table 51: Oceania Crop Insurance Market Revenue (Million) Forecast, by Application 2020 & 2033
- Table 52: Rest of Asia Pacific Crop Insurance Market Revenue (Million) Forecast, by Application 2020 & 2033
Frequently Asked Questions
1. What is the projected Compound Annual Growth Rate (CAGR) of the Crop Insurance Market ?
The projected CAGR is approximately 5.77%.
2. Which companies are prominent players in the Crop Insurance Market ?
Key companies in the market include Sompo International Holdings Ltd, PICC, Fairfax Financial Holdings Limited, American Financial Group Inc, QBE Insurance Group Limited, ICICI Lombard General Insurance Company Limited, Zurich**List Not Exhaustive, Chubb, Tokio Marine HCC, Agriculture Insurance Company of India Limited (AIC).
3. What are the main segments of the Crop Insurance Market ?
The market segments include Type, Coverage, Distribution Channel.
4. Can you provide details about the market size?
The market size is estimated to be USD 38.10 Million as of 2022.
5. What are some drivers contributing to market growth?
Government Support. Including Subsidies and Initiatives. is a Significant Driver.
6. What are the notable trends driving market growth?
Increasing Value Crop Protection Globally.
7. Are there any restraints impacting market growth?
Instances of Fraud or Misreporting can Impact the Integrity of the Crop Insurance System.
8. Can you provide examples of recent developments in the market?
September 2023: The Shrimp Crop Insurance scheme developed by the Agricultural Insurance Company was launched in India. The insurance cover starts from the initial stage to 130 days till the shrimps are ready.
9. What pricing options are available for accessing the report?
Pricing options include single-user, multi-user, and enterprise licenses priced at USD 3800, USD 4500, and USD 5800 respectively.
10. Is the market size provided in terms of value or volume?
The market size is provided in terms of value, measured in Million.
11. Are there any specific market keywords associated with the report?
Yes, the market keyword associated with the report is "Crop Insurance Market ," which aids in identifying and referencing the specific market segment covered.
12. How do I determine which pricing option suits my needs best?
The pricing options vary based on user requirements and access needs. Individual users may opt for single-user licenses, while businesses requiring broader access may choose multi-user or enterprise licenses for cost-effective access to the report.
13. Are there any additional resources or data provided in the Crop Insurance Market report?
While the report offers comprehensive insights, it's advisable to review the specific contents or supplementary materials provided to ascertain if additional resources or data are available.
14. How can I stay updated on further developments or reports in the Crop Insurance Market ?
To stay informed about further developments, trends, and reports in the Crop Insurance Market , consider subscribing to industry newsletters, following relevant companies and organizations, or regularly checking reputable industry news sources and publications.
Methodology
Step 1 - Identification of Relevant Samples Size from Population Database


Step 2 - Approaches for Defining Global Market Size (Value, Volume* & Price*)

Note*: In applicable scenarios
Step 3 - Data Sources
Primary Research
- Web Analytics
- Survey Reports
- Research Institute
- Latest Research Reports
- Opinion Leaders
Secondary Research
- Annual Reports
- White Paper
- Latest Press Release
- Industry Association
- Paid Database
- Investor Presentations

Step 4 - Data Triangulation
Involves using different sources of information in order to increase the validity of a study
These sources are likely to be stakeholders in a program - participants, other researchers, program staff, other community members, and so on.
Then we put all data in single framework & apply various statistical tools to find out the dynamic on the market.
During the analysis stage, feedback from the stakeholder groups would be compared to determine areas of agreement as well as areas of divergence