

Key Insights
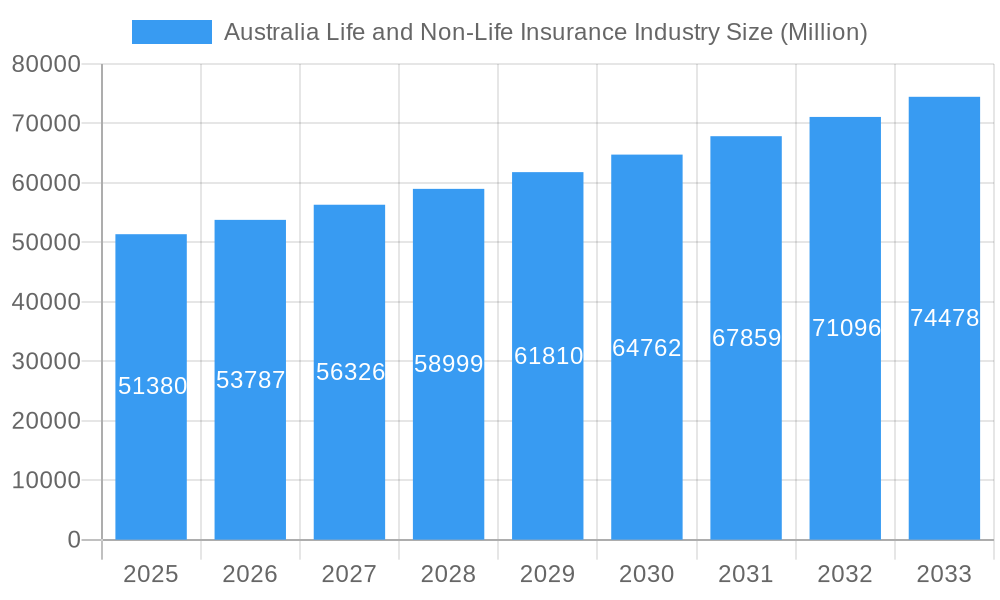
The Australian life and non-life insurance market, valued at $51.38 billion in 2025, is projected to experience steady growth, exhibiting a compound annual growth rate (CAGR) of 4.56% from 2025 to 2033. This growth is fueled by several key drivers. Rising health consciousness among Australians is boosting demand for health insurance products. The aging population, with its increasing healthcare needs, further fuels this demand. Furthermore, government regulations promoting financial security and increased awareness of the importance of insurance are driving market expansion. Competitive pressures among established players like Insurance Australia Group Limited, Suncorp Group, and AIA Group Limited, alongside the emergence of innovative Insurtech companies, contribute to market dynamism and product diversification. However, challenges remain. Economic downturns can impact consumer spending on non-essential insurance products. Strict regulatory compliance requirements and the ongoing need to manage risk effectively pose ongoing challenges for insurers. The market is segmented by product type (life, health, motor, home, etc.) and distribution channels (online, brokers, direct sales), creating diverse opportunities for various players to thrive within their respective niches.
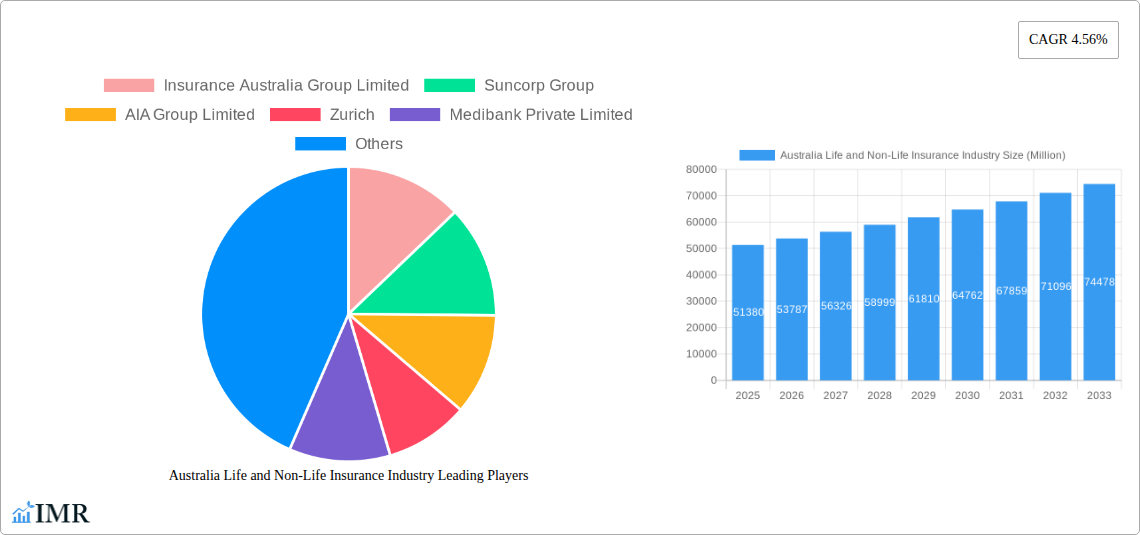
Australia Life and Non-Life Insurance Industry Market Size (In Billion)
The forecast period of 2025-2033 anticipates continued growth, driven by factors such as increasing disposable incomes and a growing preference for comprehensive insurance packages offering bundled services. While the market shows resilience, the industry needs to adapt to evolving consumer expectations and technological advancements. This includes embracing digitalization, personalized offerings, and improved customer service to maintain competitiveness and drive further expansion. The continued focus on risk management and responsible pricing will be crucial for sustained growth and profitability in the face of potential economic headwinds. Data suggests a projected market value exceeding $75 Billion by 2033 given the current CAGR and market drivers.
Australia Life and Non-Life Insurance Industry Company Market Share
Australia Life and Non-Life Insurance Industry Market Report: 2019-2033
This comprehensive report provides an in-depth analysis of the Australian life and non-life insurance industry, offering valuable insights for industry professionals, investors, and strategic decision-makers. Covering the period 2019-2033, with a base year of 2025 and a forecast period of 2025-2033, this report meticulously examines market dynamics, growth trends, key players, and emerging opportunities. It delves into both the parent market (Insurance) and its child markets (Life Insurance, Non-Life Insurance, Health Insurance etc.) providing granular data and insightful analysis to help navigate the complexities of this dynamic sector. The report includes detailed analysis of key players like Insurance Australia Group Limited, Suncorp Group, AIA Group Limited, and more. Expect detailed financial projections (in millions of Australian dollars) throughout.
Australia Life and Non-Life Insurance Industry Market Dynamics & Structure
This section analyzes the competitive landscape, technological advancements, regulatory environment, and market trends within the Australian life and non-life insurance industry. We examine market concentration, identifying the leading players and their market share percentages (xx%). The impact of technological innovation, particularly in areas such as IoT and AI, is explored alongside the regulatory frameworks shaping industry practices. We also examine the influence of competitive product substitutes, evolving end-user demographics and the significant impact of mergers and acquisitions (M&A) activities, detailing the volume of deals in the historical period (2019-2024) and forecasting future activity (xx deals in 2025-2033).
- Market Concentration: High concentration with top 5 players holding xx% market share (2024).
- Technological Innovation: Strong adoption of digital technologies, including AI and IoT, driving efficiency and new product offerings. Significant barriers to entry for new technologies due to regulatory complexities and legacy systems.
- Regulatory Frameworks: Stringent regulatory oversight by APRA (Australian Prudential Regulation Authority) influencing pricing and product development.
- Competitive Product Substitutes: Increased competition from fintech companies offering alternative insurance solutions.
- End-User Demographics: Aging population driving demand for life insurance and health insurance. Shifting consumer preferences towards online and digital channels.
- M&A Trends: Increased M&A activity driven by consolidation and expansion strategies. xx M&A deals recorded in the historical period (2019-2024) leading to xx% of total market share changing hands.
Australia Life and Non-Life Insurance Industry Growth Trends & Insights
This section leverages extensive market research data to provide a comprehensive analysis of market size evolution, adoption rates, technological disruptions, and consumer behavior shifts within the Australian life and non-life insurance sector. We examine the historical market size, tracing its growth from 2019 to 2024 (xx Million in 2024). Key metrics like Compound Annual Growth Rate (CAGR) for the historical period (xx%) and projected CAGR for the forecast period (2025-2033) (xx%) are presented along with insights on market penetration rates (xx% in 2024). The disruptive influence of technological advancements is detailed, alongside analysis of evolving consumer preferences and their implications for the industry.
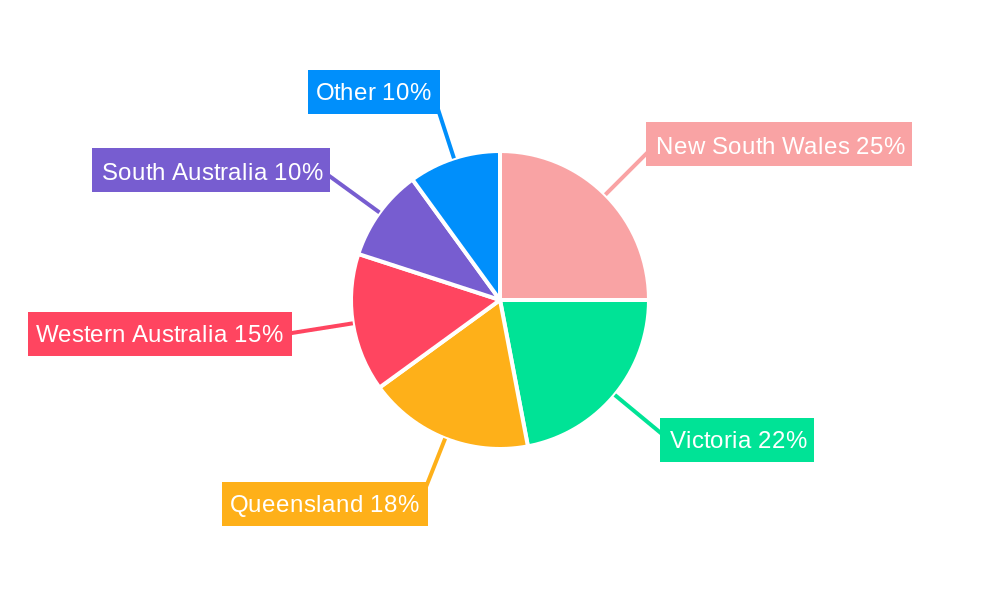
Dominant Regions, Countries, or Segments in Australia Life and Non-Life Insurance Industry
This section pinpoints the leading regions and segments driving market growth within the Australian life and non-life insurance industry. A detailed analysis of market share and growth potential is provided. Key factors contributing to regional dominance are explored including economic policies, infrastructure development, and population demographics. For example, the strong economic performance of the major cities (Sydney, Melbourne, Brisbane) is a key driver of growth in both life and non-life segments.
- Key Drivers: Strong economic growth in major metropolitan areas, government initiatives promoting financial inclusion, and rising disposable incomes.
- Dominance Factors: High population density in urban areas, well-developed financial infrastructure, and a high level of financial literacy.
Australia Life and Non-Life Insurance Industry Product Landscape
This section details the evolving product landscape of the Australian life and non-life insurance sector, highlighting product innovations, applications, and key performance metrics. We analyze the unique selling propositions of various products and examine the influence of technological advancements such as AI-powered risk assessment and personalized pricing models. The increasing adoption of digital distribution channels and the rise of Insurtech companies are analyzed.
Key Drivers, Barriers & Challenges in Australia Life and Non-Life Insurance Industry
This section outlines the key factors driving market growth, including technological advancements (e.g., AI-driven risk assessment, IoT-enabled risk management), favorable economic conditions, and supportive government policies. Conversely, it examines the challenges and restraints impacting industry progress, focusing on supply chain disruptions, regulatory hurdles, and intense competition. The quantitative impact of these challenges is estimated, such as the xx% increase in claims cost due to climate change related events.
- Key Drivers: Technological advancements, economic growth, and regulatory support.
- Key Challenges: Intense competition, regulatory changes, increasing claims costs, and cyber security threats.
Emerging Opportunities in Australia Life and Non-Life Insurance Industry
This section identifies emerging trends and opportunities within the Australian life and non-life insurance industry. Focus is given to untapped market segments, innovative product applications, and shifting consumer preferences. The rise of Insurtech is a key focus. We examine the potential of new technologies to improve customer experience, reduce costs and drive innovation. The growing demand for tailored insurance products and the increasing importance of sustainability are also highlighted.
Growth Accelerators in the Australia Life and Non-Life Insurance Industry Industry
This section analyzes the key catalysts propelling long-term growth within the Australian life and non-life insurance industry. Emphasis is placed on technological breakthroughs such as AI and big data analytics, strategic partnerships, and successful market expansion strategies by key players. The impact of these factors on market expansion and profitability is examined.
Key Players Shaping the Australia Life and Non-Life Insurance Industry Market
- Insurance Australia Group Limited
- Suncorp Group
- AIA Group Limited
- Zurich
- Medibank Private Limited
- Genworth Mortgage Insurance Australia Limited
- ClearView Wealth Limited
- Cover-More Limited
- AMP Limited
- NIB Holdings Limited
- (List Not Exhaustive)
Notable Milestones in Australia Life and Non-Life Insurance Industry Sector
- February 2023: Insurance Australia Group Limited (IAG) invested in Myriota, a satellite IoT company, to explore risk management applications.
- September 2022: Launch of io.Insure, the world's first online marketplace for M&A insurance for SMEs.
In-Depth Australia Life and Non-Life Insurance Industry Market Outlook
This section summarizes the key growth accelerators and provides an outlook on the future market potential and strategic opportunities within the Australian life and non-life insurance industry. The long-term outlook is positive, driven by continued technological advancements, favorable demographics, and increasing consumer demand for insurance products. The report concludes with recommendations for businesses to capitalize on these opportunities and navigate the challenges of this dynamic sector.
Australia Life and Non-Life Insurance Industry Segmentation
-
1. Insurance Type
-
1.1. Life insurance
- 1.1.1. Individual
- 1.1.2. Group
-
1.2. Non-Life Insurance
- 1.2.1. Fire
- 1.2.2. Motor
- 1.2.3. Marine
- 1.2.4. Health
- 1.2.5. Other Non-Life Insurance
-
1.1. Life insurance
-
2. Distribution Channel
- 2.1. Direct
- 2.2. Brokers
- 2.3. Banks
- 2.4. Other Distribution Channels
Australia Life and Non-Life Insurance Industry Segmentation By Geography
- 1. Australia
Australia Life and Non-Life Insurance Industry Regional Market Share
Geographic Coverage of Australia Life and Non-Life Insurance Industry
Australia Life and Non-Life Insurance Industry REPORT HIGHLIGHTS
| Aspects | Details |
|---|---|
| Study Period | 2020-2034 |
| Base Year | 2025 |
| Estimated Year | 2026 |
| Forecast Period | 2026-2034 |
| Historical Period | 2020-2025 |
| Growth Rate | CAGR of 4.56% from 2020-2034 |
| Segmentation |
|
Table of Contents
- 1. Introduction
- 1.1. Research Scope
- 1.2. Market Segmentation
- 1.3. Research Objective
- 1.4. Definitions and Assumptions
- 2. Executive Summary
- 2.1. Market Snapshot
- 3. Market Dynamics
- 3.1. Market Drivers
- 3.2. Market Restrains
- 3.3. Market Trends
- 3.4. Market Opportunities
- 4. Market Factor Analysis
- 4.1. Porters Five Forces
- 4.1.1. Bargaining Power of Suppliers
- 4.1.2. Bargaining Power of Buyers
- 4.1.3. Threat of New Entrants
- 4.1.4. Threat of Substitutes
- 4.1.5. Competitive Rivalry
- 4.2. PESTEL analysis
- 4.3. BCG Analysis
- 4.3.1. Stars (High Growth, High Market Share)
- 4.3.2. Cash Cows (Low Growth, High Market Share)
- 4.3.3. Question Mark (High Growth, Low Market Share)
- 4.3.4. Dogs (Low Growth, Low Market Share)
- 4.4. Ansoff Matrix Analysis
- 4.5. Supply Chain Analysis
- 4.6. Regulatory Landscape
- 4.7. Current Market Potential and Opportunity Assessment (TAM–SAM–SOM Framework)
- 4.8. IMR Analyst Note
- 4.1. Porters Five Forces
- 5. Market Analysis, Insights and Forecast 2021-2033
- 5.1. Market Analysis, Insights and Forecast - by Insurance Type
- 5.1.1. Life insurance
- 5.1.1.1. Individual
- 5.1.1.2. Group
- 5.1.2. Non-Life Insurance
- 5.1.2.1. Fire
- 5.1.2.2. Motor
- 5.1.2.3. Marine
- 5.1.2.4. Health
- 5.1.2.5. Other Non-Life Insurance
- 5.1.1. Life insurance
- 5.2. Market Analysis, Insights and Forecast - by Distribution Channel
- 5.2.1. Direct
- 5.2.2. Brokers
- 5.2.3. Banks
- 5.2.4. Other Distribution Channels
- 5.3. Market Analysis, Insights and Forecast - by Region
- 5.3.1. Australia
- 5.1. Market Analysis, Insights and Forecast - by Insurance Type
- 6. Australia Life and Non-Life Insurance Industry Analysis, Insights and Forecast, 2021-2033
- 6.1. Market Analysis, Insights and Forecast - by Insurance Type
- 6.1.1. Life insurance
- 6.1.1.1. Individual
- 6.1.1.2. Group
- 6.1.2. Non-Life Insurance
- 6.1.2.1. Fire
- 6.1.2.2. Motor
- 6.1.2.3. Marine
- 6.1.2.4. Health
- 6.1.2.5. Other Non-Life Insurance
- 6.1.1. Life insurance
- 6.2. Market Analysis, Insights and Forecast - by Distribution Channel
- 6.2.1. Direct
- 6.2.2. Brokers
- 6.2.3. Banks
- 6.2.4. Other Distribution Channels
- 6.1. Market Analysis, Insights and Forecast - by Insurance Type
- 7. Competitive Analysis
- 7.1. Company Profiles
- 7.1.1 Insurance Australia Group Limited
- 7.1.1.1. Company Overview
- 7.1.1.2. Products
- 7.1.1.3. Company Financials
- 7.1.1.4. SWOT Analysis
- 7.1.2 Suncorp Group
- 7.1.2.1. Company Overview
- 7.1.2.2. Products
- 7.1.2.3. Company Financials
- 7.1.2.4. SWOT Analysis
- 7.1.3 AIA Group Limited
- 7.1.3.1. Company Overview
- 7.1.3.2. Products
- 7.1.3.3. Company Financials
- 7.1.3.4. SWOT Analysis
- 7.1.4 Zurich
- 7.1.4.1. Company Overview
- 7.1.4.2. Products
- 7.1.4.3. Company Financials
- 7.1.4.4. SWOT Analysis
- 7.1.5 Medibank Private Limited
- 7.1.5.1. Company Overview
- 7.1.5.2. Products
- 7.1.5.3. Company Financials
- 7.1.5.4. SWOT Analysis
- 7.1.6 Genworth Mortgage Insurance Australia Limited
- 7.1.6.1. Company Overview
- 7.1.6.2. Products
- 7.1.6.3. Company Financials
- 7.1.6.4. SWOT Analysis
- 7.1.7 ClearView Wealth Limited
- 7.1.7.1. Company Overview
- 7.1.7.2. Products
- 7.1.7.3. Company Financials
- 7.1.7.4. SWOT Analysis
- 7.1.8 Cover-More Limited
- 7.1.8.1. Company Overview
- 7.1.8.2. Products
- 7.1.8.3. Company Financials
- 7.1.8.4. SWOT Analysis
- 7.1.9 AMP Limited
- 7.1.9.1. Company Overview
- 7.1.9.2. Products
- 7.1.9.3. Company Financials
- 7.1.9.4. SWOT Analysis
- 7.1.10 NIB Holdings Limited**List Not Exhaustive
- 7.1.10.1. Company Overview
- 7.1.10.2. Products
- 7.1.10.3. Company Financials
- 7.1.10.4. SWOT Analysis
- 7.1.1 Insurance Australia Group Limited
- 7.2. Market Entropy
- 7.2.1 Company's Key Areas Served
- 7.2.2 Recent Developments
- 7.3. Company Market Share Analysis 2025
- 7.3.1 Top 5 Companies Market Share Analysis
- 7.3.2 Top 3 Companies Market Share Analysis
- 7.4. List of Potential Customers
- 8. Research Methodology
List of Figures
- Figure 1: Australia Life and Non-Life Insurance Industry Revenue Breakdown (Million, %) by Product 2025 & 2033
- Figure 2: Australia Life and Non-Life Insurance Industry Share (%) by Company 2025
List of Tables
- Table 1: Australia Life and Non-Life Insurance Industry Revenue Million Forecast, by Insurance Type 2020 & 2033
- Table 2: Australia Life and Non-Life Insurance Industry Volume Billion Forecast, by Insurance Type 2020 & 2033
- Table 3: Australia Life and Non-Life Insurance Industry Revenue Million Forecast, by Distribution Channel 2020 & 2033
- Table 4: Australia Life and Non-Life Insurance Industry Volume Billion Forecast, by Distribution Channel 2020 & 2033
- Table 5: Australia Life and Non-Life Insurance Industry Revenue Million Forecast, by Region 2020 & 2033
- Table 6: Australia Life and Non-Life Insurance Industry Volume Billion Forecast, by Region 2020 & 2033
- Table 7: Australia Life and Non-Life Insurance Industry Revenue Million Forecast, by Insurance Type 2020 & 2033
- Table 8: Australia Life and Non-Life Insurance Industry Volume Billion Forecast, by Insurance Type 2020 & 2033
- Table 9: Australia Life and Non-Life Insurance Industry Revenue Million Forecast, by Distribution Channel 2020 & 2033
- Table 10: Australia Life and Non-Life Insurance Industry Volume Billion Forecast, by Distribution Channel 2020 & 2033
- Table 11: Australia Life and Non-Life Insurance Industry Revenue Million Forecast, by Country 2020 & 2033
- Table 12: Australia Life and Non-Life Insurance Industry Volume Billion Forecast, by Country 2020 & 2033
Frequently Asked Questions
1. What is the projected Compound Annual Growth Rate (CAGR) of the Australia Life and Non-Life Insurance Industry?
The projected CAGR is approximately 4.56%.
2. Which companies are prominent players in the Australia Life and Non-Life Insurance Industry?
Key companies in the market include Insurance Australia Group Limited, Suncorp Group, AIA Group Limited, Zurich, Medibank Private Limited, Genworth Mortgage Insurance Australia Limited, ClearView Wealth Limited, Cover-More Limited, AMP Limited, NIB Holdings Limited**List Not Exhaustive.
3. What are the main segments of the Australia Life and Non-Life Insurance Industry?
The market segments include Insurance Type, Distribution Channel.
4. Can you provide details about the market size?
The market size is estimated to be USD 51.38 Million as of 2022.
5. What are some drivers contributing to market growth?
Guaranteed Protection Drives The Market.
6. What are the notable trends driving market growth?
Motor Vehicle and Household Insurance has the Largest Shares.
7. Are there any restraints impacting market growth?
Guaranteed Protection Drives The Market.
8. Can you provide examples of recent developments in the market?
February 2023: Insurance Australia Group Limited (IAG), Australia's largest general insurer, invested in Myriota, a global pioneer in low-cost and low-power satellite connectivity for the Internet of Things (IoT). This aim was to explore how IoT devices can help insurance customers manage risk and safeguard their assets.
9. What pricing options are available for accessing the report?
Pricing options include single-user, multi-user, and enterprise licenses priced at USD 3800, USD 4500, and USD 5800 respectively.
10. Is the market size provided in terms of value or volume?
The market size is provided in terms of value, measured in Million and volume, measured in Billion.
11. Are there any specific market keywords associated with the report?
Yes, the market keyword associated with the report is "Australia Life and Non-Life Insurance Industry," which aids in identifying and referencing the specific market segment covered.
12. How do I determine which pricing option suits my needs best?
The pricing options vary based on user requirements and access needs. Individual users may opt for single-user licenses, while businesses requiring broader access may choose multi-user or enterprise licenses for cost-effective access to the report.
13. Are there any additional resources or data provided in the Australia Life and Non-Life Insurance Industry report?
While the report offers comprehensive insights, it's advisable to review the specific contents or supplementary materials provided to ascertain if additional resources or data are available.
14. How can I stay updated on further developments or reports in the Australia Life and Non-Life Insurance Industry?
To stay informed about further developments, trends, and reports in the Australia Life and Non-Life Insurance Industry, consider subscribing to industry newsletters, following relevant companies and organizations, or regularly checking reputable industry news sources and publications.
Methodology
Step 1 - Identification of Relevant Samples Size from Population Database


Step 2 - Approaches for Defining Global Market Size (Value, Volume* & Price*)

Note*: In applicable scenarios
Step 3 - Data Sources
Primary Research
- Web Analytics
- Survey Reports
- Research Institute
- Latest Research Reports
- Opinion Leaders
Secondary Research
- Annual Reports
- White Paper
- Latest Press Release
- Industry Association
- Paid Database
- Investor Presentations

Step 4 - Data Triangulation
Involves using different sources of information in order to increase the validity of a study
These sources are likely to be stakeholders in a program - participants, other researchers, program staff, other community members, and so on.
Then we put all data in single framework & apply various statistical tools to find out the dynamic on the market.
During the analysis stage, feedback from the stakeholder groups would be compared to determine areas of agreement as well as areas of divergence