

Key Insights
The Intelligent Pigging Services market is experiencing robust growth, driven by the increasing need for efficient and cost-effective pipeline inspection and maintenance across the oil and gas industry. The market's Compound Annual Growth Rate (CAGR) exceeding 5.70% from 2019 to 2024 indicates a consistently expanding demand for these services. Key drivers include stringent regulatory compliance mandates for pipeline safety, growing concerns about environmental protection, and the rising age of existing pipelines requiring more frequent inspections. The preference for intelligent pigging over traditional methods stems from its superior accuracy, speed, and ability to detect a wider range of pipeline defects, including cracks, leaks, metal loss, and geometric anomalies. The market segmentation reveals that intelligent pigging, crack & leakage detection applications, and the oil and gas pipeline fluid types are currently the dominant segments. However, we anticipate a growing contribution from caliper pigging and other application types like bend detection as technological advancements improve their efficacy and cost-effectiveness. North America and Europe currently hold significant market share due to established infrastructure and stringent regulatory frameworks, but the Asia-Pacific region is poised for significant growth fueled by rapid industrialization and energy infrastructure development.
The competitive landscape is characterized by a mix of large multinational corporations and specialized service providers. Companies like Rosen Group, IKM Gruppen AS, and STATS Group are major players, leveraging their technological expertise and global presence. However, smaller, regional companies also contribute significantly, particularly in servicing specific geographical markets and niche applications. The forecast period (2025-2033) suggests continued market expansion, driven by factors such as the ongoing investment in pipeline infrastructure globally, the development of more sophisticated intelligent pigging technologies, and a sustained focus on pipeline integrity management. The market's growth trajectory will be influenced by factors such as fluctuations in oil and gas prices, technological innovations, and regulatory changes affecting pipeline safety standards. While some regional markets might experience slower growth due to economic factors, the overall global trend indicates a positive outlook for the intelligent pigging services sector.

Intelligent Pigging Services Market: A Comprehensive Report (2019-2033)
This comprehensive report provides a detailed analysis of the Intelligent Pigging Services Market, encompassing market dynamics, growth trends, regional dominance, product landscape, key players, and future outlook. The report covers the period from 2019 to 2033, with 2025 as the base year and a forecast period of 2025-2033. The market is segmented by pigging type (Intelligent Pigging, Caliper Pigging, Others), application (Crack & Leakage Detection, Metal Loss/Corrosion Detection, Geometry Measurement & Bend Detection, Others), and pipeline fluid type (Oil, Gas). The total market size in 2025 is estimated at xx Million.
Intelligent Pigging Services Market Market Dynamics & Structure
The Intelligent Pigging Services market is characterized by moderate concentration, with key players such as Rosen Group, IKM Gruppen AS, and STATS Group holding significant market share. The market is driven by technological innovations like advanced sensor technology and data analytics, enabling more precise pipeline inspections and reducing downtime. Stringent regulatory frameworks concerning pipeline safety and environmental protection are also significant drivers. However, high initial investment costs and the availability of substitute technologies (e.g., drone inspections for certain applications) pose challenges. Furthermore, the market experiences fluctuations due to variations in oil and gas prices and overall energy demand. M&A activity in the sector is moderate, with xx deals recorded between 2019 and 2024, primarily focused on consolidating market share and acquiring specialized technologies.
- Market Concentration: Moderately concentrated, with top 5 players holding approximately xx% market share in 2025.
- Technological Innovation: Significant advancements in sensor technology, data analytics, and AI are driving market growth.
- Regulatory Framework: Stringent safety and environmental regulations are fueling demand for intelligent pigging services.
- Competitive Substitutes: Drone-based inspections and other non-invasive techniques present some level of competitive pressure.
- End-User Demographics: Primarily oil and gas companies, pipeline operators, and energy infrastructure providers.
- M&A Trends: Moderate M&A activity focused on technology acquisition and market consolidation.
Intelligent Pigging Services Market Growth Trends & Insights
The Intelligent Pigging Services market demonstrated robust growth, achieving a Compound Annual Growth Rate (CAGR) of xx% during the historical period (2019-2024), culminating in a market valuation of xx Million by 2024. This expansion is primarily attributed to several key factors: the escalating global demand for pipeline infrastructure, increasingly stringent safety regulations mandating thorough pipeline inspections, and the widespread adoption of sophisticated pigging technologies offering enhanced accuracy and efficiency. This positive trajectory is projected to continue throughout the forecast period (2025-2033), fueled by continuous technological advancements, the rising need for effective pipeline maintenance strategies, and substantial investments in expanding pipeline infrastructure globally. Market penetration is expected to reach xx% by 2033, driven largely by the increasing prevalence of aging pipeline networks requiring proactive maintenance. The integration of cutting-edge technologies like AI and machine learning for advanced data analytics and predictive maintenance is significantly accelerating market growth. Furthermore, a notable shift towards proactive pipeline maintenance practices, coupled with a growing emphasis on minimizing environmental impact, are contributing to the market's overall expansion.
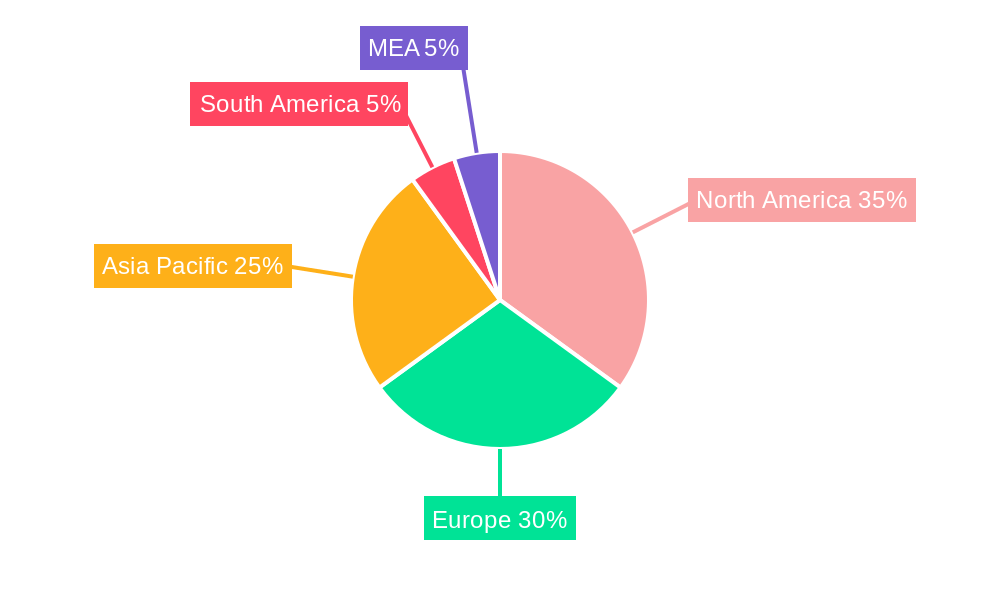
Dominant Regions, Countries, or Segments in Intelligent Pigging Services Market
North America currently commands the largest market share, a position solidified by its extensive pipeline infrastructure and the implementation of rigorous safety regulations. However, the Asia-Pacific region is poised for the most rapid growth, driven by substantial investments in energy infrastructure development and the ongoing expansion of oil and gas exploration activities. Within the market segmentation, Intelligent Pigging services maintain the largest share due to their comprehensive inspection capabilities. Crack & Leakage Detection represents the leading application segment, reflecting the critical importance of preventing environmental damage and ensuring consistent pipeline integrity. The Oil and Gas sector dominates the pipeline fluid type segment, primarily due to the high volume of oil and gas transported and the resultant need for frequent and thorough pipeline inspections.
- Key Drivers:
- North America: Stringent safety regulations, a well-established and extensive pipeline network.
- Asia-Pacific: Rapid energy infrastructure development, substantial increases in oil & gas exploration and production.
- Intelligent Pigging: Comprehensive inspection capabilities, providing detailed data for proactive maintenance.
- Crack & Leakage Detection: Essential for preventing environmental hazards, ensuring operational safety, and minimizing economic losses.
- Oil & Gas: High pipeline volume necessitates frequent and rigorous inspection to guarantee operational efficiency and safety.
- Dominance Factors: The regulatory environment, the pace of infrastructure development, and the specific needs of individual applications are the primary determinants of regional and segment market dominance.
Intelligent Pigging Services Market Product Landscape
The Intelligent Pigging Services market offers a diverse range of products, including intelligent pigs equipped with advanced sensors for detecting various pipeline defects. These pigs provide detailed data on pipeline condition, enabling proactive maintenance and preventing costly disruptions. Recent innovations include the integration of AI and machine learning algorithms for automated defect detection and improved data analysis. The unique selling propositions of these advanced pigging services are improved accuracy, reduced downtime, and enhanced safety. Technological advancements are focused on improving data processing speed, sensor sensitivity, and overall data reliability to ensure efficient and effective pipeline inspections.
Key Drivers, Barriers & Challenges in Intelligent Pigging Services Market
Key Drivers: The increasing demand for efficient pipeline maintenance, growing concerns about pipeline safety and environmental regulations, and technological advancements in pigging technology are major drivers for market growth. The rising number of aging pipelines requires more frequent inspections.
Key Challenges: High initial investment costs associated with purchasing and deploying intelligent pigging systems, the need for specialized personnel for operation and maintenance, and competition from other inspection technologies pose significant challenges to the market's growth. Supply chain disruptions in procuring essential components can also impact market growth. Regulatory hurdles and varying safety standards across different regions create complexities for businesses operating in this market.
Emerging Opportunities in Intelligent Pigging Services Market
Significant growth opportunities exist in the development of advanced data analytics capabilities to generate predictive maintenance recommendations, optimizing maintenance schedules and minimizing downtime. The integration of IoT and cloud computing technologies for real-time data monitoring and remote operation presents substantial growth potential, allowing for more efficient and cost-effective services. Furthermore, expansion into untapped markets within developing economies experiencing rapid growth in their energy infrastructure presents significant opportunities for market expansion. The development of specialized pigging solutions tailored to specific pipeline types and fluid characteristics represents a lucrative niche market with high growth potential.
Growth Accelerators in the Intelligent Pigging Services Market Industry
Long-term market growth will be significantly accelerated by strategic partnerships between pigging service providers and pipeline operators. This collaboration fosters innovation, leading to the development of more cost-effective and efficient solutions. Technological advancements, particularly the integration of robotics and automation in pigging operations, will further enhance inspection efficiency and reduce reliance on manual labor. Expansion into new geographic markets and diversification into related services such as pipeline repair and maintenance will further propel market growth.
Key Players Shaping the Intelligent Pigging Services Market Market
- Rosen Group
- IKM Gruppen AS
- Dacon Inspection Services Co Ltd
- STATS Group
- Romstar Sdn Bhd
- Penspen Limited
- Oil States Industries
- Rouge Pipeline & Process Services
- Baker Hughes Company
- Enduro Pipeline Services Inc
- Onstream Pipeline Inspection Ltd
- T D Williamson Inc
- NDT Global Services Ltd
Notable Milestones in Intelligent Pigging Services Market Sector
- 2020: Introduction of AI-powered data analysis software by STATS Group, significantly improving inspection efficiency.
- 2022: Rosen Group launched a new generation of intelligent pigs with enhanced sensor capabilities.
- 2023: Merger between two mid-sized pigging service providers leading to broader service offerings.
In-Depth Intelligent Pigging Services Market Market Outlook
The Intelligent Pigging Services market is poised for sustained growth, driven by the confluence of increasing investment in pipeline infrastructure, ongoing technological advancements, and a heightened emphasis on safety and environmental regulations. The market presents substantial opportunities for businesses offering innovative solutions and forging strategic partnerships. Key strategies for capturing future market share include expanding into emerging markets and leveraging data analytics for predictive maintenance. The long-term outlook remains exceptionally positive, with significant potential for continued growth and substantial technological innovation in the coming decade.
Intelligent Pigging Services Market Segmentation
-
1. Pigging Type
-
1.1. Intelligent Pigging
- 1.1.1. Magnetic Flux Leakage (MFL) Pigging
- 1.1.2. Ultrasonic Test Pigging
- 1.1.3. Caliper Pigging
- 1.2. Others
-
1.1. Intelligent Pigging
-
2. Application
- 2.1. Crack & Leakage Detection
- 2.2. Metal Loss/Corrosion Detection
- 2.3. Geometry Measurement & Bend Detection
- 2.4. Others
-
3. Pipeline Fluid Type
- 3.1. Oil
- 3.2. Gas
Intelligent Pigging Services Market Segmentation By Geography
- 1. North America
- 2. Europe
- 3. Asia Pacific
- 4. Middle East and Africa
- 5. South America
Intelligent Pigging Services Market REPORT HIGHLIGHTS
| Aspects | Details |
|---|---|
| Study Period | 2019-2033 |
| Base Year | 2024 |
| Estimated Year | 2025 |
| Forecast Period | 2025-2033 |
| Historical Period | 2019-2024 |
| Growth Rate | CAGR of > 5.70% from 2019-2033 |
| Segmentation |
|
Table of Contents
- 1. Introduction
- 1.1. Research Scope
- 1.2. Market Segmentation
- 1.3. Research Methodology
- 1.4. Definitions and Assumptions
- 2. Executive Summary
- 2.1. Introduction
- 3. Market Dynamics
- 3.1. Introduction
- 3.2. Market Drivers
- 3.2.1. 4.; Growing Demand for Renewable Energy4.; Upcoming Investments in the Energy Sector and Supportive Renewable Energy Policies
- 3.3. Market Restrains
- 3.3.1. 4.; High Initial Investment Cost and Long Investment Return Period on Projects
- 3.4. Market Trends
- 3.4.1. Intelligent Pigging Segment to Dominate the Market
- 4. Market Factor Analysis
- 4.1. Porters Five Forces
- 4.2. Supply/Value Chain
- 4.3. PESTEL analysis
- 4.4. Market Entropy
- 4.5. Patent/Trademark Analysis
- 5. Global Intelligent Pigging Services Market Analysis, Insights and Forecast, 2019-2031
- 5.1. Market Analysis, Insights and Forecast - by Pigging Type
- 5.1.1. Intelligent Pigging
- 5.1.1.1. Magnetic Flux Leakage (MFL) Pigging
- 5.1.1.2. Ultrasonic Test Pigging
- 5.1.1.3. Caliper Pigging
- 5.1.2. Others
- 5.1.1. Intelligent Pigging
- 5.2. Market Analysis, Insights and Forecast - by Application
- 5.2.1. Crack & Leakage Detection
- 5.2.2. Metal Loss/Corrosion Detection
- 5.2.3. Geometry Measurement & Bend Detection
- 5.2.4. Others
- 5.3. Market Analysis, Insights and Forecast - by Pipeline Fluid Type
- 5.3.1. Oil
- 5.3.2. Gas
- 5.4. Market Analysis, Insights and Forecast - by Region
- 5.4.1. North America
- 5.4.2. Europe
- 5.4.3. Asia Pacific
- 5.4.4. Middle East and Africa
- 5.4.5. South America
- 5.1. Market Analysis, Insights and Forecast - by Pigging Type
- 6. North America Intelligent Pigging Services Market Analysis, Insights and Forecast, 2019-2031
- 6.1. Market Analysis, Insights and Forecast - by Pigging Type
- 6.1.1. Intelligent Pigging
- 6.1.1.1. Magnetic Flux Leakage (MFL) Pigging
- 6.1.1.2. Ultrasonic Test Pigging
- 6.1.1.3. Caliper Pigging
- 6.1.2. Others
- 6.1.1. Intelligent Pigging
- 6.2. Market Analysis, Insights and Forecast - by Application
- 6.2.1. Crack & Leakage Detection
- 6.2.2. Metal Loss/Corrosion Detection
- 6.2.3. Geometry Measurement & Bend Detection
- 6.2.4. Others
- 6.3. Market Analysis, Insights and Forecast - by Pipeline Fluid Type
- 6.3.1. Oil
- 6.3.2. Gas
- 6.1. Market Analysis, Insights and Forecast - by Pigging Type
- 7. Europe Intelligent Pigging Services Market Analysis, Insights and Forecast, 2019-2031
- 7.1. Market Analysis, Insights and Forecast - by Pigging Type
- 7.1.1. Intelligent Pigging
- 7.1.1.1. Magnetic Flux Leakage (MFL) Pigging
- 7.1.1.2. Ultrasonic Test Pigging
- 7.1.1.3. Caliper Pigging
- 7.1.2. Others
- 7.1.1. Intelligent Pigging
- 7.2. Market Analysis, Insights and Forecast - by Application
- 7.2.1. Crack & Leakage Detection
- 7.2.2. Metal Loss/Corrosion Detection
- 7.2.3. Geometry Measurement & Bend Detection
- 7.2.4. Others
- 7.3. Market Analysis, Insights and Forecast - by Pipeline Fluid Type
- 7.3.1. Oil
- 7.3.2. Gas
- 7.1. Market Analysis, Insights and Forecast - by Pigging Type
- 8. Asia Pacific Intelligent Pigging Services Market Analysis, Insights and Forecast, 2019-2031
- 8.1. Market Analysis, Insights and Forecast - by Pigging Type
- 8.1.1. Intelligent Pigging
- 8.1.1.1. Magnetic Flux Leakage (MFL) Pigging
- 8.1.1.2. Ultrasonic Test Pigging
- 8.1.1.3. Caliper Pigging
- 8.1.2. Others
- 8.1.1. Intelligent Pigging
- 8.2. Market Analysis, Insights and Forecast - by Application
- 8.2.1. Crack & Leakage Detection
- 8.2.2. Metal Loss/Corrosion Detection
- 8.2.3. Geometry Measurement & Bend Detection
- 8.2.4. Others
- 8.3. Market Analysis, Insights and Forecast - by Pipeline Fluid Type
- 8.3.1. Oil
- 8.3.2. Gas
- 8.1. Market Analysis, Insights and Forecast - by Pigging Type
- 9. Middle East and Africa Intelligent Pigging Services Market Analysis, Insights and Forecast, 2019-2031
- 9.1. Market Analysis, Insights and Forecast - by Pigging Type
- 9.1.1. Intelligent Pigging
- 9.1.1.1. Magnetic Flux Leakage (MFL) Pigging
- 9.1.1.2. Ultrasonic Test Pigging
- 9.1.1.3. Caliper Pigging
- 9.1.2. Others
- 9.1.1. Intelligent Pigging
- 9.2. Market Analysis, Insights and Forecast - by Application
- 9.2.1. Crack & Leakage Detection
- 9.2.2. Metal Loss/Corrosion Detection
- 9.2.3. Geometry Measurement & Bend Detection
- 9.2.4. Others
- 9.3. Market Analysis, Insights and Forecast - by Pipeline Fluid Type
- 9.3.1. Oil
- 9.3.2. Gas
- 9.1. Market Analysis, Insights and Forecast - by Pigging Type
- 10. South America Intelligent Pigging Services Market Analysis, Insights and Forecast, 2019-2031
- 10.1. Market Analysis, Insights and Forecast - by Pigging Type
- 10.1.1. Intelligent Pigging
- 10.1.1.1. Magnetic Flux Leakage (MFL) Pigging
- 10.1.1.2. Ultrasonic Test Pigging
- 10.1.1.3. Caliper Pigging
- 10.1.2. Others
- 10.1.1. Intelligent Pigging
- 10.2. Market Analysis, Insights and Forecast - by Application
- 10.2.1. Crack & Leakage Detection
- 10.2.2. Metal Loss/Corrosion Detection
- 10.2.3. Geometry Measurement & Bend Detection
- 10.2.4. Others
- 10.3. Market Analysis, Insights and Forecast - by Pipeline Fluid Type
- 10.3.1. Oil
- 10.3.2. Gas
- 10.1. Market Analysis, Insights and Forecast - by Pigging Type
- 11. North America Intelligent Pigging Services Market Analysis, Insights and Forecast, 2019-2031
- 11.1. Market Analysis, Insights and Forecast - By Country/Sub-region
- 11.1.1 United States
- 11.1.2 Canada
- 11.1.3 Mexico
- 12. Europe Intelligent Pigging Services Market Analysis, Insights and Forecast, 2019-2031
- 12.1. Market Analysis, Insights and Forecast - By Country/Sub-region
- 12.1.1 Germany
- 12.1.2 United Kingdom
- 12.1.3 France
- 12.1.4 Spain
- 12.1.5 Italy
- 12.1.6 Spain
- 12.1.7 Belgium
- 12.1.8 Netherland
- 12.1.9 Nordics
- 12.1.10 Rest of Europe
- 13. Asia Pacific Intelligent Pigging Services Market Analysis, Insights and Forecast, 2019-2031
- 13.1. Market Analysis, Insights and Forecast - By Country/Sub-region
- 13.1.1 China
- 13.1.2 Japan
- 13.1.3 India
- 13.1.4 South Korea
- 13.1.5 Southeast Asia
- 13.1.6 Australia
- 13.1.7 Indonesia
- 13.1.8 Phillipes
- 13.1.9 Singapore
- 13.1.10 Thailandc
- 13.1.11 Rest of Asia Pacific
- 14. South America Intelligent Pigging Services Market Analysis, Insights and Forecast, 2019-2031
- 14.1. Market Analysis, Insights and Forecast - By Country/Sub-region
- 14.1.1 Brazil
- 14.1.2 Argentina
- 14.1.3 Peru
- 14.1.4 Chile
- 14.1.5 Colombia
- 14.1.6 Ecuador
- 14.1.7 Venezuela
- 14.1.8 Rest of South America
- 15. MEA Intelligent Pigging Services Market Analysis, Insights and Forecast, 2019-2031
- 15.1. Market Analysis, Insights and Forecast - By Country/Sub-region
- 15.1.1 United Arab Emirates
- 15.1.2 Saudi Arabia
- 15.1.3 South Africa
- 15.1.4 Rest of Middle East and Africa
- 16. Competitive Analysis
- 16.1. Global Market Share Analysis 2024
- 16.2. Company Profiles
- 16.2.1 Rosen Group
- 16.2.1.1. Overview
- 16.2.1.2. Products
- 16.2.1.3. SWOT Analysis
- 16.2.1.4. Recent Developments
- 16.2.1.5. Financials (Based on Availability)
- 16.2.2 IKM Gruppen AS
- 16.2.2.1. Overview
- 16.2.2.2. Products
- 16.2.2.3. SWOT Analysis
- 16.2.2.4. Recent Developments
- 16.2.2.5. Financials (Based on Availability)
- 16.2.3 Dacon Inspection Services Co Ltd
- 16.2.3.1. Overview
- 16.2.3.2. Products
- 16.2.3.3. SWOT Analysis
- 16.2.3.4. Recent Developments
- 16.2.3.5. Financials (Based on Availability)
- 16.2.4 STATS Group
- 16.2.4.1. Overview
- 16.2.4.2. Products
- 16.2.4.3. SWOT Analysis
- 16.2.4.4. Recent Developments
- 16.2.4.5. Financials (Based on Availability)
- 16.2.5 Romstar Sdn Bhd
- 16.2.5.1. Overview
- 16.2.5.2. Products
- 16.2.5.3. SWOT Analysis
- 16.2.5.4. Recent Developments
- 16.2.5.5. Financials (Based on Availability)
- 16.2.6 Penspen Limited
- 16.2.6.1. Overview
- 16.2.6.2. Products
- 16.2.6.3. SWOT Analysis
- 16.2.6.4. Recent Developments
- 16.2.6.5. Financials (Based on Availability)
- 16.2.7 Oil States Industries
- 16.2.7.1. Overview
- 16.2.7.2. Products
- 16.2.7.3. SWOT Analysis
- 16.2.7.4. Recent Developments
- 16.2.7.5. Financials (Based on Availability)
- 16.2.8 Rouge Pipeline & Process Services
- 16.2.8.1. Overview
- 16.2.8.2. Products
- 16.2.8.3. SWOT Analysis
- 16.2.8.4. Recent Developments
- 16.2.8.5. Financials (Based on Availability)
- 16.2.9 Baker Hughes Company
- 16.2.9.1. Overview
- 16.2.9.2. Products
- 16.2.9.3. SWOT Analysis
- 16.2.9.4. Recent Developments
- 16.2.9.5. Financials (Based on Availability)
- 16.2.10 Enduro Pipeline Services Inc
- 16.2.10.1. Overview
- 16.2.10.2. Products
- 16.2.10.3. SWOT Analysis
- 16.2.10.4. Recent Developments
- 16.2.10.5. Financials (Based on Availability)
- 16.2.11 Onstream Pipeline Inspection Ltd
- 16.2.11.1. Overview
- 16.2.11.2. Products
- 16.2.11.3. SWOT Analysis
- 16.2.11.4. Recent Developments
- 16.2.11.5. Financials (Based on Availability)
- 16.2.12 T D Williamson Inc
- 16.2.12.1. Overview
- 16.2.12.2. Products
- 16.2.12.3. SWOT Analysis
- 16.2.12.4. Recent Developments
- 16.2.12.5. Financials (Based on Availability)
- 16.2.13 NDT Global Services Ltd
- 16.2.13.1. Overview
- 16.2.13.2. Products
- 16.2.13.3. SWOT Analysis
- 16.2.13.4. Recent Developments
- 16.2.13.5. Financials (Based on Availability)
- 16.2.1 Rosen Group
List of Figures
- Figure 1: Global Intelligent Pigging Services Market Revenue Breakdown (Million, %) by Region 2024 & 2032
- Figure 2: North America Intelligent Pigging Services Market Revenue (Million), by Country 2024 & 2032
- Figure 3: North America Intelligent Pigging Services Market Revenue Share (%), by Country 2024 & 2032
- Figure 4: Europe Intelligent Pigging Services Market Revenue (Million), by Country 2024 & 2032
- Figure 5: Europe Intelligent Pigging Services Market Revenue Share (%), by Country 2024 & 2032
- Figure 6: Asia Pacific Intelligent Pigging Services Market Revenue (Million), by Country 2024 & 2032
- Figure 7: Asia Pacific Intelligent Pigging Services Market Revenue Share (%), by Country 2024 & 2032
- Figure 8: South America Intelligent Pigging Services Market Revenue (Million), by Country 2024 & 2032
- Figure 9: South America Intelligent Pigging Services Market Revenue Share (%), by Country 2024 & 2032
- Figure 10: MEA Intelligent Pigging Services Market Revenue (Million), by Country 2024 & 2032
- Figure 11: MEA Intelligent Pigging Services Market Revenue Share (%), by Country 2024 & 2032
- Figure 12: North America Intelligent Pigging Services Market Revenue (Million), by Pigging Type 2024 & 2032
- Figure 13: North America Intelligent Pigging Services Market Revenue Share (%), by Pigging Type 2024 & 2032
- Figure 14: North America Intelligent Pigging Services Market Revenue (Million), by Application 2024 & 2032
- Figure 15: North America Intelligent Pigging Services Market Revenue Share (%), by Application 2024 & 2032
- Figure 16: North America Intelligent Pigging Services Market Revenue (Million), by Pipeline Fluid Type 2024 & 2032
- Figure 17: North America Intelligent Pigging Services Market Revenue Share (%), by Pipeline Fluid Type 2024 & 2032
- Figure 18: North America Intelligent Pigging Services Market Revenue (Million), by Country 2024 & 2032
- Figure 19: North America Intelligent Pigging Services Market Revenue Share (%), by Country 2024 & 2032
- Figure 20: Europe Intelligent Pigging Services Market Revenue (Million), by Pigging Type 2024 & 2032
- Figure 21: Europe Intelligent Pigging Services Market Revenue Share (%), by Pigging Type 2024 & 2032
- Figure 22: Europe Intelligent Pigging Services Market Revenue (Million), by Application 2024 & 2032
- Figure 23: Europe Intelligent Pigging Services Market Revenue Share (%), by Application 2024 & 2032
- Figure 24: Europe Intelligent Pigging Services Market Revenue (Million), by Pipeline Fluid Type 2024 & 2032
- Figure 25: Europe Intelligent Pigging Services Market Revenue Share (%), by Pipeline Fluid Type 2024 & 2032
- Figure 26: Europe Intelligent Pigging Services Market Revenue (Million), by Country 2024 & 2032
- Figure 27: Europe Intelligent Pigging Services Market Revenue Share (%), by Country 2024 & 2032
- Figure 28: Asia Pacific Intelligent Pigging Services Market Revenue (Million), by Pigging Type 2024 & 2032
- Figure 29: Asia Pacific Intelligent Pigging Services Market Revenue Share (%), by Pigging Type 2024 & 2032
- Figure 30: Asia Pacific Intelligent Pigging Services Market Revenue (Million), by Application 2024 & 2032
- Figure 31: Asia Pacific Intelligent Pigging Services Market Revenue Share (%), by Application 2024 & 2032
- Figure 32: Asia Pacific Intelligent Pigging Services Market Revenue (Million), by Pipeline Fluid Type 2024 & 2032
- Figure 33: Asia Pacific Intelligent Pigging Services Market Revenue Share (%), by Pipeline Fluid Type 2024 & 2032
- Figure 34: Asia Pacific Intelligent Pigging Services Market Revenue (Million), by Country 2024 & 2032
- Figure 35: Asia Pacific Intelligent Pigging Services Market Revenue Share (%), by Country 2024 & 2032
- Figure 36: Middle East and Africa Intelligent Pigging Services Market Revenue (Million), by Pigging Type 2024 & 2032
- Figure 37: Middle East and Africa Intelligent Pigging Services Market Revenue Share (%), by Pigging Type 2024 & 2032
- Figure 38: Middle East and Africa Intelligent Pigging Services Market Revenue (Million), by Application 2024 & 2032
- Figure 39: Middle East and Africa Intelligent Pigging Services Market Revenue Share (%), by Application 2024 & 2032
- Figure 40: Middle East and Africa Intelligent Pigging Services Market Revenue (Million), by Pipeline Fluid Type 2024 & 2032
- Figure 41: Middle East and Africa Intelligent Pigging Services Market Revenue Share (%), by Pipeline Fluid Type 2024 & 2032
- Figure 42: Middle East and Africa Intelligent Pigging Services Market Revenue (Million), by Country 2024 & 2032
- Figure 43: Middle East and Africa Intelligent Pigging Services Market Revenue Share (%), by Country 2024 & 2032
- Figure 44: South America Intelligent Pigging Services Market Revenue (Million), by Pigging Type 2024 & 2032
- Figure 45: South America Intelligent Pigging Services Market Revenue Share (%), by Pigging Type 2024 & 2032
- Figure 46: South America Intelligent Pigging Services Market Revenue (Million), by Application 2024 & 2032
- Figure 47: South America Intelligent Pigging Services Market Revenue Share (%), by Application 2024 & 2032
- Figure 48: South America Intelligent Pigging Services Market Revenue (Million), by Pipeline Fluid Type 2024 & 2032
- Figure 49: South America Intelligent Pigging Services Market Revenue Share (%), by Pipeline Fluid Type 2024 & 2032
- Figure 50: South America Intelligent Pigging Services Market Revenue (Million), by Country 2024 & 2032
- Figure 51: South America Intelligent Pigging Services Market Revenue Share (%), by Country 2024 & 2032
List of Tables
- Table 1: Global Intelligent Pigging Services Market Revenue Million Forecast, by Region 2019 & 2032
- Table 2: Global Intelligent Pigging Services Market Revenue Million Forecast, by Pigging Type 2019 & 2032
- Table 3: Global Intelligent Pigging Services Market Revenue Million Forecast, by Application 2019 & 2032
- Table 4: Global Intelligent Pigging Services Market Revenue Million Forecast, by Pipeline Fluid Type 2019 & 2032
- Table 5: Global Intelligent Pigging Services Market Revenue Million Forecast, by Region 2019 & 2032
- Table 6: Global Intelligent Pigging Services Market Revenue Million Forecast, by Country 2019 & 2032
- Table 7: United States Intelligent Pigging Services Market Revenue (Million) Forecast, by Application 2019 & 2032
- Table 8: Canada Intelligent Pigging Services Market Revenue (Million) Forecast, by Application 2019 & 2032
- Table 9: Mexico Intelligent Pigging Services Market Revenue (Million) Forecast, by Application 2019 & 2032
- Table 10: Global Intelligent Pigging Services Market Revenue Million Forecast, by Country 2019 & 2032
- Table 11: Germany Intelligent Pigging Services Market Revenue (Million) Forecast, by Application 2019 & 2032
- Table 12: United Kingdom Intelligent Pigging Services Market Revenue (Million) Forecast, by Application 2019 & 2032
- Table 13: France Intelligent Pigging Services Market Revenue (Million) Forecast, by Application 2019 & 2032
- Table 14: Spain Intelligent Pigging Services Market Revenue (Million) Forecast, by Application 2019 & 2032
- Table 15: Italy Intelligent Pigging Services Market Revenue (Million) Forecast, by Application 2019 & 2032
- Table 16: Spain Intelligent Pigging Services Market Revenue (Million) Forecast, by Application 2019 & 2032
- Table 17: Belgium Intelligent Pigging Services Market Revenue (Million) Forecast, by Application 2019 & 2032
- Table 18: Netherland Intelligent Pigging Services Market Revenue (Million) Forecast, by Application 2019 & 2032
- Table 19: Nordics Intelligent Pigging Services Market Revenue (Million) Forecast, by Application 2019 & 2032
- Table 20: Rest of Europe Intelligent Pigging Services Market Revenue (Million) Forecast, by Application 2019 & 2032
- Table 21: Global Intelligent Pigging Services Market Revenue Million Forecast, by Country 2019 & 2032
- Table 22: China Intelligent Pigging Services Market Revenue (Million) Forecast, by Application 2019 & 2032
- Table 23: Japan Intelligent Pigging Services Market Revenue (Million) Forecast, by Application 2019 & 2032
- Table 24: India Intelligent Pigging Services Market Revenue (Million) Forecast, by Application 2019 & 2032
- Table 25: South Korea Intelligent Pigging Services Market Revenue (Million) Forecast, by Application 2019 & 2032
- Table 26: Southeast Asia Intelligent Pigging Services Market Revenue (Million) Forecast, by Application 2019 & 2032
- Table 27: Australia Intelligent Pigging Services Market Revenue (Million) Forecast, by Application 2019 & 2032
- Table 28: Indonesia Intelligent Pigging Services Market Revenue (Million) Forecast, by Application 2019 & 2032
- Table 29: Phillipes Intelligent Pigging Services Market Revenue (Million) Forecast, by Application 2019 & 2032
- Table 30: Singapore Intelligent Pigging Services Market Revenue (Million) Forecast, by Application 2019 & 2032
- Table 31: Thailandc Intelligent Pigging Services Market Revenue (Million) Forecast, by Application 2019 & 2032
- Table 32: Rest of Asia Pacific Intelligent Pigging Services Market Revenue (Million) Forecast, by Application 2019 & 2032
- Table 33: Global Intelligent Pigging Services Market Revenue Million Forecast, by Country 2019 & 2032
- Table 34: Brazil Intelligent Pigging Services Market Revenue (Million) Forecast, by Application 2019 & 2032
- Table 35: Argentina Intelligent Pigging Services Market Revenue (Million) Forecast, by Application 2019 & 2032
- Table 36: Peru Intelligent Pigging Services Market Revenue (Million) Forecast, by Application 2019 & 2032
- Table 37: Chile Intelligent Pigging Services Market Revenue (Million) Forecast, by Application 2019 & 2032
- Table 38: Colombia Intelligent Pigging Services Market Revenue (Million) Forecast, by Application 2019 & 2032
- Table 39: Ecuador Intelligent Pigging Services Market Revenue (Million) Forecast, by Application 2019 & 2032
- Table 40: Venezuela Intelligent Pigging Services Market Revenue (Million) Forecast, by Application 2019 & 2032
- Table 41: Rest of South America Intelligent Pigging Services Market Revenue (Million) Forecast, by Application 2019 & 2032
- Table 42: Global Intelligent Pigging Services Market Revenue Million Forecast, by Country 2019 & 2032
- Table 43: United Arab Emirates Intelligent Pigging Services Market Revenue (Million) Forecast, by Application 2019 & 2032
- Table 44: Saudi Arabia Intelligent Pigging Services Market Revenue (Million) Forecast, by Application 2019 & 2032
- Table 45: South Africa Intelligent Pigging Services Market Revenue (Million) Forecast, by Application 2019 & 2032
- Table 46: Rest of Middle East and Africa Intelligent Pigging Services Market Revenue (Million) Forecast, by Application 2019 & 2032
- Table 47: Global Intelligent Pigging Services Market Revenue Million Forecast, by Pigging Type 2019 & 2032
- Table 48: Global Intelligent Pigging Services Market Revenue Million Forecast, by Application 2019 & 2032
- Table 49: Global Intelligent Pigging Services Market Revenue Million Forecast, by Pipeline Fluid Type 2019 & 2032
- Table 50: Global Intelligent Pigging Services Market Revenue Million Forecast, by Country 2019 & 2032
- Table 51: Global Intelligent Pigging Services Market Revenue Million Forecast, by Pigging Type 2019 & 2032
- Table 52: Global Intelligent Pigging Services Market Revenue Million Forecast, by Application 2019 & 2032
- Table 53: Global Intelligent Pigging Services Market Revenue Million Forecast, by Pipeline Fluid Type 2019 & 2032
- Table 54: Global Intelligent Pigging Services Market Revenue Million Forecast, by Country 2019 & 2032
- Table 55: Global Intelligent Pigging Services Market Revenue Million Forecast, by Pigging Type 2019 & 2032
- Table 56: Global Intelligent Pigging Services Market Revenue Million Forecast, by Application 2019 & 2032
- Table 57: Global Intelligent Pigging Services Market Revenue Million Forecast, by Pipeline Fluid Type 2019 & 2032
- Table 58: Global Intelligent Pigging Services Market Revenue Million Forecast, by Country 2019 & 2032
- Table 59: Global Intelligent Pigging Services Market Revenue Million Forecast, by Pigging Type 2019 & 2032
- Table 60: Global Intelligent Pigging Services Market Revenue Million Forecast, by Application 2019 & 2032
- Table 61: Global Intelligent Pigging Services Market Revenue Million Forecast, by Pipeline Fluid Type 2019 & 2032
- Table 62: Global Intelligent Pigging Services Market Revenue Million Forecast, by Country 2019 & 2032
- Table 63: Global Intelligent Pigging Services Market Revenue Million Forecast, by Pigging Type 2019 & 2032
- Table 64: Global Intelligent Pigging Services Market Revenue Million Forecast, by Application 2019 & 2032
- Table 65: Global Intelligent Pigging Services Market Revenue Million Forecast, by Pipeline Fluid Type 2019 & 2032
- Table 66: Global Intelligent Pigging Services Market Revenue Million Forecast, by Country 2019 & 2032
Frequently Asked Questions
1. What is the projected Compound Annual Growth Rate (CAGR) of the Intelligent Pigging Services Market?
The projected CAGR is approximately > 5.70%.
2. Which companies are prominent players in the Intelligent Pigging Services Market?
Key companies in the market include Rosen Group, IKM Gruppen AS, Dacon Inspection Services Co Ltd, STATS Group, Romstar Sdn Bhd, Penspen Limited, Oil States Industries, Rouge Pipeline & Process Services, Baker Hughes Company, Enduro Pipeline Services Inc, Onstream Pipeline Inspection Ltd, T D Williamson Inc, NDT Global Services Ltd.
3. What are the main segments of the Intelligent Pigging Services Market?
The market segments include Pigging Type, Application, Pipeline Fluid Type.
4. Can you provide details about the market size?
The market size is estimated to be USD XX Million as of 2022.
5. What are some drivers contributing to market growth?
4.; Growing Demand for Renewable Energy4.; Upcoming Investments in the Energy Sector and Supportive Renewable Energy Policies.
6. What are the notable trends driving market growth?
Intelligent Pigging Segment to Dominate the Market.
7. Are there any restraints impacting market growth?
4.; High Initial Investment Cost and Long Investment Return Period on Projects.
8. Can you provide examples of recent developments in the market?
N/A
9. What pricing options are available for accessing the report?
Pricing options include single-user, multi-user, and enterprise licenses priced at USD 4750, USD 5250, and USD 8750 respectively.
10. Is the market size provided in terms of value or volume?
The market size is provided in terms of value, measured in Million.
11. Are there any specific market keywords associated with the report?
Yes, the market keyword associated with the report is "Intelligent Pigging Services Market," which aids in identifying and referencing the specific market segment covered.
12. How do I determine which pricing option suits my needs best?
The pricing options vary based on user requirements and access needs. Individual users may opt for single-user licenses, while businesses requiring broader access may choose multi-user or enterprise licenses for cost-effective access to the report.
13. Are there any additional resources or data provided in the Intelligent Pigging Services Market report?
While the report offers comprehensive insights, it's advisable to review the specific contents or supplementary materials provided to ascertain if additional resources or data are available.
14. How can I stay updated on further developments or reports in the Intelligent Pigging Services Market?
To stay informed about further developments, trends, and reports in the Intelligent Pigging Services Market, consider subscribing to industry newsletters, following relevant companies and organizations, or regularly checking reputable industry news sources and publications.
Methodology
Step 1 - Identification of Relevant Samples Size from Population Database


Step 2 - Approaches for Defining Global Market Size (Value, Volume* & Price*)

Note*: In applicable scenarios
Step 3 - Data Sources
Primary Research
- Web Analytics
- Survey Reports
- Research Institute
- Latest Research Reports
- Opinion Leaders
Secondary Research
- Annual Reports
- White Paper
- Latest Press Release
- Industry Association
- Paid Database
- Investor Presentations

Step 4 - Data Triangulation
Involves using different sources of information in order to increase the validity of a study
These sources are likely to be stakeholders in a program - participants, other researchers, program staff, other community members, and so on.
Then we put all data in single framework & apply various statistical tools to find out the dynamic on the market.
During the analysis stage, feedback from the stakeholder groups would be compared to determine areas of agreement as well as areas of divergence
