

Key Insights
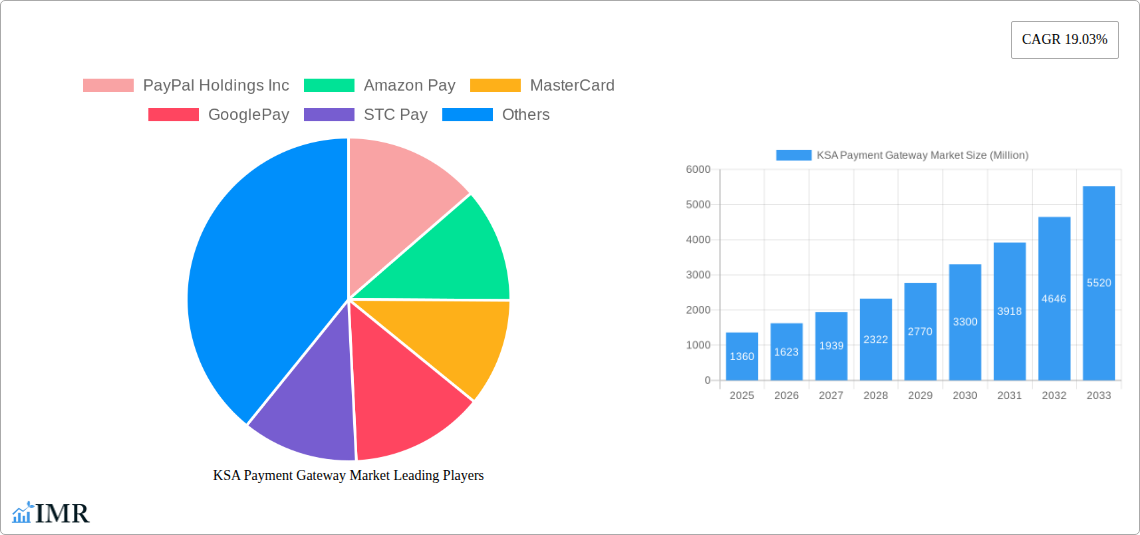
The Kingdom of Saudi Arabia (KSA) payment gateway market exhibits robust growth, projected to reach a market size of $1.36 billion in 2025, expanding at a compound annual growth rate (CAGR) of 19.03%. This surge is fueled by several key drivers. The rapid adoption of e-commerce, driven by a young and tech-savvy population, is a major catalyst. Government initiatives promoting digital transformation and financial inclusion, such as Vision 2030, are further accelerating market expansion. Increased mobile penetration and the rising preference for contactless payment methods also contribute significantly. Furthermore, the burgeoning fintech sector in KSA is fostering innovation and competition, leading to the development of sophisticated and user-friendly payment gateway solutions. While data limitations prevent precise segmentation details, it's evident that the market comprises diverse players, ranging from global giants like PayPal and Mastercard to regional and local providers such as STC Pay, PayTabs, and HyperPay, indicating a dynamic competitive landscape.
The market's future trajectory indicates continued expansion throughout the forecast period (2025-2033). Growth will likely be influenced by factors such as the increasing adoption of Buy Now Pay Later (BNPL) services, the further integration of payment gateways with various online platforms and marketplaces, and the ongoing development of robust cybersecurity infrastructure to address potential risks. While challenges like maintaining regulatory compliance and ensuring data security exist, the overall market outlook remains positive, with significant opportunities for both established players and new entrants. The ongoing diversification of the Saudi Arabian economy and its emphasis on technological advancement will continue to propel the growth of the KSA payment gateway market in the coming years.
KSA Payment Gateway Market: A Comprehensive Report (2019-2033)
This in-depth report provides a comprehensive analysis of the Kingdom of Saudi Arabia (KSA) payment gateway market, covering market dynamics, growth trends, dominant segments, key players, and future outlook. The study period spans from 2019 to 2033, with 2025 serving as the base and estimated year. The report utilizes a wealth of data to offer actionable insights for businesses and investors in this rapidly evolving sector. The parent market is the broader KSA Fintech market, while the child market is specifically payment gateway solutions within KSA.
KSA Payment Gateway Market Dynamics & Structure
The KSA payment gateway market is characterized by a dynamic interplay of factors influencing its structure and growth. Market concentration is currently [xx]% with the top 5 players holding [xx]% of the market share in 2024. Technological innovation, driven by the increasing adoption of mobile payments and e-commerce, is a key driver. The regulatory framework, overseen by the Saudi Arabian Monetary Authority (SAMA), plays a crucial role in shaping market dynamics. Competitive pressures from alternative payment methods, such as cash and bank transfers, remain significant, although their market share is declining steadily (from [xx]% in 2019 to a projected [xx]% in 2025). The end-user demographics are increasingly skewed towards younger, tech-savvy consumers. Furthermore, the market witnesses an increasing number of M&A activities, with [xx] deals recorded in the historical period (2019-2024), representing an average annual volume of [xx] deals.
- Market Concentration: [xx]% in 2024, Top 5 players holding [xx]%.
- Technological Innovation: Mobile payments, e-commerce growth, and rising digital literacy.
- Regulatory Framework: SAMA's influence on licensing and security standards.
- Competitive Substitutes: Cash, bank transfers (declining market share).
- End-User Demographics: Young, tech-savvy population driving adoption.
- M&A Activity: [xx] deals (2019-2024), Average [xx] deals annually.
KSA Payment Gateway Market Growth Trends & Insights
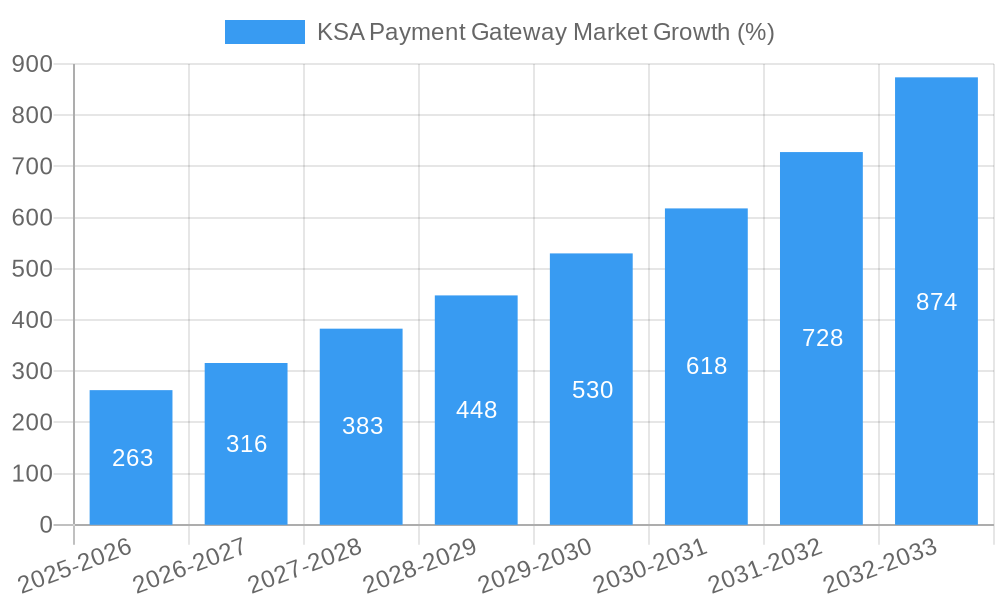
The KSA payment gateway market exhibits robust growth, driven by the Kingdom's Vision 2030 initiative promoting digital transformation. The market size expanded from [xx] Million in 2019 to [xx] Million in 2024, registering a CAGR of [xx]%. This growth is projected to continue, reaching [xx] Million by 2033, with a projected CAGR of [xx]% during the forecast period (2025-2033). Adoption rates are steadily increasing, particularly among SMEs and larger enterprises seeking to enhance their online sales capabilities. Technological disruptions, such as the rise of Open Banking and embedded finance, are reshaping the competitive landscape. Consumer behavior is shifting towards contactless and mobile payments, reflecting a preference for convenience and security. The market penetration rate is expected to increase from [xx]% in 2024 to [xx]% by 2033.
Dominant Regions, Countries, or Segments in KSA Payment Gateway Market
The Riyadh region currently dominates the KSA payment gateway market, accounting for [xx]% of the total market share in 2024, followed by Jeddah ([xx]%) and Dammam ([xx]%). This dominance is fueled by higher levels of internet penetration, digital literacy, and concentration of businesses and consumers in these urban centers. The e-commerce segment within the payment gateway market shows the highest growth potential due to expanding online retail sales. Key drivers contributing to this regional dominance include supportive government policies focused on digital infrastructure development, and a relatively high level of internet and smartphone penetration.
- Riyadh: High internet penetration, business concentration, strong digital infrastructure.
- Jeddah: Major commercial hub, significant e-commerce activity.
- Dammam: Growing digital economy, significant consumer base.
- E-commerce Segment: Fastest-growing segment due to rapid online retail expansion.
KSA Payment Gateway Market Product Landscape
The KSA payment gateway market offers a diverse range of products, including integrated payment solutions, mobile payment gateways, and specialized industry-specific solutions. Recent innovations focus on enhanced security features, seamless user experiences, and advanced analytics capabilities. Many providers offer customizable solutions to meet diverse merchant needs, including flexible pricing models, multiple payment options, and comprehensive fraud prevention tools. Key features include recurring billing, multi-currency support and advanced reporting and analytics dashboards. The most successful players are those who offer sophisticated security protocols, user-friendly interfaces, and robust customer support.
Key Drivers, Barriers & Challenges in KSA Payment Gateway Market
Key Drivers:
- Increased adoption of e-commerce and digital payments.
- Government initiatives supporting digital transformation (Vision 2030).
- Growing smartphone penetration and internet access.
- Rising demand for secure and convenient payment solutions.
Key Barriers & Challenges:
- Stringent regulatory compliance requirements.
- Concerns about data security and fraud prevention.
- Competition from existing payment methods (e.g., cash).
- Limited digital literacy in certain segments of the population.
- Potential for increased transaction fees impacting the profitability of merchants.
Emerging Opportunities in KSA Payment Gateway Market
- Expansion into underserved markets: Reaching rural areas and smaller businesses.
- Development of innovative payment solutions: BNPL, Crypto payments, etc.
- Integration with emerging technologies: AI, blockchain, IoT.
- Focus on personalized payment experiences: Tailored solutions for different demographics.
Growth Accelerators in the KSA Payment Gateway Market Industry
The KSA payment gateway market's long-term growth is underpinned by several significant factors, including continuous technological advancements in payment security and processing efficiency, strategic partnerships between payment providers and financial institutions, and ongoing government support for the development of a robust digital infrastructure. Expansion into new sectors like healthcare and education, and continued investment in marketing and customer support by payment gateways, will further drive market growth.
Key Players Shaping the KSA Payment Gateway Market Market
- PayPal Holdings Inc
- Amazon Pay
- MasterCard
- GooglePay
- STC Pay
- Akurateco
- Telr Saudi Arabia
- PayTabs
- Hyper Pay
- Moyasar Financial Company
Notable Milestones in KSA Payment Gateway Market Sector
- September 2024: barq partners with Mastercard to enhance payment acceptance solutions.
- February 2024: Mastercard collaborates with Loop to expand credit card offerings.
In-Depth KSA Payment Gateway Market Outlook
The KSA payment gateway market is poised for sustained growth over the next decade, driven by the ongoing digital transformation and increasing adoption of online services. Strategic partnerships, technological innovations, and the expansion of e-commerce are key factors driving future market potential. Companies that successfully adapt to evolving consumer preferences and regulatory changes will be well-positioned to capture significant market share. The long-term outlook remains optimistic, with significant opportunities for growth and innovation within the KSA payment gateway sector.
KSA Payment Gateway Market Segmentation
-
1. Type
- 1.1. Hosted
- 1.2. Non-hosted
-
2. Enterprise
- 2.1. Small and Medium Enterprise (SME)
- 2.2. Large Enterprise
-
3. End User
- 3.1. Travel
- 3.2. Retail
- 3.3. BFSI
- 3.4. Media and Entertainment
- 3.5. Other End Users
KSA Payment Gateway Market Segmentation By Geography
-
1. North America
- 1.1. United States
- 1.2. Canada
- 1.3. Mexico
-
2. South America
- 2.1. Brazil
- 2.2. Argentina
- 2.3. Rest of South America
-
3. Europe
- 3.1. United Kingdom
- 3.2. Germany
- 3.3. France
- 3.4. Italy
- 3.5. Spain
- 3.6. Russia
- 3.7. Benelux
- 3.8. Nordics
- 3.9. Rest of Europe
-
4. Middle East & Africa
- 4.1. Turkey
- 4.2. Israel
- 4.3. GCC
- 4.4. North Africa
- 4.5. South Africa
- 4.6. Rest of Middle East & Africa
-
5. Asia Pacific
- 5.1. China
- 5.2. India
- 5.3. Japan
- 5.4. South Korea
- 5.5. ASEAN
- 5.6. Oceania
- 5.7. Rest of Asia Pacific
KSA Payment Gateway Market REPORT HIGHLIGHTS
| Aspects | Details |
|---|---|
| Study Period | 2019-2033 |
| Base Year | 2024 |
| Estimated Year | 2025 |
| Forecast Period | 2025-2033 |
| Historical Period | 2019-2024 |
| Growth Rate | CAGR of 19.03% from 2019-2033 |
| Segmentation |
|
Table of Contents
- 1. Introduction
- 1.1. Research Scope
- 1.2. Market Segmentation
- 1.3. Research Methodology
- 1.4. Definitions and Assumptions
- 2. Executive Summary
- 2.1. Introduction
- 3. Market Dynamics
- 3.1. Introduction
- 3.2. Market Drivers
- 3.2.1. Increased E-commerce Sales and High Internet Penetration Rate; Increased Demand for Mobile-based Payments; Growing Adoption of Payment Gateways in Retail
- 3.3. Market Restrains
- 3.3.1. Increased E-commerce Sales and High Internet Penetration Rate; Increased Demand for Mobile-based Payments; Growing Adoption of Payment Gateways in Retail
- 3.4. Market Trends
- 3.4.1. Increased E-commerce Sales and High Internet Penetration Rate
- 4. Market Factor Analysis
- 4.1. Porters Five Forces
- 4.2. Supply/Value Chain
- 4.3. PESTEL analysis
- 4.4. Market Entropy
- 4.5. Patent/Trademark Analysis
- 5. Global KSA Payment Gateway Market Analysis, Insights and Forecast, 2019-2031
- 5.1. Market Analysis, Insights and Forecast - by Type
- 5.1.1. Hosted
- 5.1.2. Non-hosted
- 5.2. Market Analysis, Insights and Forecast - by Enterprise
- 5.2.1. Small and Medium Enterprise (SME)
- 5.2.2. Large Enterprise
- 5.3. Market Analysis, Insights and Forecast - by End User
- 5.3.1. Travel
- 5.3.2. Retail
- 5.3.3. BFSI
- 5.3.4. Media and Entertainment
- 5.3.5. Other End Users
- 5.4. Market Analysis, Insights and Forecast - by Region
- 5.4.1. North America
- 5.4.2. South America
- 5.4.3. Europe
- 5.4.4. Middle East & Africa
- 5.4.5. Asia Pacific
- 5.1. Market Analysis, Insights and Forecast - by Type
- 6. North America KSA Payment Gateway Market Analysis, Insights and Forecast, 2019-2031
- 6.1. Market Analysis, Insights and Forecast - by Type
- 6.1.1. Hosted
- 6.1.2. Non-hosted
- 6.2. Market Analysis, Insights and Forecast - by Enterprise
- 6.2.1. Small and Medium Enterprise (SME)
- 6.2.2. Large Enterprise
- 6.3. Market Analysis, Insights and Forecast - by End User
- 6.3.1. Travel
- 6.3.2. Retail
- 6.3.3. BFSI
- 6.3.4. Media and Entertainment
- 6.3.5. Other End Users
- 6.1. Market Analysis, Insights and Forecast - by Type
- 7. South America KSA Payment Gateway Market Analysis, Insights and Forecast, 2019-2031
- 7.1. Market Analysis, Insights and Forecast - by Type
- 7.1.1. Hosted
- 7.1.2. Non-hosted
- 7.2. Market Analysis, Insights and Forecast - by Enterprise
- 7.2.1. Small and Medium Enterprise (SME)
- 7.2.2. Large Enterprise
- 7.3. Market Analysis, Insights and Forecast - by End User
- 7.3.1. Travel
- 7.3.2. Retail
- 7.3.3. BFSI
- 7.3.4. Media and Entertainment
- 7.3.5. Other End Users
- 7.1. Market Analysis, Insights and Forecast - by Type
- 8. Europe KSA Payment Gateway Market Analysis, Insights and Forecast, 2019-2031
- 8.1. Market Analysis, Insights and Forecast - by Type
- 8.1.1. Hosted
- 8.1.2. Non-hosted
- 8.2. Market Analysis, Insights and Forecast - by Enterprise
- 8.2.1. Small and Medium Enterprise (SME)
- 8.2.2. Large Enterprise
- 8.3. Market Analysis, Insights and Forecast - by End User
- 8.3.1. Travel
- 8.3.2. Retail
- 8.3.3. BFSI
- 8.3.4. Media and Entertainment
- 8.3.5. Other End Users
- 8.1. Market Analysis, Insights and Forecast - by Type
- 9. Middle East & Africa KSA Payment Gateway Market Analysis, Insights and Forecast, 2019-2031
- 9.1. Market Analysis, Insights and Forecast - by Type
- 9.1.1. Hosted
- 9.1.2. Non-hosted
- 9.2. Market Analysis, Insights and Forecast - by Enterprise
- 9.2.1. Small and Medium Enterprise (SME)
- 9.2.2. Large Enterprise
- 9.3. Market Analysis, Insights and Forecast - by End User
- 9.3.1. Travel
- 9.3.2. Retail
- 9.3.3. BFSI
- 9.3.4. Media and Entertainment
- 9.3.5. Other End Users
- 9.1. Market Analysis, Insights and Forecast - by Type
- 10. Asia Pacific KSA Payment Gateway Market Analysis, Insights and Forecast, 2019-2031
- 10.1. Market Analysis, Insights and Forecast - by Type
- 10.1.1. Hosted
- 10.1.2. Non-hosted
- 10.2. Market Analysis, Insights and Forecast - by Enterprise
- 10.2.1. Small and Medium Enterprise (SME)
- 10.2.2. Large Enterprise
- 10.3. Market Analysis, Insights and Forecast - by End User
- 10.3.1. Travel
- 10.3.2. Retail
- 10.3.3. BFSI
- 10.3.4. Media and Entertainment
- 10.3.5. Other End Users
- 10.1. Market Analysis, Insights and Forecast - by Type
- 11. Competitive Analysis
- 11.1. Global Market Share Analysis 2024
- 11.2. Company Profiles
- 11.2.1 PayPal Holdings Inc
- 11.2.1.1. Overview
- 11.2.1.2. Products
- 11.2.1.3. SWOT Analysis
- 11.2.1.4. Recent Developments
- 11.2.1.5. Financials (Based on Availability)
- 11.2.2 Amazon Pay
- 11.2.2.1. Overview
- 11.2.2.2. Products
- 11.2.2.3. SWOT Analysis
- 11.2.2.4. Recent Developments
- 11.2.2.5. Financials (Based on Availability)
- 11.2.3 MasterCard
- 11.2.3.1. Overview
- 11.2.3.2. Products
- 11.2.3.3. SWOT Analysis
- 11.2.3.4. Recent Developments
- 11.2.3.5. Financials (Based on Availability)
- 11.2.4 GooglePay
- 11.2.4.1. Overview
- 11.2.4.2. Products
- 11.2.4.3. SWOT Analysis
- 11.2.4.4. Recent Developments
- 11.2.4.5. Financials (Based on Availability)
- 11.2.5 STC Pay
- 11.2.5.1. Overview
- 11.2.5.2. Products
- 11.2.5.3. SWOT Analysis
- 11.2.5.4. Recent Developments
- 11.2.5.5. Financials (Based on Availability)
- 11.2.6 Akurateco
- 11.2.6.1. Overview
- 11.2.6.2. Products
- 11.2.6.3. SWOT Analysis
- 11.2.6.4. Recent Developments
- 11.2.6.5. Financials (Based on Availability)
- 11.2.7 Telr Saudi Arabia
- 11.2.7.1. Overview
- 11.2.7.2. Products
- 11.2.7.3. SWOT Analysis
- 11.2.7.4. Recent Developments
- 11.2.7.5. Financials (Based on Availability)
- 11.2.8 PayTabs
- 11.2.8.1. Overview
- 11.2.8.2. Products
- 11.2.8.3. SWOT Analysis
- 11.2.8.4. Recent Developments
- 11.2.8.5. Financials (Based on Availability)
- 11.2.9 Hyper Pay
- 11.2.9.1. Overview
- 11.2.9.2. Products
- 11.2.9.3. SWOT Analysis
- 11.2.9.4. Recent Developments
- 11.2.9.5. Financials (Based on Availability)
- 11.2.10 Moyasar Financial Company*List Not Exhaustive
- 11.2.10.1. Overview
- 11.2.10.2. Products
- 11.2.10.3. SWOT Analysis
- 11.2.10.4. Recent Developments
- 11.2.10.5. Financials (Based on Availability)
- 11.2.1 PayPal Holdings Inc
List of Figures
- Figure 1: Global KSA Payment Gateway Market Revenue Breakdown (Million, %) by Region 2024 & 2032
- Figure 2: Global KSA Payment Gateway Market Volume Breakdown (Billion, %) by Region 2024 & 2032
- Figure 3: North America KSA Payment Gateway Market Revenue (Million), by Type 2024 & 2032
- Figure 4: North America KSA Payment Gateway Market Volume (Billion), by Type 2024 & 2032
- Figure 5: North America KSA Payment Gateway Market Revenue Share (%), by Type 2024 & 2032
- Figure 6: North America KSA Payment Gateway Market Volume Share (%), by Type 2024 & 2032
- Figure 7: North America KSA Payment Gateway Market Revenue (Million), by Enterprise 2024 & 2032
- Figure 8: North America KSA Payment Gateway Market Volume (Billion), by Enterprise 2024 & 2032
- Figure 9: North America KSA Payment Gateway Market Revenue Share (%), by Enterprise 2024 & 2032
- Figure 10: North America KSA Payment Gateway Market Volume Share (%), by Enterprise 2024 & 2032
- Figure 11: North America KSA Payment Gateway Market Revenue (Million), by End User 2024 & 2032
- Figure 12: North America KSA Payment Gateway Market Volume (Billion), by End User 2024 & 2032
- Figure 13: North America KSA Payment Gateway Market Revenue Share (%), by End User 2024 & 2032
- Figure 14: North America KSA Payment Gateway Market Volume Share (%), by End User 2024 & 2032
- Figure 15: North America KSA Payment Gateway Market Revenue (Million), by Country 2024 & 2032
- Figure 16: North America KSA Payment Gateway Market Volume (Billion), by Country 2024 & 2032
- Figure 17: North America KSA Payment Gateway Market Revenue Share (%), by Country 2024 & 2032
- Figure 18: North America KSA Payment Gateway Market Volume Share (%), by Country 2024 & 2032
- Figure 19: South America KSA Payment Gateway Market Revenue (Million), by Type 2024 & 2032
- Figure 20: South America KSA Payment Gateway Market Volume (Billion), by Type 2024 & 2032
- Figure 21: South America KSA Payment Gateway Market Revenue Share (%), by Type 2024 & 2032
- Figure 22: South America KSA Payment Gateway Market Volume Share (%), by Type 2024 & 2032
- Figure 23: South America KSA Payment Gateway Market Revenue (Million), by Enterprise 2024 & 2032
- Figure 24: South America KSA Payment Gateway Market Volume (Billion), by Enterprise 2024 & 2032
- Figure 25: South America KSA Payment Gateway Market Revenue Share (%), by Enterprise 2024 & 2032
- Figure 26: South America KSA Payment Gateway Market Volume Share (%), by Enterprise 2024 & 2032
- Figure 27: South America KSA Payment Gateway Market Revenue (Million), by End User 2024 & 2032
- Figure 28: South America KSA Payment Gateway Market Volume (Billion), by End User 2024 & 2032
- Figure 29: South America KSA Payment Gateway Market Revenue Share (%), by End User 2024 & 2032
- Figure 30: South America KSA Payment Gateway Market Volume Share (%), by End User 2024 & 2032
- Figure 31: South America KSA Payment Gateway Market Revenue (Million), by Country 2024 & 2032
- Figure 32: South America KSA Payment Gateway Market Volume (Billion), by Country 2024 & 2032
- Figure 33: South America KSA Payment Gateway Market Revenue Share (%), by Country 2024 & 2032
- Figure 34: South America KSA Payment Gateway Market Volume Share (%), by Country 2024 & 2032
- Figure 35: Europe KSA Payment Gateway Market Revenue (Million), by Type 2024 & 2032
- Figure 36: Europe KSA Payment Gateway Market Volume (Billion), by Type 2024 & 2032
- Figure 37: Europe KSA Payment Gateway Market Revenue Share (%), by Type 2024 & 2032
- Figure 38: Europe KSA Payment Gateway Market Volume Share (%), by Type 2024 & 2032
- Figure 39: Europe KSA Payment Gateway Market Revenue (Million), by Enterprise 2024 & 2032
- Figure 40: Europe KSA Payment Gateway Market Volume (Billion), by Enterprise 2024 & 2032
- Figure 41: Europe KSA Payment Gateway Market Revenue Share (%), by Enterprise 2024 & 2032
- Figure 42: Europe KSA Payment Gateway Market Volume Share (%), by Enterprise 2024 & 2032
- Figure 43: Europe KSA Payment Gateway Market Revenue (Million), by End User 2024 & 2032
- Figure 44: Europe KSA Payment Gateway Market Volume (Billion), by End User 2024 & 2032
- Figure 45: Europe KSA Payment Gateway Market Revenue Share (%), by End User 2024 & 2032
- Figure 46: Europe KSA Payment Gateway Market Volume Share (%), by End User 2024 & 2032
- Figure 47: Europe KSA Payment Gateway Market Revenue (Million), by Country 2024 & 2032
- Figure 48: Europe KSA Payment Gateway Market Volume (Billion), by Country 2024 & 2032
- Figure 49: Europe KSA Payment Gateway Market Revenue Share (%), by Country 2024 & 2032
- Figure 50: Europe KSA Payment Gateway Market Volume Share (%), by Country 2024 & 2032
- Figure 51: Middle East & Africa KSA Payment Gateway Market Revenue (Million), by Type 2024 & 2032
- Figure 52: Middle East & Africa KSA Payment Gateway Market Volume (Billion), by Type 2024 & 2032
- Figure 53: Middle East & Africa KSA Payment Gateway Market Revenue Share (%), by Type 2024 & 2032
- Figure 54: Middle East & Africa KSA Payment Gateway Market Volume Share (%), by Type 2024 & 2032
- Figure 55: Middle East & Africa KSA Payment Gateway Market Revenue (Million), by Enterprise 2024 & 2032
- Figure 56: Middle East & Africa KSA Payment Gateway Market Volume (Billion), by Enterprise 2024 & 2032
- Figure 57: Middle East & Africa KSA Payment Gateway Market Revenue Share (%), by Enterprise 2024 & 2032
- Figure 58: Middle East & Africa KSA Payment Gateway Market Volume Share (%), by Enterprise 2024 & 2032
- Figure 59: Middle East & Africa KSA Payment Gateway Market Revenue (Million), by End User 2024 & 2032
- Figure 60: Middle East & Africa KSA Payment Gateway Market Volume (Billion), by End User 2024 & 2032
- Figure 61: Middle East & Africa KSA Payment Gateway Market Revenue Share (%), by End User 2024 & 2032
- Figure 62: Middle East & Africa KSA Payment Gateway Market Volume Share (%), by End User 2024 & 2032
- Figure 63: Middle East & Africa KSA Payment Gateway Market Revenue (Million), by Country 2024 & 2032
- Figure 64: Middle East & Africa KSA Payment Gateway Market Volume (Billion), by Country 2024 & 2032
- Figure 65: Middle East & Africa KSA Payment Gateway Market Revenue Share (%), by Country 2024 & 2032
- Figure 66: Middle East & Africa KSA Payment Gateway Market Volume Share (%), by Country 2024 & 2032
- Figure 67: Asia Pacific KSA Payment Gateway Market Revenue (Million), by Type 2024 & 2032
- Figure 68: Asia Pacific KSA Payment Gateway Market Volume (Billion), by Type 2024 & 2032
- Figure 69: Asia Pacific KSA Payment Gateway Market Revenue Share (%), by Type 2024 & 2032
- Figure 70: Asia Pacific KSA Payment Gateway Market Volume Share (%), by Type 2024 & 2032
- Figure 71: Asia Pacific KSA Payment Gateway Market Revenue (Million), by Enterprise 2024 & 2032
- Figure 72: Asia Pacific KSA Payment Gateway Market Volume (Billion), by Enterprise 2024 & 2032
- Figure 73: Asia Pacific KSA Payment Gateway Market Revenue Share (%), by Enterprise 2024 & 2032
- Figure 74: Asia Pacific KSA Payment Gateway Market Volume Share (%), by Enterprise 2024 & 2032
- Figure 75: Asia Pacific KSA Payment Gateway Market Revenue (Million), by End User 2024 & 2032
- Figure 76: Asia Pacific KSA Payment Gateway Market Volume (Billion), by End User 2024 & 2032
- Figure 77: Asia Pacific KSA Payment Gateway Market Revenue Share (%), by End User 2024 & 2032
- Figure 78: Asia Pacific KSA Payment Gateway Market Volume Share (%), by End User 2024 & 2032
- Figure 79: Asia Pacific KSA Payment Gateway Market Revenue (Million), by Country 2024 & 2032
- Figure 80: Asia Pacific KSA Payment Gateway Market Volume (Billion), by Country 2024 & 2032
- Figure 81: Asia Pacific KSA Payment Gateway Market Revenue Share (%), by Country 2024 & 2032
- Figure 82: Asia Pacific KSA Payment Gateway Market Volume Share (%), by Country 2024 & 2032
List of Tables
- Table 1: Global KSA Payment Gateway Market Revenue Million Forecast, by Region 2019 & 2032
- Table 2: Global KSA Payment Gateway Market Volume Billion Forecast, by Region 2019 & 2032
- Table 3: Global KSA Payment Gateway Market Revenue Million Forecast, by Type 2019 & 2032
- Table 4: Global KSA Payment Gateway Market Volume Billion Forecast, by Type 2019 & 2032
- Table 5: Global KSA Payment Gateway Market Revenue Million Forecast, by Enterprise 2019 & 2032
- Table 6: Global KSA Payment Gateway Market Volume Billion Forecast, by Enterprise 2019 & 2032
- Table 7: Global KSA Payment Gateway Market Revenue Million Forecast, by End User 2019 & 2032
- Table 8: Global KSA Payment Gateway Market Volume Billion Forecast, by End User 2019 & 2032
- Table 9: Global KSA Payment Gateway Market Revenue Million Forecast, by Region 2019 & 2032
- Table 10: Global KSA Payment Gateway Market Volume Billion Forecast, by Region 2019 & 2032
- Table 11: Global KSA Payment Gateway Market Revenue Million Forecast, by Type 2019 & 2032
- Table 12: Global KSA Payment Gateway Market Volume Billion Forecast, by Type 2019 & 2032
- Table 13: Global KSA Payment Gateway Market Revenue Million Forecast, by Enterprise 2019 & 2032
- Table 14: Global KSA Payment Gateway Market Volume Billion Forecast, by Enterprise 2019 & 2032
- Table 15: Global KSA Payment Gateway Market Revenue Million Forecast, by End User 2019 & 2032
- Table 16: Global KSA Payment Gateway Market Volume Billion Forecast, by End User 2019 & 2032
- Table 17: Global KSA Payment Gateway Market Revenue Million Forecast, by Country 2019 & 2032
- Table 18: Global KSA Payment Gateway Market Volume Billion Forecast, by Country 2019 & 2032
- Table 19: United States KSA Payment Gateway Market Revenue (Million) Forecast, by Application 2019 & 2032
- Table 20: United States KSA Payment Gateway Market Volume (Billion) Forecast, by Application 2019 & 2032
- Table 21: Canada KSA Payment Gateway Market Revenue (Million) Forecast, by Application 2019 & 2032
- Table 22: Canada KSA Payment Gateway Market Volume (Billion) Forecast, by Application 2019 & 2032
- Table 23: Mexico KSA Payment Gateway Market Revenue (Million) Forecast, by Application 2019 & 2032
- Table 24: Mexico KSA Payment Gateway Market Volume (Billion) Forecast, by Application 2019 & 2032
- Table 25: Global KSA Payment Gateway Market Revenue Million Forecast, by Type 2019 & 2032
- Table 26: Global KSA Payment Gateway Market Volume Billion Forecast, by Type 2019 & 2032
- Table 27: Global KSA Payment Gateway Market Revenue Million Forecast, by Enterprise 2019 & 2032
- Table 28: Global KSA Payment Gateway Market Volume Billion Forecast, by Enterprise 2019 & 2032
- Table 29: Global KSA Payment Gateway Market Revenue Million Forecast, by End User 2019 & 2032
- Table 30: Global KSA Payment Gateway Market Volume Billion Forecast, by End User 2019 & 2032
- Table 31: Global KSA Payment Gateway Market Revenue Million Forecast, by Country 2019 & 2032
- Table 32: Global KSA Payment Gateway Market Volume Billion Forecast, by Country 2019 & 2032
- Table 33: Brazil KSA Payment Gateway Market Revenue (Million) Forecast, by Application 2019 & 2032
- Table 34: Brazil KSA Payment Gateway Market Volume (Billion) Forecast, by Application 2019 & 2032
- Table 35: Argentina KSA Payment Gateway Market Revenue (Million) Forecast, by Application 2019 & 2032
- Table 36: Argentina KSA Payment Gateway Market Volume (Billion) Forecast, by Application 2019 & 2032
- Table 37: Rest of South America KSA Payment Gateway Market Revenue (Million) Forecast, by Application 2019 & 2032
- Table 38: Rest of South America KSA Payment Gateway Market Volume (Billion) Forecast, by Application 2019 & 2032
- Table 39: Global KSA Payment Gateway Market Revenue Million Forecast, by Type 2019 & 2032
- Table 40: Global KSA Payment Gateway Market Volume Billion Forecast, by Type 2019 & 2032
- Table 41: Global KSA Payment Gateway Market Revenue Million Forecast, by Enterprise 2019 & 2032
- Table 42: Global KSA Payment Gateway Market Volume Billion Forecast, by Enterprise 2019 & 2032
- Table 43: Global KSA Payment Gateway Market Revenue Million Forecast, by End User 2019 & 2032
- Table 44: Global KSA Payment Gateway Market Volume Billion Forecast, by End User 2019 & 2032
- Table 45: Global KSA Payment Gateway Market Revenue Million Forecast, by Country 2019 & 2032
- Table 46: Global KSA Payment Gateway Market Volume Billion Forecast, by Country 2019 & 2032
- Table 47: United Kingdom KSA Payment Gateway Market Revenue (Million) Forecast, by Application 2019 & 2032
- Table 48: United Kingdom KSA Payment Gateway Market Volume (Billion) Forecast, by Application 2019 & 2032
- Table 49: Germany KSA Payment Gateway Market Revenue (Million) Forecast, by Application 2019 & 2032
- Table 50: Germany KSA Payment Gateway Market Volume (Billion) Forecast, by Application 2019 & 2032
- Table 51: France KSA Payment Gateway Market Revenue (Million) Forecast, by Application 2019 & 2032
- Table 52: France KSA Payment Gateway Market Volume (Billion) Forecast, by Application 2019 & 2032
- Table 53: Italy KSA Payment Gateway Market Revenue (Million) Forecast, by Application 2019 & 2032
- Table 54: Italy KSA Payment Gateway Market Volume (Billion) Forecast, by Application 2019 & 2032
- Table 55: Spain KSA Payment Gateway Market Revenue (Million) Forecast, by Application 2019 & 2032
- Table 56: Spain KSA Payment Gateway Market Volume (Billion) Forecast, by Application 2019 & 2032
- Table 57: Russia KSA Payment Gateway Market Revenue (Million) Forecast, by Application 2019 & 2032
- Table 58: Russia KSA Payment Gateway Market Volume (Billion) Forecast, by Application 2019 & 2032
- Table 59: Benelux KSA Payment Gateway Market Revenue (Million) Forecast, by Application 2019 & 2032
- Table 60: Benelux KSA Payment Gateway Market Volume (Billion) Forecast, by Application 2019 & 2032
- Table 61: Nordics KSA Payment Gateway Market Revenue (Million) Forecast, by Application 2019 & 2032
- Table 62: Nordics KSA Payment Gateway Market Volume (Billion) Forecast, by Application 2019 & 2032
- Table 63: Rest of Europe KSA Payment Gateway Market Revenue (Million) Forecast, by Application 2019 & 2032
- Table 64: Rest of Europe KSA Payment Gateway Market Volume (Billion) Forecast, by Application 2019 & 2032
- Table 65: Global KSA Payment Gateway Market Revenue Million Forecast, by Type 2019 & 2032
- Table 66: Global KSA Payment Gateway Market Volume Billion Forecast, by Type 2019 & 2032
- Table 67: Global KSA Payment Gateway Market Revenue Million Forecast, by Enterprise 2019 & 2032
- Table 68: Global KSA Payment Gateway Market Volume Billion Forecast, by Enterprise 2019 & 2032
- Table 69: Global KSA Payment Gateway Market Revenue Million Forecast, by End User 2019 & 2032
- Table 70: Global KSA Payment Gateway Market Volume Billion Forecast, by End User 2019 & 2032
- Table 71: Global KSA Payment Gateway Market Revenue Million Forecast, by Country 2019 & 2032
- Table 72: Global KSA Payment Gateway Market Volume Billion Forecast, by Country 2019 & 2032
- Table 73: Turkey KSA Payment Gateway Market Revenue (Million) Forecast, by Application 2019 & 2032
- Table 74: Turkey KSA Payment Gateway Market Volume (Billion) Forecast, by Application 2019 & 2032
- Table 75: Israel KSA Payment Gateway Market Revenue (Million) Forecast, by Application 2019 & 2032
- Table 76: Israel KSA Payment Gateway Market Volume (Billion) Forecast, by Application 2019 & 2032
- Table 77: GCC KSA Payment Gateway Market Revenue (Million) Forecast, by Application 2019 & 2032
- Table 78: GCC KSA Payment Gateway Market Volume (Billion) Forecast, by Application 2019 & 2032
- Table 79: North Africa KSA Payment Gateway Market Revenue (Million) Forecast, by Application 2019 & 2032
- Table 80: North Africa KSA Payment Gateway Market Volume (Billion) Forecast, by Application 2019 & 2032
- Table 81: South Africa KSA Payment Gateway Market Revenue (Million) Forecast, by Application 2019 & 2032
- Table 82: South Africa KSA Payment Gateway Market Volume (Billion) Forecast, by Application 2019 & 2032
- Table 83: Rest of Middle East & Africa KSA Payment Gateway Market Revenue (Million) Forecast, by Application 2019 & 2032
- Table 84: Rest of Middle East & Africa KSA Payment Gateway Market Volume (Billion) Forecast, by Application 2019 & 2032
- Table 85: Global KSA Payment Gateway Market Revenue Million Forecast, by Type 2019 & 2032
- Table 86: Global KSA Payment Gateway Market Volume Billion Forecast, by Type 2019 & 2032
- Table 87: Global KSA Payment Gateway Market Revenue Million Forecast, by Enterprise 2019 & 2032
- Table 88: Global KSA Payment Gateway Market Volume Billion Forecast, by Enterprise 2019 & 2032
- Table 89: Global KSA Payment Gateway Market Revenue Million Forecast, by End User 2019 & 2032
- Table 90: Global KSA Payment Gateway Market Volume Billion Forecast, by End User 2019 & 2032
- Table 91: Global KSA Payment Gateway Market Revenue Million Forecast, by Country 2019 & 2032
- Table 92: Global KSA Payment Gateway Market Volume Billion Forecast, by Country 2019 & 2032
- Table 93: China KSA Payment Gateway Market Revenue (Million) Forecast, by Application 2019 & 2032
- Table 94: China KSA Payment Gateway Market Volume (Billion) Forecast, by Application 2019 & 2032
- Table 95: India KSA Payment Gateway Market Revenue (Million) Forecast, by Application 2019 & 2032
- Table 96: India KSA Payment Gateway Market Volume (Billion) Forecast, by Application 2019 & 2032
- Table 97: Japan KSA Payment Gateway Market Revenue (Million) Forecast, by Application 2019 & 2032
- Table 98: Japan KSA Payment Gateway Market Volume (Billion) Forecast, by Application 2019 & 2032
- Table 99: South Korea KSA Payment Gateway Market Revenue (Million) Forecast, by Application 2019 & 2032
- Table 100: South Korea KSA Payment Gateway Market Volume (Billion) Forecast, by Application 2019 & 2032
- Table 101: ASEAN KSA Payment Gateway Market Revenue (Million) Forecast, by Application 2019 & 2032
- Table 102: ASEAN KSA Payment Gateway Market Volume (Billion) Forecast, by Application 2019 & 2032
- Table 103: Oceania KSA Payment Gateway Market Revenue (Million) Forecast, by Application 2019 & 2032
- Table 104: Oceania KSA Payment Gateway Market Volume (Billion) Forecast, by Application 2019 & 2032
- Table 105: Rest of Asia Pacific KSA Payment Gateway Market Revenue (Million) Forecast, by Application 2019 & 2032
- Table 106: Rest of Asia Pacific KSA Payment Gateway Market Volume (Billion) Forecast, by Application 2019 & 2032
Frequently Asked Questions
1. What is the projected Compound Annual Growth Rate (CAGR) of the KSA Payment Gateway Market?
The projected CAGR is approximately 19.03%.
2. Which companies are prominent players in the KSA Payment Gateway Market?
Key companies in the market include PayPal Holdings Inc, Amazon Pay, MasterCard, GooglePay, STC Pay, Akurateco, Telr Saudi Arabia, PayTabs, Hyper Pay, Moyasar Financial Company*List Not Exhaustive.
3. What are the main segments of the KSA Payment Gateway Market?
The market segments include Type, Enterprise, End User.
4. Can you provide details about the market size?
The market size is estimated to be USD 1.36 Million as of 2022.
5. What are some drivers contributing to market growth?
Increased E-commerce Sales and High Internet Penetration Rate; Increased Demand for Mobile-based Payments; Growing Adoption of Payment Gateways in Retail.
6. What are the notable trends driving market growth?
Increased E-commerce Sales and High Internet Penetration Rate.
7. Are there any restraints impacting market growth?
Increased E-commerce Sales and High Internet Penetration Rate; Increased Demand for Mobile-based Payments; Growing Adoption of Payment Gateways in Retail.
8. Can you provide examples of recent developments in the market?
September 2024: barq, a financial services startup from Saudi Arabia, joined forces with Mastercard. This collaboration aims to provide barq's customers with top-tier payment acceptance solutions via the Mastercard Gateway. Through this strategic partnership, barq will harness the technology of Mastercard Gateway, enhancing its offerings to merchants and consumers across the Kingdom.February 2024: Mastercard teamed up with Loop, a digital payments technology firm licensed by SAMA, to provide businesses and consumers in the Kingdom with enhanced access to advanced credit card offerings and innovative payment solutions. Through this collaboration, Loop will broaden its portfolio and elevate its range of products and services by harnessing Mastercard's technology and expertise.
9. What pricing options are available for accessing the report?
Pricing options include single-user, multi-user, and enterprise licenses priced at USD 3800, USD 4500, and USD 5800 respectively.
10. Is the market size provided in terms of value or volume?
The market size is provided in terms of value, measured in Million and volume, measured in Billion.
11. Are there any specific market keywords associated with the report?
Yes, the market keyword associated with the report is "KSA Payment Gateway Market," which aids in identifying and referencing the specific market segment covered.
12. How do I determine which pricing option suits my needs best?
The pricing options vary based on user requirements and access needs. Individual users may opt for single-user licenses, while businesses requiring broader access may choose multi-user or enterprise licenses for cost-effective access to the report.
13. Are there any additional resources or data provided in the KSA Payment Gateway Market report?
While the report offers comprehensive insights, it's advisable to review the specific contents or supplementary materials provided to ascertain if additional resources or data are available.
14. How can I stay updated on further developments or reports in the KSA Payment Gateway Market?
To stay informed about further developments, trends, and reports in the KSA Payment Gateway Market, consider subscribing to industry newsletters, following relevant companies and organizations, or regularly checking reputable industry news sources and publications.
Methodology
Step 1 - Identification of Relevant Samples Size from Population Database


Step 2 - Approaches for Defining Global Market Size (Value, Volume* & Price*)

Note*: In applicable scenarios
Step 3 - Data Sources
Primary Research
- Web Analytics
- Survey Reports
- Research Institute
- Latest Research Reports
- Opinion Leaders
Secondary Research
- Annual Reports
- White Paper
- Latest Press Release
- Industry Association
- Paid Database
- Investor Presentations

Step 4 - Data Triangulation
Involves using different sources of information in order to increase the validity of a study
These sources are likely to be stakeholders in a program - participants, other researchers, program staff, other community members, and so on.
Then we put all data in single framework & apply various statistical tools to find out the dynamic on the market.
During the analysis stage, feedback from the stakeholder groups would be compared to determine areas of agreement as well as areas of divergence
