

Key Insights
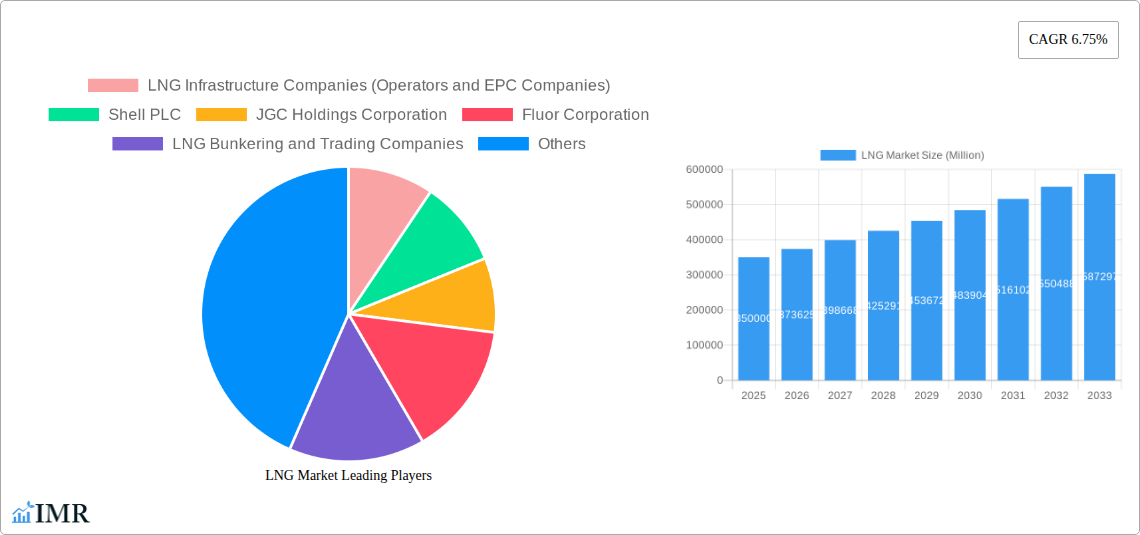
The global LNG market is experiencing robust growth, driven by increasing energy demand, particularly in Asia, and a global shift towards cleaner energy sources. While natural gas remains a transitional fuel in the path to full decarbonization, its lower carbon emissions compared to coal make it a preferred alternative in the near to medium term. The market's Compound Annual Growth Rate (CAGR) of 6.75% from 2019 to 2024 indicates a significant upward trajectory. This growth is fueled by substantial investments in LNG infrastructure, including liquefaction plants, regasification terminals, and specialized shipping fleets. The expansion of these facilities is crucial to meet the rising demand, particularly from emerging economies undergoing rapid industrialization. Major players like Shell, JGC Holdings, and Bechtel are actively shaping this expansion, leveraging their expertise in engineering, procurement, and construction (EPC) to deliver large-scale projects. Competition is fierce, with companies continuously striving for efficiency gains and cost reductions in their operations.
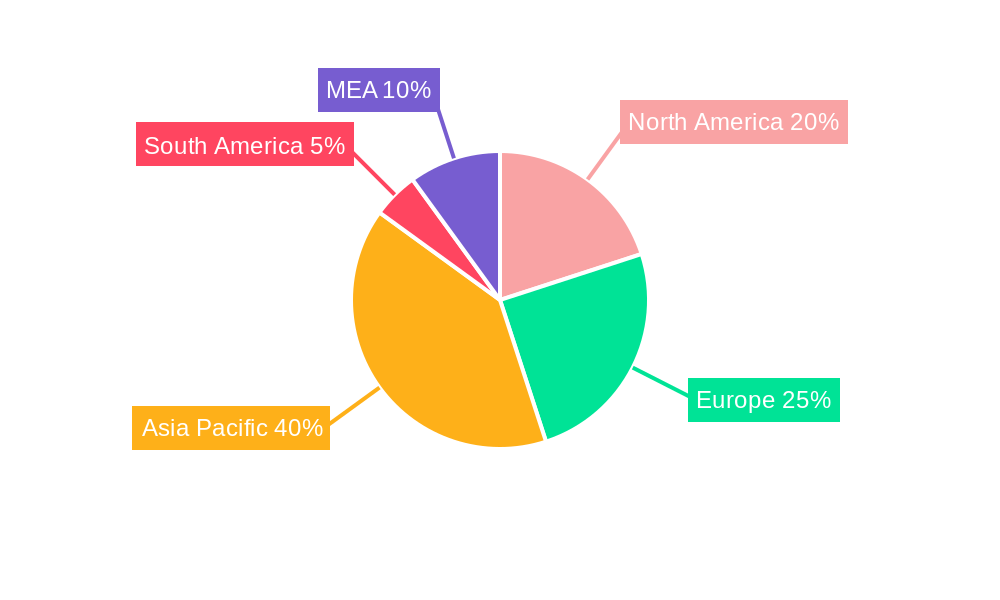
The market segmentation reveals significant opportunities within LNG liquefaction plants, catering to expanding production capacity, and regasification facilities, crucial for importing LNG into consuming regions. LNG shipping, a critical component of the global LNG supply chain, also presents growth opportunities due to the increasing volumes of LNG traded internationally. Geographic growth is uneven, with Asia-Pacific leading the charge due to its energy-intensive industries and burgeoning demand. Europe and North America also contribute substantially, although their growth rates might be comparatively moderated due to existing infrastructure and diversification efforts towards renewable sources. However, geopolitical factors and regulatory policies impacting energy transitions present challenges that need to be considered when evaluating the market's future growth trajectory. Continued investment in infrastructure, innovative technologies, and adaptation to evolving regulations will be crucial for sustained growth in the LNG market.
LNG Market: A Comprehensive Report (2019-2033)
This comprehensive report provides a detailed analysis of the LNG market, encompassing market dynamics, growth trends, regional dominance, product landscape, key players, and future outlook. The study period covers 2019-2033, with 2025 as the base and estimated year. This report is invaluable for industry professionals, investors, and anyone seeking a deep understanding of this dynamic sector. The report examines the parent market of energy and the child market of LNG infrastructure and trading.
LNG Market Dynamics & Structure
This section analyzes the structure and dynamics of the LNG market, encompassing market concentration, technological innovation, regulatory landscapes, competitive substitutes, end-user demographics, and M&A activities. The global LNG market, valued at xx million units in 2025, is characterized by a moderately concentrated structure with several major players holding significant market share.
- Market Concentration: The top 5 players account for approximately xx% of the market share in 2025.
- Technological Innovation: Advancements in liquefaction and regasification technologies, along with the development of LNG bunkering infrastructure, are key drivers. Barriers to innovation include high capital expenditures and stringent regulatory requirements.
- Regulatory Frameworks: Varying regulations across countries impact market access and investment decisions. Harmonization efforts are underway but inconsistencies remain.
- Competitive Substitutes: Natural gas pipelines and other energy sources (e.g., renewables) pose competition. LNG's advantages lie in its transportability and flexibility.
- End-User Demographics: The primary end users are power generation companies, industrial consumers, and residential sectors. Geographic distribution of demand varies significantly.
- M&A Trends: The past five years have seen xx M&A deals in the LNG sector, with a total value of xx million units, driven primarily by consolidation and expansion strategies.
LNG Market Growth Trends & Insights
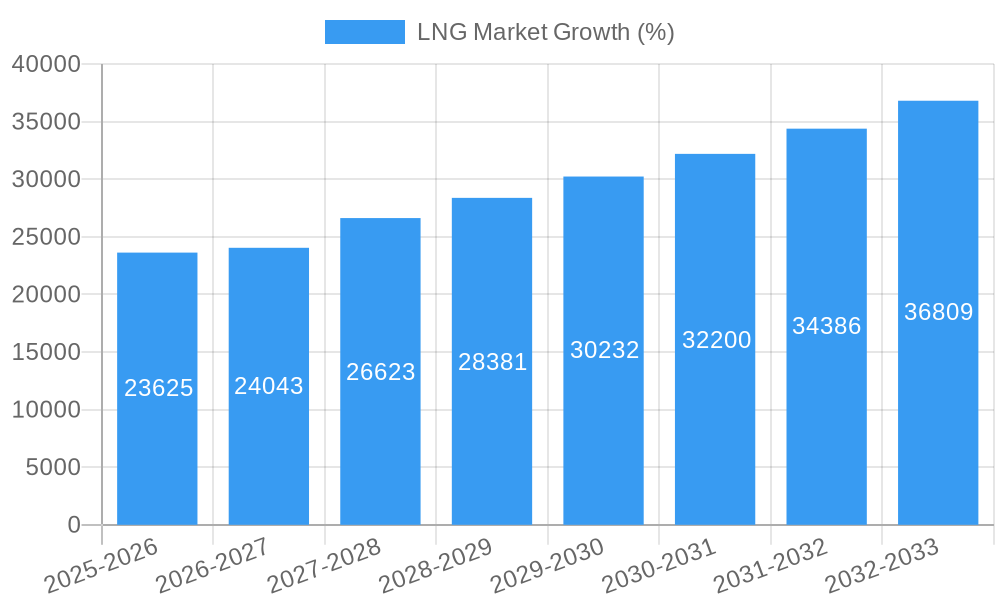
The global LNG market exhibits robust growth, driven by increasing global energy demand, particularly in Asia and emerging economies. The market is projected to expand at a CAGR of xx% from 2025 to 2033, reaching a value of xx million units by 2033. Factors like rising liquefaction capacity, expanding regasification infrastructure, and growth in LNG bunkering contribute to this growth. Technological innovations, such as the development of smaller-scale LNG liquefaction plants, are broadening market access to remote areas. A shift toward cleaner energy sources is also fueling demand for LNG, which is considered a relatively cleaner fossil fuel compared to coal.
Dominant Regions, Countries, or Segments in LNG Market
Asia-Pacific holds the dominant position in the LNG market, accounting for approximately xx% of global consumption in 2025. Strong economic growth in the region, coupled with increasing energy demand and insufficient domestic gas supplies, propels this dominance. North America and Europe follow as major players, with significant regional variations influenced by factors like production capacity, infrastructure development, and government policies.
- LNG Liquefaction Plants: Australia and Qatar are leading exporters, possessing extensive liquefaction facilities.
- LNG Regasification Facilities: Japan, South Korea, and China are among the leading importers, with considerable regasification infrastructure.
- LNG Shipping: Major shipping routes concentrate on Asia-Pacific, North America, and Europe.
Key drivers include:
- Government Policies: Supportive policies, including subsidies and tax incentives, incentivize LNG infrastructure development.
- Infrastructure Investment: Significant investments are driving the expansion of liquefaction, regasification, and shipping infrastructure.
- Economic Growth: Rapid economic expansion in emerging markets fuels energy demand and LNG imports.
LNG Market Product Landscape
The LNG market offers a range of products, including different liquefaction and regasification technologies, varying ship sizes, and specialized LNG bunkering services. Continuous improvements in efficiency, safety, and environmental performance define the product landscape. For example, innovative technologies like floating LNG (FLNG) units offer flexibility and reduce investment costs.
Key Drivers, Barriers & Challenges in LNG Market
Key Drivers: Rising global energy demand, increasing environmental concerns (compared to coal), government support for cleaner energy sources, and technological advancements in liquefaction and transportation are major drivers.
Key Challenges: High initial investment costs, price volatility, geopolitical risks impacting supply chains, and environmental regulations pose significant challenges. Supply chain disruptions can lead to price spikes, potentially impacting market stability. Furthermore, stringent environmental regulations can increase operational costs.
Emerging Opportunities in LNG Market
Small-scale LNG solutions for remote areas, the growing LNG bunkering sector for maritime transport, and potential integration with carbon capture and storage technologies represent significant emerging opportunities. Furthermore, developing markets with high energy demands present lucrative avenues for market expansion.
Growth Accelerators in the LNG Market Industry
Technological innovation, strategic partnerships between producers, shippers, and consumers, and expansion into new markets are accelerating growth. Investments in renewable energy sources along with LNG integration can further boost the sector's sustainability and long-term prospects.
Key Players Shaping the LNG Market Market
- Shell PLC
- JGC Holdings Corporation
- Fluor Corporation
- Bechtel Corporation
- Gazpromneft Marine Bunker LLC
- Gasum AS
- Chiyoda Corporation
- Technip FMC PLC
- ENN Energy Holdings Ltd
- Engie SA
Notable Milestones in LNG Market Sector
- Mar 2023: Sempra Infrastructure Partners LP reached FID for the Port Arthur LNG Phase 1 project. This significantly increases US LNG export capacity.
- Apr 2022: Petronet LNG announced the development of a floating LNG terminal in Odisha and capacity expansion at Dahej. This improves India's LNG import capabilities.
In-Depth LNG Market Market Outlook
The LNG market is poised for continued growth, driven by increasing global energy demand and the transition to cleaner energy sources. Strategic partnerships, technological advancements, and expansion into untapped markets present significant opportunities for companies to capitalize on the market's long-term potential. The focus on sustainable solutions and environmental considerations will shape the sector's future trajectory.
LNG Market Segmentation
-
1. LNG Infrastructure
- 1.1. LNG Liquefaction Plants
- 1.2. LNG Regasification Facilities
- 1.3. LNG Shipping
- 2. LNG Trade
LNG Market Segmentation By Geography
-
1. North America
- 1.1. United States
- 1.2. Canada
- 1.3. Mexico
- 1.4. Rest of the North America
-
2. Europe
- 2.1. Germany
- 2.2. United Kingdom
- 2.3. France
- 2.4. Rest of the Europe
-
3. Asia Pacific
- 3.1. China
- 3.2. South Korea
- 3.3. Japan
- 3.4. Rest of the Asia Pacific
-
4. South America
- 4.1. Brazil
- 4.2. Argentina
- 4.3. Rest of the South America
-
5. Middle East and Africa
- 5.1. United Arab Emirates
- 5.2. Saudi Arabia
- 5.3. Rest of the Middle East and Africa
LNG Market REPORT HIGHLIGHTS
| Aspects | Details |
|---|---|
| Study Period | 2019-2033 |
| Base Year | 2024 |
| Estimated Year | 2025 |
| Forecast Period | 2025-2033 |
| Historical Period | 2019-2024 |
| Growth Rate | CAGR of 6.75% from 2019-2033 |
| Segmentation |
|
Table of Contents
- 1. Introduction
- 1.1. Research Scope
- 1.2. Market Segmentation
- 1.3. Research Methodology
- 1.4. Definitions and Assumptions
- 2. Executive Summary
- 2.1. Introduction
- 3. Market Dynamics
- 3.1. Introduction
- 3.2. Market Drivers
- 3.2.1. 4.; Increasing Investments in Offshore Oil and Gas Projects
- 3.3. Market Restrains
- 3.3.1. 4.; Increasing Penetration of Renewable Energy
- 3.4. Market Trends
- 3.4.1. Liquefaction Sector to Dominate the Market
- 4. Market Factor Analysis
- 4.1. Porters Five Forces
- 4.2. Supply/Value Chain
- 4.3. PESTEL analysis
- 4.4. Market Entropy
- 4.5. Patent/Trademark Analysis
- 5. Global LNG Market Analysis, Insights and Forecast, 2019-2031
- 5.1. Market Analysis, Insights and Forecast - by LNG Infrastructure
- 5.1.1. LNG Liquefaction Plants
- 5.1.2. LNG Regasification Facilities
- 5.1.3. LNG Shipping
- 5.2. Market Analysis, Insights and Forecast - by LNG Trade
- 5.3. Market Analysis, Insights and Forecast - by Region
- 5.3.1. North America
- 5.3.2. Europe
- 5.3.3. Asia Pacific
- 5.3.4. South America
- 5.3.5. Middle East and Africa
- 5.1. Market Analysis, Insights and Forecast - by LNG Infrastructure
- 6. North America LNG Market Analysis, Insights and Forecast, 2019-2031
- 6.1. Market Analysis, Insights and Forecast - by LNG Infrastructure
- 6.1.1. LNG Liquefaction Plants
- 6.1.2. LNG Regasification Facilities
- 6.1.3. LNG Shipping
- 6.2. Market Analysis, Insights and Forecast - by LNG Trade
- 6.1. Market Analysis, Insights and Forecast - by LNG Infrastructure
- 7. Europe LNG Market Analysis, Insights and Forecast, 2019-2031
- 7.1. Market Analysis, Insights and Forecast - by LNG Infrastructure
- 7.1.1. LNG Liquefaction Plants
- 7.1.2. LNG Regasification Facilities
- 7.1.3. LNG Shipping
- 7.2. Market Analysis, Insights and Forecast - by LNG Trade
- 7.1. Market Analysis, Insights and Forecast - by LNG Infrastructure
- 8. Asia Pacific LNG Market Analysis, Insights and Forecast, 2019-2031
- 8.1. Market Analysis, Insights and Forecast - by LNG Infrastructure
- 8.1.1. LNG Liquefaction Plants
- 8.1.2. LNG Regasification Facilities
- 8.1.3. LNG Shipping
- 8.2. Market Analysis, Insights and Forecast - by LNG Trade
- 8.1. Market Analysis, Insights and Forecast - by LNG Infrastructure
- 9. South America LNG Market Analysis, Insights and Forecast, 2019-2031
- 9.1. Market Analysis, Insights and Forecast - by LNG Infrastructure
- 9.1.1. LNG Liquefaction Plants
- 9.1.2. LNG Regasification Facilities
- 9.1.3. LNG Shipping
- 9.2. Market Analysis, Insights and Forecast - by LNG Trade
- 9.1. Market Analysis, Insights and Forecast - by LNG Infrastructure
- 10. Middle East and Africa LNG Market Analysis, Insights and Forecast, 2019-2031
- 10.1. Market Analysis, Insights and Forecast - by LNG Infrastructure
- 10.1.1. LNG Liquefaction Plants
- 10.1.2. LNG Regasification Facilities
- 10.1.3. LNG Shipping
- 10.2. Market Analysis, Insights and Forecast - by LNG Trade
- 10.1. Market Analysis, Insights and Forecast - by LNG Infrastructure
- 11. North America LNG Market Analysis, Insights and Forecast, 2019-2031
- 11.1. Market Analysis, Insights and Forecast - By Country/Sub-region
- 11.1.1 United States
- 11.1.2 Canada
- 11.1.3 Mexico
- 12. Europe LNG Market Analysis, Insights and Forecast, 2019-2031
- 12.1. Market Analysis, Insights and Forecast - By Country/Sub-region
- 12.1.1 Germany
- 12.1.2 United Kingdom
- 12.1.3 France
- 12.1.4 Spain
- 12.1.5 Italy
- 12.1.6 Spain
- 12.1.7 Belgium
- 12.1.8 Netherland
- 12.1.9 Nordics
- 12.1.10 Rest of Europe
- 13. Asia Pacific LNG Market Analysis, Insights and Forecast, 2019-2031
- 13.1. Market Analysis, Insights and Forecast - By Country/Sub-region
- 13.1.1 China
- 13.1.2 Japan
- 13.1.3 India
- 13.1.4 South Korea
- 13.1.5 Southeast Asia
- 13.1.6 Australia
- 13.1.7 Indonesia
- 13.1.8 Phillipes
- 13.1.9 Singapore
- 13.1.10 Thailandc
- 13.1.11 Rest of Asia Pacific
- 14. South America LNG Market Analysis, Insights and Forecast, 2019-2031
- 14.1. Market Analysis, Insights and Forecast - By Country/Sub-region
- 14.1.1 Brazil
- 14.1.2 Argentina
- 14.1.3 Peru
- 14.1.4 Chile
- 14.1.5 Colombia
- 14.1.6 Ecuador
- 14.1.7 Venezuela
- 14.1.8 Rest of South America
- 15. MEA LNG Market Analysis, Insights and Forecast, 2019-2031
- 15.1. Market Analysis, Insights and Forecast - By Country/Sub-region
- 15.1.1 United Arab Emirates
- 15.1.2 Saudi Arabia
- 15.1.3 South Africa
- 15.1.4 Rest of Middle East and Africa
- 16. Competitive Analysis
- 16.1. Global Market Share Analysis 2024
- 16.2. Company Profiles
- 16.2.1 LNG Infrastructure Companies (Operators and EPC Companies)
- 16.2.1.1. Overview
- 16.2.1.2. Products
- 16.2.1.3. SWOT Analysis
- 16.2.1.4. Recent Developments
- 16.2.1.5. Financials (Based on Availability)
- 16.2.2 Shell PLC
- 16.2.2.1. Overview
- 16.2.2.2. Products
- 16.2.2.3. SWOT Analysis
- 16.2.2.4. Recent Developments
- 16.2.2.5. Financials (Based on Availability)
- 16.2.3 JGC Holdings Corporation
- 16.2.3.1. Overview
- 16.2.3.2. Products
- 16.2.3.3. SWOT Analysis
- 16.2.3.4. Recent Developments
- 16.2.3.5. Financials (Based on Availability)
- 16.2.4 Fluor Corporation
- 16.2.4.1. Overview
- 16.2.4.2. Products
- 16.2.4.3. SWOT Analysis
- 16.2.4.4. Recent Developments
- 16.2.4.5. Financials (Based on Availability)
- 16.2.5 LNG Bunkering and Trading Companies
- 16.2.5.1. Overview
- 16.2.5.2. Products
- 16.2.5.3. SWOT Analysis
- 16.2.5.4. Recent Developments
- 16.2.5.5. Financials (Based on Availability)
- 16.2.6 Bechtel Corporation
- 16.2.6.1. Overview
- 16.2.6.2. Products
- 16.2.6.3. SWOT Analysis
- 16.2.6.4. Recent Developments
- 16.2.6.5. Financials (Based on Availability)
- 16.2.7 Gazpromneft Marine Bunker LLC
- 16.2.7.1. Overview
- 16.2.7.2. Products
- 16.2.7.3. SWOT Analysis
- 16.2.7.4. Recent Developments
- 16.2.7.5. Financials (Based on Availability)
- 16.2.8 Gasum AS
- 16.2.8.1. Overview
- 16.2.8.2. Products
- 16.2.8.3. SWOT Analysis
- 16.2.8.4. Recent Developments
- 16.2.8.5. Financials (Based on Availability)
- 16.2.9 Chiyoda Corporation
- 16.2.9.1. Overview
- 16.2.9.2. Products
- 16.2.9.3. SWOT Analysis
- 16.2.9.4. Recent Developments
- 16.2.9.5. Financials (Based on Availability)
- 16.2.10 Technip FMC PLC
- 16.2.10.1. Overview
- 16.2.10.2. Products
- 16.2.10.3. SWOT Analysis
- 16.2.10.4. Recent Developments
- 16.2.10.5. Financials (Based on Availability)
- 16.2.11 ENN Energy Holdings Ltd
- 16.2.11.1. Overview
- 16.2.11.2. Products
- 16.2.11.3. SWOT Analysis
- 16.2.11.4. Recent Developments
- 16.2.11.5. Financials (Based on Availability)
- 16.2.12 Engie SA
- 16.2.12.1. Overview
- 16.2.12.2. Products
- 16.2.12.3. SWOT Analysis
- 16.2.12.4. Recent Developments
- 16.2.12.5. Financials (Based on Availability)
- 16.2.1 LNG Infrastructure Companies (Operators and EPC Companies)
List of Figures
- Figure 1: Global LNG Market Revenue Breakdown (Million, %) by Region 2024 & 2032
- Figure 2: North America LNG Market Revenue (Million), by Country 2024 & 2032
- Figure 3: North America LNG Market Revenue Share (%), by Country 2024 & 2032
- Figure 4: Europe LNG Market Revenue (Million), by Country 2024 & 2032
- Figure 5: Europe LNG Market Revenue Share (%), by Country 2024 & 2032
- Figure 6: Asia Pacific LNG Market Revenue (Million), by Country 2024 & 2032
- Figure 7: Asia Pacific LNG Market Revenue Share (%), by Country 2024 & 2032
- Figure 8: South America LNG Market Revenue (Million), by Country 2024 & 2032
- Figure 9: South America LNG Market Revenue Share (%), by Country 2024 & 2032
- Figure 10: MEA LNG Market Revenue (Million), by Country 2024 & 2032
- Figure 11: MEA LNG Market Revenue Share (%), by Country 2024 & 2032
- Figure 12: North America LNG Market Revenue (Million), by LNG Infrastructure 2024 & 2032
- Figure 13: North America LNG Market Revenue Share (%), by LNG Infrastructure 2024 & 2032
- Figure 14: North America LNG Market Revenue (Million), by LNG Trade 2024 & 2032
- Figure 15: North America LNG Market Revenue Share (%), by LNG Trade 2024 & 2032
- Figure 16: North America LNG Market Revenue (Million), by Country 2024 & 2032
- Figure 17: North America LNG Market Revenue Share (%), by Country 2024 & 2032
- Figure 18: Europe LNG Market Revenue (Million), by LNG Infrastructure 2024 & 2032
- Figure 19: Europe LNG Market Revenue Share (%), by LNG Infrastructure 2024 & 2032
- Figure 20: Europe LNG Market Revenue (Million), by LNG Trade 2024 & 2032
- Figure 21: Europe LNG Market Revenue Share (%), by LNG Trade 2024 & 2032
- Figure 22: Europe LNG Market Revenue (Million), by Country 2024 & 2032
- Figure 23: Europe LNG Market Revenue Share (%), by Country 2024 & 2032
- Figure 24: Asia Pacific LNG Market Revenue (Million), by LNG Infrastructure 2024 & 2032
- Figure 25: Asia Pacific LNG Market Revenue Share (%), by LNG Infrastructure 2024 & 2032
- Figure 26: Asia Pacific LNG Market Revenue (Million), by LNG Trade 2024 & 2032
- Figure 27: Asia Pacific LNG Market Revenue Share (%), by LNG Trade 2024 & 2032
- Figure 28: Asia Pacific LNG Market Revenue (Million), by Country 2024 & 2032
- Figure 29: Asia Pacific LNG Market Revenue Share (%), by Country 2024 & 2032
- Figure 30: South America LNG Market Revenue (Million), by LNG Infrastructure 2024 & 2032
- Figure 31: South America LNG Market Revenue Share (%), by LNG Infrastructure 2024 & 2032
- Figure 32: South America LNG Market Revenue (Million), by LNG Trade 2024 & 2032
- Figure 33: South America LNG Market Revenue Share (%), by LNG Trade 2024 & 2032
- Figure 34: South America LNG Market Revenue (Million), by Country 2024 & 2032
- Figure 35: South America LNG Market Revenue Share (%), by Country 2024 & 2032
- Figure 36: Middle East and Africa LNG Market Revenue (Million), by LNG Infrastructure 2024 & 2032
- Figure 37: Middle East and Africa LNG Market Revenue Share (%), by LNG Infrastructure 2024 & 2032
- Figure 38: Middle East and Africa LNG Market Revenue (Million), by LNG Trade 2024 & 2032
- Figure 39: Middle East and Africa LNG Market Revenue Share (%), by LNG Trade 2024 & 2032
- Figure 40: Middle East and Africa LNG Market Revenue (Million), by Country 2024 & 2032
- Figure 41: Middle East and Africa LNG Market Revenue Share (%), by Country 2024 & 2032
List of Tables
- Table 1: Global LNG Market Revenue Million Forecast, by Region 2019 & 2032
- Table 2: Global LNG Market Revenue Million Forecast, by LNG Infrastructure 2019 & 2032
- Table 3: Global LNG Market Revenue Million Forecast, by LNG Trade 2019 & 2032
- Table 4: Global LNG Market Revenue Million Forecast, by Region 2019 & 2032
- Table 5: Global LNG Market Revenue Million Forecast, by Country 2019 & 2032
- Table 6: United States LNG Market Revenue (Million) Forecast, by Application 2019 & 2032
- Table 7: Canada LNG Market Revenue (Million) Forecast, by Application 2019 & 2032
- Table 8: Mexico LNG Market Revenue (Million) Forecast, by Application 2019 & 2032
- Table 9: Global LNG Market Revenue Million Forecast, by Country 2019 & 2032
- Table 10: Germany LNG Market Revenue (Million) Forecast, by Application 2019 & 2032
- Table 11: United Kingdom LNG Market Revenue (Million) Forecast, by Application 2019 & 2032
- Table 12: France LNG Market Revenue (Million) Forecast, by Application 2019 & 2032
- Table 13: Spain LNG Market Revenue (Million) Forecast, by Application 2019 & 2032
- Table 14: Italy LNG Market Revenue (Million) Forecast, by Application 2019 & 2032
- Table 15: Spain LNG Market Revenue (Million) Forecast, by Application 2019 & 2032
- Table 16: Belgium LNG Market Revenue (Million) Forecast, by Application 2019 & 2032
- Table 17: Netherland LNG Market Revenue (Million) Forecast, by Application 2019 & 2032
- Table 18: Nordics LNG Market Revenue (Million) Forecast, by Application 2019 & 2032
- Table 19: Rest of Europe LNG Market Revenue (Million) Forecast, by Application 2019 & 2032
- Table 20: Global LNG Market Revenue Million Forecast, by Country 2019 & 2032
- Table 21: China LNG Market Revenue (Million) Forecast, by Application 2019 & 2032
- Table 22: Japan LNG Market Revenue (Million) Forecast, by Application 2019 & 2032
- Table 23: India LNG Market Revenue (Million) Forecast, by Application 2019 & 2032
- Table 24: South Korea LNG Market Revenue (Million) Forecast, by Application 2019 & 2032
- Table 25: Southeast Asia LNG Market Revenue (Million) Forecast, by Application 2019 & 2032
- Table 26: Australia LNG Market Revenue (Million) Forecast, by Application 2019 & 2032
- Table 27: Indonesia LNG Market Revenue (Million) Forecast, by Application 2019 & 2032
- Table 28: Phillipes LNG Market Revenue (Million) Forecast, by Application 2019 & 2032
- Table 29: Singapore LNG Market Revenue (Million) Forecast, by Application 2019 & 2032
- Table 30: Thailandc LNG Market Revenue (Million) Forecast, by Application 2019 & 2032
- Table 31: Rest of Asia Pacific LNG Market Revenue (Million) Forecast, by Application 2019 & 2032
- Table 32: Global LNG Market Revenue Million Forecast, by Country 2019 & 2032
- Table 33: Brazil LNG Market Revenue (Million) Forecast, by Application 2019 & 2032
- Table 34: Argentina LNG Market Revenue (Million) Forecast, by Application 2019 & 2032
- Table 35: Peru LNG Market Revenue (Million) Forecast, by Application 2019 & 2032
- Table 36: Chile LNG Market Revenue (Million) Forecast, by Application 2019 & 2032
- Table 37: Colombia LNG Market Revenue (Million) Forecast, by Application 2019 & 2032
- Table 38: Ecuador LNG Market Revenue (Million) Forecast, by Application 2019 & 2032
- Table 39: Venezuela LNG Market Revenue (Million) Forecast, by Application 2019 & 2032
- Table 40: Rest of South America LNG Market Revenue (Million) Forecast, by Application 2019 & 2032
- Table 41: Global LNG Market Revenue Million Forecast, by Country 2019 & 2032
- Table 42: United Arab Emirates LNG Market Revenue (Million) Forecast, by Application 2019 & 2032
- Table 43: Saudi Arabia LNG Market Revenue (Million) Forecast, by Application 2019 & 2032
- Table 44: South Africa LNG Market Revenue (Million) Forecast, by Application 2019 & 2032
- Table 45: Rest of Middle East and Africa LNG Market Revenue (Million) Forecast, by Application 2019 & 2032
- Table 46: Global LNG Market Revenue Million Forecast, by LNG Infrastructure 2019 & 2032
- Table 47: Global LNG Market Revenue Million Forecast, by LNG Trade 2019 & 2032
- Table 48: Global LNG Market Revenue Million Forecast, by Country 2019 & 2032
- Table 49: United States LNG Market Revenue (Million) Forecast, by Application 2019 & 2032
- Table 50: Canada LNG Market Revenue (Million) Forecast, by Application 2019 & 2032
- Table 51: Mexico LNG Market Revenue (Million) Forecast, by Application 2019 & 2032
- Table 52: Rest of the North America LNG Market Revenue (Million) Forecast, by Application 2019 & 2032
- Table 53: Global LNG Market Revenue Million Forecast, by LNG Infrastructure 2019 & 2032
- Table 54: Global LNG Market Revenue Million Forecast, by LNG Trade 2019 & 2032
- Table 55: Global LNG Market Revenue Million Forecast, by Country 2019 & 2032
- Table 56: Germany LNG Market Revenue (Million) Forecast, by Application 2019 & 2032
- Table 57: United Kingdom LNG Market Revenue (Million) Forecast, by Application 2019 & 2032
- Table 58: France LNG Market Revenue (Million) Forecast, by Application 2019 & 2032
- Table 59: Rest of the Europe LNG Market Revenue (Million) Forecast, by Application 2019 & 2032
- Table 60: Global LNG Market Revenue Million Forecast, by LNG Infrastructure 2019 & 2032
- Table 61: Global LNG Market Revenue Million Forecast, by LNG Trade 2019 & 2032
- Table 62: Global LNG Market Revenue Million Forecast, by Country 2019 & 2032
- Table 63: China LNG Market Revenue (Million) Forecast, by Application 2019 & 2032
- Table 64: South Korea LNG Market Revenue (Million) Forecast, by Application 2019 & 2032
- Table 65: Japan LNG Market Revenue (Million) Forecast, by Application 2019 & 2032
- Table 66: Rest of the Asia Pacific LNG Market Revenue (Million) Forecast, by Application 2019 & 2032
- Table 67: Global LNG Market Revenue Million Forecast, by LNG Infrastructure 2019 & 2032
- Table 68: Global LNG Market Revenue Million Forecast, by LNG Trade 2019 & 2032
- Table 69: Global LNG Market Revenue Million Forecast, by Country 2019 & 2032
- Table 70: Brazil LNG Market Revenue (Million) Forecast, by Application 2019 & 2032
- Table 71: Argentina LNG Market Revenue (Million) Forecast, by Application 2019 & 2032
- Table 72: Rest of the South America LNG Market Revenue (Million) Forecast, by Application 2019 & 2032
- Table 73: Global LNG Market Revenue Million Forecast, by LNG Infrastructure 2019 & 2032
- Table 74: Global LNG Market Revenue Million Forecast, by LNG Trade 2019 & 2032
- Table 75: Global LNG Market Revenue Million Forecast, by Country 2019 & 2032
- Table 76: United Arab Emirates LNG Market Revenue (Million) Forecast, by Application 2019 & 2032
- Table 77: Saudi Arabia LNG Market Revenue (Million) Forecast, by Application 2019 & 2032
- Table 78: Rest of the Middle East and Africa LNG Market Revenue (Million) Forecast, by Application 2019 & 2032
Frequently Asked Questions
1. What is the projected Compound Annual Growth Rate (CAGR) of the LNG Market?
The projected CAGR is approximately 6.75%.
2. Which companies are prominent players in the LNG Market?
Key companies in the market include LNG Infrastructure Companies (Operators and EPC Companies), Shell PLC, JGC Holdings Corporation, Fluor Corporation, LNG Bunkering and Trading Companies, Bechtel Corporation, Gazpromneft Marine Bunker LLC, Gasum AS, Chiyoda Corporation, Technip FMC PLC, ENN Energy Holdings Ltd, Engie SA.
3. What are the main segments of the LNG Market?
The market segments include LNG Infrastructure, LNG Trade.
4. Can you provide details about the market size?
The market size is estimated to be USD XX Million as of 2022.
5. What are some drivers contributing to market growth?
4.; Increasing Investments in Offshore Oil and Gas Projects.
6. What are the notable trends driving market growth?
Liquefaction Sector to Dominate the Market.
7. Are there any restraints impacting market growth?
4.; Increasing Penetration of Renewable Energy.
8. Can you provide examples of recent developments in the market?
Mar 2023: Sempra reported that Sempra Infrastructure Partners LP (Sempra Infrastructure), its 70%-owned subsidiary, reached a positive final investment decision (FID) for the development, construction, and operation of the Port Arthur LNG Phase 1 project in Jefferson County, Texas.
9. What pricing options are available for accessing the report?
Pricing options include single-user, multi-user, and enterprise licenses priced at USD 4750, USD 5250, and USD 8750 respectively.
10. Is the market size provided in terms of value or volume?
The market size is provided in terms of value, measured in Million.
11. Are there any specific market keywords associated with the report?
Yes, the market keyword associated with the report is "LNG Market," which aids in identifying and referencing the specific market segment covered.
12. How do I determine which pricing option suits my needs best?
The pricing options vary based on user requirements and access needs. Individual users may opt for single-user licenses, while businesses requiring broader access may choose multi-user or enterprise licenses for cost-effective access to the report.
13. Are there any additional resources or data provided in the LNG Market report?
While the report offers comprehensive insights, it's advisable to review the specific contents or supplementary materials provided to ascertain if additional resources or data are available.
14. How can I stay updated on further developments or reports in the LNG Market?
To stay informed about further developments, trends, and reports in the LNG Market, consider subscribing to industry newsletters, following relevant companies and organizations, or regularly checking reputable industry news sources and publications.
Methodology
Step 1 - Identification of Relevant Samples Size from Population Database


Step 2 - Approaches for Defining Global Market Size (Value, Volume* & Price*)

Note*: In applicable scenarios
Step 3 - Data Sources
Primary Research
- Web Analytics
- Survey Reports
- Research Institute
- Latest Research Reports
- Opinion Leaders
Secondary Research
- Annual Reports
- White Paper
- Latest Press Release
- Industry Association
- Paid Database
- Investor Presentations

Step 4 - Data Triangulation
Involves using different sources of information in order to increase the validity of a study
These sources are likely to be stakeholders in a program - participants, other researchers, program staff, other community members, and so on.
Then we put all data in single framework & apply various statistical tools to find out the dynamic on the market.
During the analysis stage, feedback from the stakeholder groups would be compared to determine areas of agreement as well as areas of divergence
