

Key Insights
The Low-Power Wide-Area Network (LPWAN) market is experiencing explosive growth, projected to reach a market size of $32.01 billion in 2025 and exhibiting a remarkable Compound Annual Growth Rate (CAGR) of 52.05%. This surge is driven by the increasing adoption of IoT devices across diverse sectors, demanding reliable, long-range, and low-power connectivity solutions. Key drivers include the rising demand for smart city initiatives, the proliferation of smart homes and buildings, the expansion of smart agriculture applications, and the growing need for efficient asset tracking in logistics and industrial manufacturing. The market is segmented by technology (LoRaWAN, NB-IoT, LTE-M, and others), service type (professional and managed services), end-user (oil and gas, consumer electronics, healthcare, industrial manufacturing, logistics, and others), and application (smart cities, smart homes/buildings, smart agriculture, and others). Leading players such as Semtech Corporation, Cisco Systems, Huawei, and others are actively shaping the market landscape through technological innovations and strategic partnerships. The robust growth trajectory is anticipated to continue throughout the forecast period (2025-2033), fueled by ongoing technological advancements, increasing government support for IoT deployments, and the growing need for real-time data monitoring and control across various industries.
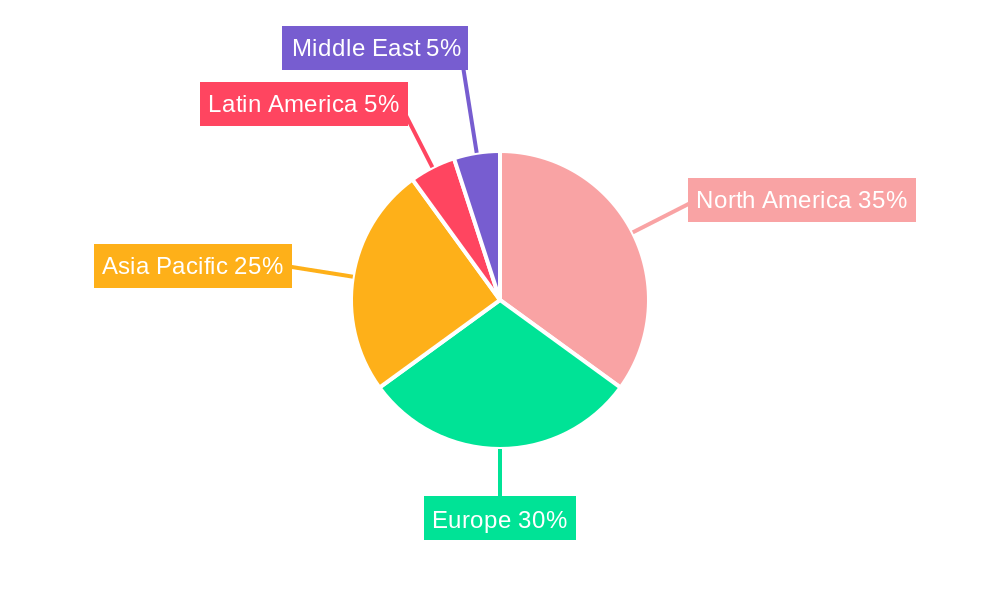
The significant growth of the LPWAN market is further segmented by region, with North America, Europe, and Asia Pacific expected to dominate market share due to early adoption of IoT technologies and robust infrastructure. However, the Middle East and Latin America are also poised for significant expansion in the coming years as the adoption of LPWAN technologies gains momentum in these regions. Continued investment in research and development, along with the decreasing cost of LPWAN devices and services, will act as strong catalysts for market expansion. While potential restraints could include interoperability challenges and security concerns, the overall market outlook for LPWAN remains remarkably positive, promising considerable opportunities for both established players and new entrants alike. The diverse applications of LPWAN technology across various sectors ensure its long-term viability and continued growth.

LPWAN Market: A Comprehensive Market Report (2019-2033)
This in-depth report provides a comprehensive analysis of the Low-Power Wide-Area Network (LPWAN) market, covering market dynamics, growth trends, regional dominance, product landscape, key players, and future outlook. The study period spans from 2019 to 2033, with 2025 as the base and estimated year. The report leverages extensive research to offer actionable insights for industry professionals, investors, and strategists. The total market size in 2025 is estimated at xx Million units.
LPWAN Market Dynamics & Structure
The LPWAN market exhibits a moderately concentrated structure, with key players like Semtech Corporation, Cisco Systems Inc, Huawei Technologies Co Ltd, Loriot AG, AT&T Inc, Sigfox SA, Ingenu Inc, and Vodafone Group PLC competing for market share. Technological innovation, particularly in areas like LoRaWAN and NB-IoT, is a significant driver, while regulatory frameworks and the availability of spectrum influence deployment. The market experiences competition from alternative technologies, and the ongoing evolution of 5G also presents both opportunities and challenges. Mergers and acquisitions (M&A) activity in the sector is moderate, with approximately xx deals recorded in the past five years, resulting in a xx% market share shift among the top five players.
- Market Concentration: Moderately concentrated, with top 5 players holding xx% market share in 2025.
- Technological Innovation: Strong driver, with continuous advancements in LoRaWAN, NB-IoT, and LTE-M technologies.
- Regulatory Frameworks: Significant influence on spectrum allocation and deployment strategies.
- Competitive Substitutes: Competition from alternative communication technologies like Wi-Fi and cellular networks.
- End-User Demographics: Diverse, spanning across various industries, including Oil & Gas, Consumer Electronics, and Smart Cities.
- M&A Trends: Moderate activity, with a focus on technology acquisition and market expansion.
LPWAN Market Growth Trends & Insights
The LPWAN market has demonstrated robust growth in recent years, fueled by the burgeoning adoption of IoT devices across diverse sectors. While precise figures for 2019 and 2025 are unavailable at this time, the market has shown significant expansion. This growth trajectory is projected to persist throughout the forecast period (2025-2033), driven by several key factors. Technological advancements, such as enhanced power efficiency and extended range capabilities, are making LPWAN solutions more attractive and viable for a wider range of applications. The increasing consumer preference for smart devices and the growing need for remote monitoring and control in various industries further contribute to market expansion. Significant market penetration is observed in key sectors like smart cities, industrial automation, agriculture, and logistics, showcasing substantial future potential. Furthermore, the development of new LPWAN standards and improved interoperability are contributing to market growth. This expansion indicates a promising outlook for investors and stakeholders in the LPWAN ecosystem.
Dominant Regions, Countries, or Segments in LPWAN Market
North America currently holds the largest market share in the LPWAN market, followed by Europe and Asia-Pacific. This dominance is attributed to factors such as early adoption of IoT technologies, well-established infrastructure, and strong regulatory support. Within the segments, LoRaWAN holds a significant market share due to its open-source nature and extensive ecosystem. The Professional Service segment is leading the Service market due to the high demand for network planning, deployment, and integration support. Within end-users, the Industrial Manufacturing and Smart Cities segments dominate, driven by their high volume of IoT deployments.
- Leading Region: North America (holds xx% market share in 2025)
- Key Drivers in North America: Strong IoT ecosystem, early technology adoption, robust infrastructure.
- High-Growth Segments: LoRaWAN (by type), Professional Services (by service), and Industrial Manufacturing (by end-user).
- Dominant Applications: Smart Cities and Industrial Manufacturing (by application)
LPWAN Market Product Landscape
The LPWAN market features a diverse range of products, including gateways, sensors, network management platforms, and various communication modules. These products are characterized by their low power consumption, long range, and cost-effectiveness. Recent technological advancements focus on improving security, optimizing power management, and enhancing network scalability. Manufacturers are increasingly emphasizing features like seamless integration with other IoT platforms and cloud-based solutions.
Key Drivers, Barriers & Challenges in LPWAN Market
Key Drivers:
- The proliferation of IoT devices and applications across various sectors.
- The need for cost-effective and long-range connectivity solutions.
- Technological advancements in low-power consumption and extended range.
- Government initiatives and funding for Smart City projects.
Challenges and Restraints:
- Interoperability issues among different LPWAN technologies.
- Security concerns related to data transmission and device vulnerabilities.
- Lack of standardized regulations and spectrum allocation policies in certain regions.
- High initial investment costs for network deployment, particularly in remote areas. This creates a barrier to entry for smaller companies and restricts market expansion in underserved regions.
Emerging Opportunities in LPWAN Market
- Growing demand for LPWAN solutions in emerging economies.
- Expansion into new vertical markets, such as precision agriculture and smart logistics.
- Development of innovative applications, including asset tracking, environmental monitoring, and smart metering.
- Integration of LPWAN technologies with other communication protocols to create hybrid networks.
Growth Accelerators in the LPWAN Market Industry
Long-term growth in the LPWAN market will be accelerated by technological breakthroughs in energy harvesting, improved network security, and the development of more sophisticated analytics platforms. Strategic partnerships between technology providers and system integrators will further expand market reach. Government investments in infrastructure development and smart city initiatives will create a favorable environment for market expansion.
Key Players Shaping the LPWAN Market Market
- Semtech Corporation
- Cisco Systems Inc
- Huawei Technologies Co Ltd
- Loriot AG
- AT&T Inc
- Sigfox SA
- Ingenu Inc
- Vodafone Group PLC
Notable Milestones in LPWAN Market Sector
- April 2023: Semtech Corporation announced the expansion of its PerSe product portfolio with a new integrated circuit (IC) for 5G mobile devices, enhancing RF control and SAR compliance. This signifies a move towards integrating LPWAN technologies with 5G for enhanced performance and broader applications.
- April 2023: UnaBiz open-sourced its Sigfox 0G technology device library code, facilitating wider adoption among IoT developers. This step promotes community development and accelerates innovation within the LPWAN ecosystem.
- [Add more recent milestones here with dates and brief descriptions. Include links to relevant news articles where possible.]
In-Depth LPWAN Market Market Outlook
The LPWAN market is poised for continued strong growth, driven by the increasing demand for connected devices and the expansion of IoT applications across various sectors. Strategic opportunities lie in developing innovative solutions tailored to specific vertical markets, expanding into untapped regions, and strengthening partnerships to leverage the growing ecosystem. The convergence of LPWAN with other technologies will further create new opportunities. The market size is projected to reach xx Million units by 2033, indicating significant long-term potential.
LPWAN Market Segmentation
-
1. Type
- 1.1. LoRaWAN
- 1.2. NB-IoT
- 1.3. LTE-M
- 1.4. Other Types (Sigfox, Weightless, etc.)
-
2. Service
- 2.1. Professional Service
- 2.2. Managed Service
-
3. End User
- 3.1. Oil and Gas
- 3.2. Consumer Electronics
- 3.3. Healthcare
- 3.4. Industrial Manufacturing
- 3.5. Logistics and Travelling
- 3.6. Other End Users
-
4. Application
- 4.1. Smart Cities
- 4.2. Smart Homes/Buildings
- 4.3. Smart Agriculture
- 4.4. Other Applications
LPWAN Market Segmentation By Geography
- 1. North America
- 2. Europe
- 3. Asia
- 4. Australia and New Zealand
- 5. Latin America
- 6. Middle East and Africa
LPWAN Market REPORT HIGHLIGHTS
| Aspects | Details |
|---|---|
| Study Period | 2019-2033 |
| Base Year | 2024 |
| Estimated Year | 2025 |
| Forecast Period | 2025-2033 |
| Historical Period | 2019-2024 |
| Growth Rate | CAGR of 52.05% from 2019-2033 |
| Segmentation |
|
Table of Contents
- 1. Introduction
- 1.1. Research Scope
- 1.2. Market Segmentation
- 1.3. Research Methodology
- 1.4. Definitions and Assumptions
- 2. Executive Summary
- 2.1. Introduction
- 3. Market Dynamics
- 3.1. Introduction
- 3.2. Market Drivers
- 3.2.1. Rising Need of Long Range Connectivity Between Devices5.1.2 5G Technology to Drive the Market Growth
- 3.3. Market Restrains
- 3.3.1. Privacy and Security Concerns
- 3.4. Market Trends
- 3.4.1. 5G Technology to Drive the Market Growth
- 4. Market Factor Analysis
- 4.1. Porters Five Forces
- 4.2. Supply/Value Chain
- 4.3. PESTEL analysis
- 4.4. Market Entropy
- 4.5. Patent/Trademark Analysis
- 5. Global LPWAN Market Analysis, Insights and Forecast, 2019-2031
- 5.1. Market Analysis, Insights and Forecast - by Type
- 5.1.1. LoRaWAN
- 5.1.2. NB-IoT
- 5.1.3. LTE-M
- 5.1.4. Other Types (Sigfox, Weightless, etc.)
- 5.2. Market Analysis, Insights and Forecast - by Service
- 5.2.1. Professional Service
- 5.2.2. Managed Service
- 5.3. Market Analysis, Insights and Forecast - by End User
- 5.3.1. Oil and Gas
- 5.3.2. Consumer Electronics
- 5.3.3. Healthcare
- 5.3.4. Industrial Manufacturing
- 5.3.5. Logistics and Travelling
- 5.3.6. Other End Users
- 5.4. Market Analysis, Insights and Forecast - by Application
- 5.4.1. Smart Cities
- 5.4.2. Smart Homes/Buildings
- 5.4.3. Smart Agriculture
- 5.4.4. Other Applications
- 5.5. Market Analysis, Insights and Forecast - by Region
- 5.5.1. North America
- 5.5.2. Europe
- 5.5.3. Asia
- 5.5.4. Australia and New Zealand
- 5.5.5. Latin America
- 5.5.6. Middle East and Africa
- 5.1. Market Analysis, Insights and Forecast - by Type
- 6. North America LPWAN Market Analysis, Insights and Forecast, 2019-2031
- 6.1. Market Analysis, Insights and Forecast - by Type
- 6.1.1. LoRaWAN
- 6.1.2. NB-IoT
- 6.1.3. LTE-M
- 6.1.4. Other Types (Sigfox, Weightless, etc.)
- 6.2. Market Analysis, Insights and Forecast - by Service
- 6.2.1. Professional Service
- 6.2.2. Managed Service
- 6.3. Market Analysis, Insights and Forecast - by End User
- 6.3.1. Oil and Gas
- 6.3.2. Consumer Electronics
- 6.3.3. Healthcare
- 6.3.4. Industrial Manufacturing
- 6.3.5. Logistics and Travelling
- 6.3.6. Other End Users
- 6.4. Market Analysis, Insights and Forecast - by Application
- 6.4.1. Smart Cities
- 6.4.2. Smart Homes/Buildings
- 6.4.3. Smart Agriculture
- 6.4.4. Other Applications
- 6.1. Market Analysis, Insights and Forecast - by Type
- 7. Europe LPWAN Market Analysis, Insights and Forecast, 2019-2031
- 7.1. Market Analysis, Insights and Forecast - by Type
- 7.1.1. LoRaWAN
- 7.1.2. NB-IoT
- 7.1.3. LTE-M
- 7.1.4. Other Types (Sigfox, Weightless, etc.)
- 7.2. Market Analysis, Insights and Forecast - by Service
- 7.2.1. Professional Service
- 7.2.2. Managed Service
- 7.3. Market Analysis, Insights and Forecast - by End User
- 7.3.1. Oil and Gas
- 7.3.2. Consumer Electronics
- 7.3.3. Healthcare
- 7.3.4. Industrial Manufacturing
- 7.3.5. Logistics and Travelling
- 7.3.6. Other End Users
- 7.4. Market Analysis, Insights and Forecast - by Application
- 7.4.1. Smart Cities
- 7.4.2. Smart Homes/Buildings
- 7.4.3. Smart Agriculture
- 7.4.4. Other Applications
- 7.1. Market Analysis, Insights and Forecast - by Type
- 8. Asia LPWAN Market Analysis, Insights and Forecast, 2019-2031
- 8.1. Market Analysis, Insights and Forecast - by Type
- 8.1.1. LoRaWAN
- 8.1.2. NB-IoT
- 8.1.3. LTE-M
- 8.1.4. Other Types (Sigfox, Weightless, etc.)
- 8.2. Market Analysis, Insights and Forecast - by Service
- 8.2.1. Professional Service
- 8.2.2. Managed Service
- 8.3. Market Analysis, Insights and Forecast - by End User
- 8.3.1. Oil and Gas
- 8.3.2. Consumer Electronics
- 8.3.3. Healthcare
- 8.3.4. Industrial Manufacturing
- 8.3.5. Logistics and Travelling
- 8.3.6. Other End Users
- 8.4. Market Analysis, Insights and Forecast - by Application
- 8.4.1. Smart Cities
- 8.4.2. Smart Homes/Buildings
- 8.4.3. Smart Agriculture
- 8.4.4. Other Applications
- 8.1. Market Analysis, Insights and Forecast - by Type
- 9. Australia and New Zealand LPWAN Market Analysis, Insights and Forecast, 2019-2031
- 9.1. Market Analysis, Insights and Forecast - by Type
- 9.1.1. LoRaWAN
- 9.1.2. NB-IoT
- 9.1.3. LTE-M
- 9.1.4. Other Types (Sigfox, Weightless, etc.)
- 9.2. Market Analysis, Insights and Forecast - by Service
- 9.2.1. Professional Service
- 9.2.2. Managed Service
- 9.3. Market Analysis, Insights and Forecast - by End User
- 9.3.1. Oil and Gas
- 9.3.2. Consumer Electronics
- 9.3.3. Healthcare
- 9.3.4. Industrial Manufacturing
- 9.3.5. Logistics and Travelling
- 9.3.6. Other End Users
- 9.4. Market Analysis, Insights and Forecast - by Application
- 9.4.1. Smart Cities
- 9.4.2. Smart Homes/Buildings
- 9.4.3. Smart Agriculture
- 9.4.4. Other Applications
- 9.1. Market Analysis, Insights and Forecast - by Type
- 10. Latin America LPWAN Market Analysis, Insights and Forecast, 2019-2031
- 10.1. Market Analysis, Insights and Forecast - by Type
- 10.1.1. LoRaWAN
- 10.1.2. NB-IoT
- 10.1.3. LTE-M
- 10.1.4. Other Types (Sigfox, Weightless, etc.)
- 10.2. Market Analysis, Insights and Forecast - by Service
- 10.2.1. Professional Service
- 10.2.2. Managed Service
- 10.3. Market Analysis, Insights and Forecast - by End User
- 10.3.1. Oil and Gas
- 10.3.2. Consumer Electronics
- 10.3.3. Healthcare
- 10.3.4. Industrial Manufacturing
- 10.3.5. Logistics and Travelling
- 10.3.6. Other End Users
- 10.4. Market Analysis, Insights and Forecast - by Application
- 10.4.1. Smart Cities
- 10.4.2. Smart Homes/Buildings
- 10.4.3. Smart Agriculture
- 10.4.4. Other Applications
- 10.1. Market Analysis, Insights and Forecast - by Type
- 11. Middle East and Africa LPWAN Market Analysis, Insights and Forecast, 2019-2031
- 11.1. Market Analysis, Insights and Forecast - by Type
- 11.1.1. LoRaWAN
- 11.1.2. NB-IoT
- 11.1.3. LTE-M
- 11.1.4. Other Types (Sigfox, Weightless, etc.)
- 11.2. Market Analysis, Insights and Forecast - by Service
- 11.2.1. Professional Service
- 11.2.2. Managed Service
- 11.3. Market Analysis, Insights and Forecast - by End User
- 11.3.1. Oil and Gas
- 11.3.2. Consumer Electronics
- 11.3.3. Healthcare
- 11.3.4. Industrial Manufacturing
- 11.3.5. Logistics and Travelling
- 11.3.6. Other End Users
- 11.4. Market Analysis, Insights and Forecast - by Application
- 11.4.1. Smart Cities
- 11.4.2. Smart Homes/Buildings
- 11.4.3. Smart Agriculture
- 11.4.4. Other Applications
- 11.1. Market Analysis, Insights and Forecast - by Type
- 12. North America LPWAN Market Analysis, Insights and Forecast, 2019-2031
- 12.1. Market Analysis, Insights and Forecast - By Country/Sub-region
- 12.1.1.
- 13. Europe LPWAN Market Analysis, Insights and Forecast, 2019-2031
- 13.1. Market Analysis, Insights and Forecast - By Country/Sub-region
- 13.1.1.
- 14. Asia Pacific LPWAN Market Analysis, Insights and Forecast, 2019-2031
- 14.1. Market Analysis, Insights and Forecast - By Country/Sub-region
- 14.1.1.
- 15. Latin America LPWAN Market Analysis, Insights and Forecast, 2019-2031
- 15.1. Market Analysis, Insights and Forecast - By Country/Sub-region
- 15.1.1.
- 16. Middle East LPWAN Market Analysis, Insights and Forecast, 2019-2031
- 16.1. Market Analysis, Insights and Forecast - By Country/Sub-region
- 16.1.1.
- 17. Competitive Analysis
- 17.1. Global Market Share Analysis 2024
- 17.2. Company Profiles
- 17.2.1 Semtech Corporation
- 17.2.1.1. Overview
- 17.2.1.2. Products
- 17.2.1.3. SWOT Analysis
- 17.2.1.4. Recent Developments
- 17.2.1.5. Financials (Based on Availability)
- 17.2.2 Cisco Systems Inc
- 17.2.2.1. Overview
- 17.2.2.2. Products
- 17.2.2.3. SWOT Analysis
- 17.2.2.4. Recent Developments
- 17.2.2.5. Financials (Based on Availability)
- 17.2.3 Huawei Technologies Co Ltd
- 17.2.3.1. Overview
- 17.2.3.2. Products
- 17.2.3.3. SWOT Analysis
- 17.2.3.4. Recent Developments
- 17.2.3.5. Financials (Based on Availability)
- 17.2.4 Loriot AG*List Not Exhaustive
- 17.2.4.1. Overview
- 17.2.4.2. Products
- 17.2.4.3. SWOT Analysis
- 17.2.4.4. Recent Developments
- 17.2.4.5. Financials (Based on Availability)
- 17.2.5 AT&T Inc
- 17.2.5.1. Overview
- 17.2.5.2. Products
- 17.2.5.3. SWOT Analysis
- 17.2.5.4. Recent Developments
- 17.2.5.5. Financials (Based on Availability)
- 17.2.6 Sigfox SA
- 17.2.6.1. Overview
- 17.2.6.2. Products
- 17.2.6.3. SWOT Analysis
- 17.2.6.4. Recent Developments
- 17.2.6.5. Financials (Based on Availability)
- 17.2.7 Ingenu Inc
- 17.2.7.1. Overview
- 17.2.7.2. Products
- 17.2.7.3. SWOT Analysis
- 17.2.7.4. Recent Developments
- 17.2.7.5. Financials (Based on Availability)
- 17.2.8 Vodafone Group PLC
- 17.2.8.1. Overview
- 17.2.8.2. Products
- 17.2.8.3. SWOT Analysis
- 17.2.8.4. Recent Developments
- 17.2.8.5. Financials (Based on Availability)
- 17.2.1 Semtech Corporation
List of Figures
- Figure 1: Global LPWAN Market Revenue Breakdown (Million, %) by Region 2024 & 2032
- Figure 2: North America LPWAN Market Revenue (Million), by Country 2024 & 2032
- Figure 3: North America LPWAN Market Revenue Share (%), by Country 2024 & 2032
- Figure 4: Europe LPWAN Market Revenue (Million), by Country 2024 & 2032
- Figure 5: Europe LPWAN Market Revenue Share (%), by Country 2024 & 2032
- Figure 6: Asia Pacific LPWAN Market Revenue (Million), by Country 2024 & 2032
- Figure 7: Asia Pacific LPWAN Market Revenue Share (%), by Country 2024 & 2032
- Figure 8: Latin America LPWAN Market Revenue (Million), by Country 2024 & 2032
- Figure 9: Latin America LPWAN Market Revenue Share (%), by Country 2024 & 2032
- Figure 10: Middle East LPWAN Market Revenue (Million), by Country 2024 & 2032
- Figure 11: Middle East LPWAN Market Revenue Share (%), by Country 2024 & 2032
- Figure 12: North America LPWAN Market Revenue (Million), by Type 2024 & 2032
- Figure 13: North America LPWAN Market Revenue Share (%), by Type 2024 & 2032
- Figure 14: North America LPWAN Market Revenue (Million), by Service 2024 & 2032
- Figure 15: North America LPWAN Market Revenue Share (%), by Service 2024 & 2032
- Figure 16: North America LPWAN Market Revenue (Million), by End User 2024 & 2032
- Figure 17: North America LPWAN Market Revenue Share (%), by End User 2024 & 2032
- Figure 18: North America LPWAN Market Revenue (Million), by Application 2024 & 2032
- Figure 19: North America LPWAN Market Revenue Share (%), by Application 2024 & 2032
- Figure 20: North America LPWAN Market Revenue (Million), by Country 2024 & 2032
- Figure 21: North America LPWAN Market Revenue Share (%), by Country 2024 & 2032
- Figure 22: Europe LPWAN Market Revenue (Million), by Type 2024 & 2032
- Figure 23: Europe LPWAN Market Revenue Share (%), by Type 2024 & 2032
- Figure 24: Europe LPWAN Market Revenue (Million), by Service 2024 & 2032
- Figure 25: Europe LPWAN Market Revenue Share (%), by Service 2024 & 2032
- Figure 26: Europe LPWAN Market Revenue (Million), by End User 2024 & 2032
- Figure 27: Europe LPWAN Market Revenue Share (%), by End User 2024 & 2032
- Figure 28: Europe LPWAN Market Revenue (Million), by Application 2024 & 2032
- Figure 29: Europe LPWAN Market Revenue Share (%), by Application 2024 & 2032
- Figure 30: Europe LPWAN Market Revenue (Million), by Country 2024 & 2032
- Figure 31: Europe LPWAN Market Revenue Share (%), by Country 2024 & 2032
- Figure 32: Asia LPWAN Market Revenue (Million), by Type 2024 & 2032
- Figure 33: Asia LPWAN Market Revenue Share (%), by Type 2024 & 2032
- Figure 34: Asia LPWAN Market Revenue (Million), by Service 2024 & 2032
- Figure 35: Asia LPWAN Market Revenue Share (%), by Service 2024 & 2032
- Figure 36: Asia LPWAN Market Revenue (Million), by End User 2024 & 2032
- Figure 37: Asia LPWAN Market Revenue Share (%), by End User 2024 & 2032
- Figure 38: Asia LPWAN Market Revenue (Million), by Application 2024 & 2032
- Figure 39: Asia LPWAN Market Revenue Share (%), by Application 2024 & 2032
- Figure 40: Asia LPWAN Market Revenue (Million), by Country 2024 & 2032
- Figure 41: Asia LPWAN Market Revenue Share (%), by Country 2024 & 2032
- Figure 42: Australia and New Zealand LPWAN Market Revenue (Million), by Type 2024 & 2032
- Figure 43: Australia and New Zealand LPWAN Market Revenue Share (%), by Type 2024 & 2032
- Figure 44: Australia and New Zealand LPWAN Market Revenue (Million), by Service 2024 & 2032
- Figure 45: Australia and New Zealand LPWAN Market Revenue Share (%), by Service 2024 & 2032
- Figure 46: Australia and New Zealand LPWAN Market Revenue (Million), by End User 2024 & 2032
- Figure 47: Australia and New Zealand LPWAN Market Revenue Share (%), by End User 2024 & 2032
- Figure 48: Australia and New Zealand LPWAN Market Revenue (Million), by Application 2024 & 2032
- Figure 49: Australia and New Zealand LPWAN Market Revenue Share (%), by Application 2024 & 2032
- Figure 50: Australia and New Zealand LPWAN Market Revenue (Million), by Country 2024 & 2032
- Figure 51: Australia and New Zealand LPWAN Market Revenue Share (%), by Country 2024 & 2032
- Figure 52: Latin America LPWAN Market Revenue (Million), by Type 2024 & 2032
- Figure 53: Latin America LPWAN Market Revenue Share (%), by Type 2024 & 2032
- Figure 54: Latin America LPWAN Market Revenue (Million), by Service 2024 & 2032
- Figure 55: Latin America LPWAN Market Revenue Share (%), by Service 2024 & 2032
- Figure 56: Latin America LPWAN Market Revenue (Million), by End User 2024 & 2032
- Figure 57: Latin America LPWAN Market Revenue Share (%), by End User 2024 & 2032
- Figure 58: Latin America LPWAN Market Revenue (Million), by Application 2024 & 2032
- Figure 59: Latin America LPWAN Market Revenue Share (%), by Application 2024 & 2032
- Figure 60: Latin America LPWAN Market Revenue (Million), by Country 2024 & 2032
- Figure 61: Latin America LPWAN Market Revenue Share (%), by Country 2024 & 2032
- Figure 62: Middle East and Africa LPWAN Market Revenue (Million), by Type 2024 & 2032
- Figure 63: Middle East and Africa LPWAN Market Revenue Share (%), by Type 2024 & 2032
- Figure 64: Middle East and Africa LPWAN Market Revenue (Million), by Service 2024 & 2032
- Figure 65: Middle East and Africa LPWAN Market Revenue Share (%), by Service 2024 & 2032
- Figure 66: Middle East and Africa LPWAN Market Revenue (Million), by End User 2024 & 2032
- Figure 67: Middle East and Africa LPWAN Market Revenue Share (%), by End User 2024 & 2032
- Figure 68: Middle East and Africa LPWAN Market Revenue (Million), by Application 2024 & 2032
- Figure 69: Middle East and Africa LPWAN Market Revenue Share (%), by Application 2024 & 2032
- Figure 70: Middle East and Africa LPWAN Market Revenue (Million), by Country 2024 & 2032
- Figure 71: Middle East and Africa LPWAN Market Revenue Share (%), by Country 2024 & 2032
List of Tables
- Table 1: Global LPWAN Market Revenue Million Forecast, by Region 2019 & 2032
- Table 2: Global LPWAN Market Revenue Million Forecast, by Type 2019 & 2032
- Table 3: Global LPWAN Market Revenue Million Forecast, by Service 2019 & 2032
- Table 4: Global LPWAN Market Revenue Million Forecast, by End User 2019 & 2032
- Table 5: Global LPWAN Market Revenue Million Forecast, by Application 2019 & 2032
- Table 6: Global LPWAN Market Revenue Million Forecast, by Region 2019 & 2032
- Table 7: Global LPWAN Market Revenue Million Forecast, by Country 2019 & 2032
- Table 8: LPWAN Market Revenue (Million) Forecast, by Application 2019 & 2032
- Table 9: Global LPWAN Market Revenue Million Forecast, by Country 2019 & 2032
- Table 10: LPWAN Market Revenue (Million) Forecast, by Application 2019 & 2032
- Table 11: Global LPWAN Market Revenue Million Forecast, by Country 2019 & 2032
- Table 12: LPWAN Market Revenue (Million) Forecast, by Application 2019 & 2032
- Table 13: Global LPWAN Market Revenue Million Forecast, by Country 2019 & 2032
- Table 14: LPWAN Market Revenue (Million) Forecast, by Application 2019 & 2032
- Table 15: Global LPWAN Market Revenue Million Forecast, by Country 2019 & 2032
- Table 16: LPWAN Market Revenue (Million) Forecast, by Application 2019 & 2032
- Table 17: Global LPWAN Market Revenue Million Forecast, by Type 2019 & 2032
- Table 18: Global LPWAN Market Revenue Million Forecast, by Service 2019 & 2032
- Table 19: Global LPWAN Market Revenue Million Forecast, by End User 2019 & 2032
- Table 20: Global LPWAN Market Revenue Million Forecast, by Application 2019 & 2032
- Table 21: Global LPWAN Market Revenue Million Forecast, by Country 2019 & 2032
- Table 22: Global LPWAN Market Revenue Million Forecast, by Type 2019 & 2032
- Table 23: Global LPWAN Market Revenue Million Forecast, by Service 2019 & 2032
- Table 24: Global LPWAN Market Revenue Million Forecast, by End User 2019 & 2032
- Table 25: Global LPWAN Market Revenue Million Forecast, by Application 2019 & 2032
- Table 26: Global LPWAN Market Revenue Million Forecast, by Country 2019 & 2032
- Table 27: Global LPWAN Market Revenue Million Forecast, by Type 2019 & 2032
- Table 28: Global LPWAN Market Revenue Million Forecast, by Service 2019 & 2032
- Table 29: Global LPWAN Market Revenue Million Forecast, by End User 2019 & 2032
- Table 30: Global LPWAN Market Revenue Million Forecast, by Application 2019 & 2032
- Table 31: Global LPWAN Market Revenue Million Forecast, by Country 2019 & 2032
- Table 32: Global LPWAN Market Revenue Million Forecast, by Type 2019 & 2032
- Table 33: Global LPWAN Market Revenue Million Forecast, by Service 2019 & 2032
- Table 34: Global LPWAN Market Revenue Million Forecast, by End User 2019 & 2032
- Table 35: Global LPWAN Market Revenue Million Forecast, by Application 2019 & 2032
- Table 36: Global LPWAN Market Revenue Million Forecast, by Country 2019 & 2032
- Table 37: Global LPWAN Market Revenue Million Forecast, by Type 2019 & 2032
- Table 38: Global LPWAN Market Revenue Million Forecast, by Service 2019 & 2032
- Table 39: Global LPWAN Market Revenue Million Forecast, by End User 2019 & 2032
- Table 40: Global LPWAN Market Revenue Million Forecast, by Application 2019 & 2032
- Table 41: Global LPWAN Market Revenue Million Forecast, by Country 2019 & 2032
- Table 42: Global LPWAN Market Revenue Million Forecast, by Type 2019 & 2032
- Table 43: Global LPWAN Market Revenue Million Forecast, by Service 2019 & 2032
- Table 44: Global LPWAN Market Revenue Million Forecast, by End User 2019 & 2032
- Table 45: Global LPWAN Market Revenue Million Forecast, by Application 2019 & 2032
- Table 46: Global LPWAN Market Revenue Million Forecast, by Country 2019 & 2032
Frequently Asked Questions
1. What is the projected Compound Annual Growth Rate (CAGR) of the LPWAN Market?
The projected CAGR is approximately 52.05%.
2. Which companies are prominent players in the LPWAN Market?
Key companies in the market include Semtech Corporation, Cisco Systems Inc, Huawei Technologies Co Ltd, Loriot AG*List Not Exhaustive, AT&T Inc, Sigfox SA, Ingenu Inc, Vodafone Group PLC.
3. What are the main segments of the LPWAN Market?
The market segments include Type, Service, End User, Application.
4. Can you provide details about the market size?
The market size is estimated to be USD 32.01 Million as of 2022.
5. What are some drivers contributing to market growth?
Rising Need of Long Range Connectivity Between Devices5.1.2 5G Technology to Drive the Market Growth.
6. What are the notable trends driving market growth?
5G Technology to Drive the Market Growth.
7. Are there any restraints impacting market growth?
Privacy and Security Concerns.
8. Can you provide examples of recent developments in the market?
April 2023: Semtech Corporation announced the expansion of its PerSe product portfolio with a brand-new integrated circuit (IC) that is intended for 5G mobile devices is being released. With the aid of Semtech's PerSe technology, advanced radio frequency (RF) control may be implemented on end devices like smartphones. Designers may optimize RF performance, improve connectivity, and ensure higher compliance with worldwide specific absorption rate (SAR) criteria for 5G-enabled consumer products with the PerSe connects SX9376.
9. What pricing options are available for accessing the report?
Pricing options include single-user, multi-user, and enterprise licenses priced at USD 4750, USD 5250, and USD 8750 respectively.
10. Is the market size provided in terms of value or volume?
The market size is provided in terms of value, measured in Million.
11. Are there any specific market keywords associated with the report?
Yes, the market keyword associated with the report is "LPWAN Market," which aids in identifying and referencing the specific market segment covered.
12. How do I determine which pricing option suits my needs best?
The pricing options vary based on user requirements and access needs. Individual users may opt for single-user licenses, while businesses requiring broader access may choose multi-user or enterprise licenses for cost-effective access to the report.
13. Are there any additional resources or data provided in the LPWAN Market report?
While the report offers comprehensive insights, it's advisable to review the specific contents or supplementary materials provided to ascertain if additional resources or data are available.
14. How can I stay updated on further developments or reports in the LPWAN Market?
To stay informed about further developments, trends, and reports in the LPWAN Market, consider subscribing to industry newsletters, following relevant companies and organizations, or regularly checking reputable industry news sources and publications.
Methodology
Step 1 - Identification of Relevant Samples Size from Population Database


Step 2 - Approaches for Defining Global Market Size (Value, Volume* & Price*)

Note*: In applicable scenarios
Step 3 - Data Sources
Primary Research
- Web Analytics
- Survey Reports
- Research Institute
- Latest Research Reports
- Opinion Leaders
Secondary Research
- Annual Reports
- White Paper
- Latest Press Release
- Industry Association
- Paid Database
- Investor Presentations

Step 4 - Data Triangulation
Involves using different sources of information in order to increase the validity of a study
These sources are likely to be stakeholders in a program - participants, other researchers, program staff, other community members, and so on.
Then we put all data in single framework & apply various statistical tools to find out the dynamic on the market.
During the analysis stage, feedback from the stakeholder groups would be compared to determine areas of agreement as well as areas of divergence
