

Key Insights
The global payment security market is poised for substantial expansion, driven by escalating digital payment adoption and heightened concerns regarding data breaches and fraud. With a projected Compound Annual Growth Rate (CAGR) of 17.28%, the market is expected to reach approximately 32.72 billion by 2025. Key growth catalysts include the surge in e-commerce, expanding mobile payment platform usage, and stringent regulatory compliance mandates. While the increasing sophistication of cyber threats poses a challenge, strong growth is anticipated across sectors such as retail, healthcare, IT and telecom, and travel and hospitality, with mobile-based platforms leading due to convenience and widespread smartphone penetration.
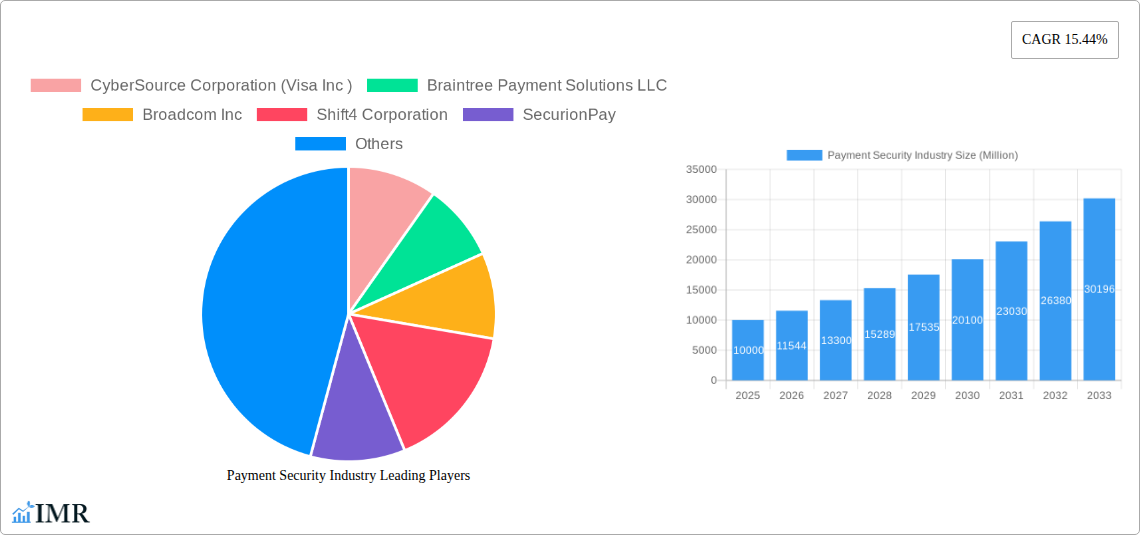
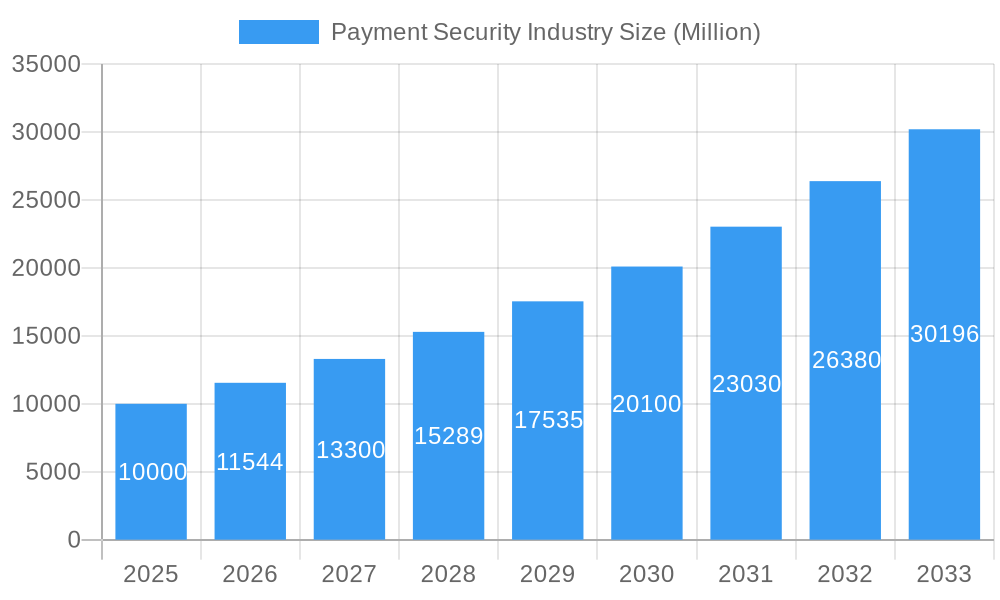
Payment Security Industry Market Size (In Billion)
Market expansion is projected to continue through 2033, propelled by ongoing digital transformation. Despite restraints like the cost of advanced security solutions and integration complexities, the rising frequency and severity of cyberattacks are compelling businesses to prioritize robust security. This demand will fuel market growth, especially in emerging economies with developing digital payment ecosystems. Innovations in artificial intelligence (AI) and machine learning (ML) for fraud detection and risk management will significantly shape the market, fostering more sophisticated and proactive security measures. The competitive landscape will witness continued consolidation and innovation as companies invest in R&D to deliver cutting-edge solutions.
Payment Security Industry Company Market Share
Payment Security Industry Market Report: 2019-2033
This comprehensive report provides a deep dive into the Payment Security Industry, analyzing market dynamics, growth trends, and key players from 2019 to 2033. With a focus on key segments like Mobile-Based and Web-Based platforms, and end-user industries including Retail, Healthcare, and Travel & Hospitality, this report offers invaluable insights for industry professionals, investors, and strategic decision-makers. The report forecasts a market value of xx Million by 2033.
Payment Security Industry Market Dynamics & Structure
The Payment Security market is characterized by moderate concentration, with several major players dominating specific niches. Technological innovation, particularly in areas like tokenization and biometric authentication, is a significant growth driver. Stringent regulatory frameworks, like PCI DSS, shape industry practices and compliance requirements. Competitive substitutes, such as alternative payment methods, present ongoing challenges. The market is witnessing increasing M&A activity, driven by the need for enhanced capabilities and broader market reach. End-user demographics show a growing preference for secure and convenient payment options across all industries.
- Market Concentration: Moderately concentrated, with top 5 players holding approximately 60% market share (2024).
- Technological Innovation: Focus on AI-powered fraud detection, blockchain technology, and tokenization.
- Regulatory Landscape: Stringent compliance requirements (PCI DSS, GDPR) impacting operational costs.
- M&A Activity: Average of 15 deals per year over the historical period (2019-2024), xx Million in total deal value.
- Innovation Barriers: High initial investment costs and talent acquisition challenges.
Payment Security Industry Growth Trends & Insights
The Payment Security market experienced robust growth during the historical period (2019-2024), driven by the increasing adoption of digital payments and rising concerns over data breaches. The market size expanded from xx Million in 2019 to xx Million in 2024, registering a CAGR of xx%. This growth is projected to continue throughout the forecast period (2025-2033), reaching xx Million by 2033, driven by factors such as the expanding e-commerce sector, increasing mobile penetration, and the growing adoption of cloud-based payment solutions. Technological advancements, such as the implementation of advanced encryption techniques and the development of innovative fraud prevention technologies, further contribute to market growth. The shift towards contactless payments and the growing adoption of biometrics are also contributing to market expansion. Market penetration for secure payment solutions in key sectors like Retail and Healthcare is expected to increase from xx% in 2024 to xx% by 2033.
Dominant Regions, Countries, or Segments in Payment Security Industry
North America currently dominates the Payment Security market, driven by robust technological infrastructure, high adoption of digital payments, and stringent regulatory frameworks. Within this region, the United States holds the largest market share due to its large e-commerce market and high consumer spending. However, Asia-Pacific is experiencing the fastest growth rate, fuelled by expanding internet and mobile penetration and increasing government initiatives to promote digital financial inclusion. The Retail segment, followed closely by the Healthcare and Travel and Hospitality sectors, represents the largest share of end-user industries. Mobile-based platforms are experiencing rapid growth, owing to the rising popularity of mobile wallets and mobile commerce.
- Key Drivers: Strong e-commerce growth, increasing digitalization, stringent data privacy regulations.
- North America Dominance: Established technological infrastructure, high consumer adoption, and advanced security standards.
- Asia-Pacific Growth: Rapid expansion of internet and mobile penetration, rising digital payments adoption.
- Retail Segment Leadership: High transaction volumes and substantial investment in security solutions.
Payment Security Industry Product Landscape
The Payment Security market offers a range of solutions, including hardware security modules (HSMs), tokenization platforms, data loss prevention (DLP) tools, and fraud detection systems. These solutions are constantly evolving to address emerging threats and adapt to changing payment technologies. Key product innovations include advancements in artificial intelligence (AI) and machine learning (ML) for fraud detection, and the integration of biometric authentication for enhanced security. The unique selling proposition often centers around ease of integration, advanced fraud prevention capabilities, and cost-effectiveness.
Key Drivers, Barriers & Challenges in Payment Security Industry
Key Drivers: The increasing prevalence of cybercrime, the rising adoption of digital transactions, and stringent data privacy regulations are driving growth in the Payment Security market. Government initiatives promoting digital payments and investments in cybersecurity infrastructure are also major catalysts.
Challenges & Restraints: The high cost of implementation of security solutions, the complexity of integrating these solutions with existing systems, and the shortage of skilled cybersecurity professionals pose significant challenges. Furthermore, evolving cyber threats and regulatory changes necessitate continuous adaptation and investment. Supply chain disruptions and competition from new entrants also pose challenges.
Emerging Opportunities in Payment Security Industry
The increasing use of Internet of Things (IoT) devices in payment systems creates opportunities for innovative security solutions. The rise of blockchain technology and its potential for secure transactions is another area of significant opportunity. Furthermore, the growing demand for secure payment solutions in emerging markets presents substantial untapped potential.
Growth Accelerators in the Payment Security Industry
Strategic partnerships between payment processors, technology providers, and financial institutions are accelerating market growth. Technological breakthroughs in areas such as AI-powered fraud detection and quantum-resistant cryptography are crucial drivers. Expansion into new geographic markets, particularly in developing economies, also provides significant growth opportunities.
Key Players Shaping the Payment Security Industry Market
- CyberSource Corporation (Visa Inc.)
- Braintree Payment Solutions LLC
- Broadcom Inc.
- Shift4 Corporation
- SecurionPay
- Bluefin Payment Systems LLC
- TNS Inc.
- Elavon Inc.
- Signified Inc.
- TokenEx Inc.
Notable Milestones in Payment Security Industry Sector
- September 2022: Bluefin Payment Systems LLC partners with Sunmi to certify its smart payment terminals, expanding its P2PE device offerings.
- September 2022: Elavon Inc. launches expanded Oracle-integrated payment solutions for hospitality businesses in the US and Canada.
In-Depth Payment Security Industry Market Outlook
The Payment Security market is poised for continued growth, driven by technological innovation, increasing digitalization, and the ongoing need for robust security measures. Strategic partnerships, expansion into emerging markets, and the development of cutting-edge security solutions will shape the future of this dynamic industry. The market’s robust growth is projected to continue, driven by a rise in both digital and contactless transactions.
Payment Security Industry Segmentation
-
1. Platform
- 1.1. Mobile Based
- 1.2. Web Based
- 1.3. Other Platforms
-
2. End-user Industry
- 2.1. Retail
- 2.2. Healthcare
- 2.3. IT and Telecom
- 2.4. Travel and Hospitality
- 2.5. Other End-user Industry
Payment Security Industry Segmentation By Geography
- 1. North America
- 2. Europe
- 3. Asia
- 4. Australia and New Zealand
- 5. Latin America
- 6. Middle East and Africa
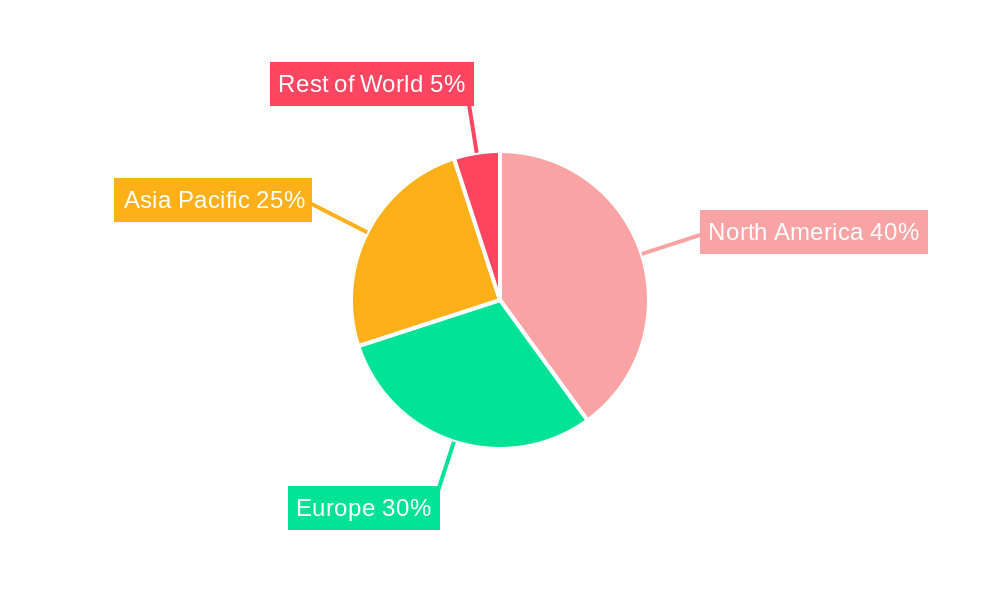
Payment Security Industry Regional Market Share
Geographic Coverage of Payment Security Industry
Payment Security Industry REPORT HIGHLIGHTS
| Aspects | Details |
|---|---|
| Study Period | 2020-2034 |
| Base Year | 2025 |
| Estimated Year | 2026 |
| Forecast Period | 2026-2034 |
| Historical Period | 2020-2025 |
| Growth Rate | CAGR of 17.28% from 2020-2034 |
| Segmentation |
|
Table of Contents
- 1. Introduction
- 1.1. Research Scope
- 1.2. Market Segmentation
- 1.3. Research Objective
- 1.4. Definitions and Assumptions
- 2. Executive Summary
- 2.1. Market Snapshot
- 3. Market Dynamics
- 3.1. Market Drivers
- 3.2. Market Restrains
- 3.3. Market Trends
- 3.4. Market Opportunities
- 4. Market Factor Analysis
- 4.1. Porters Five Forces
- 4.1.1. Bargaining Power of Suppliers
- 4.1.2. Bargaining Power of Buyers
- 4.1.3. Threat of New Entrants
- 4.1.4. Threat of Substitutes
- 4.1.5. Competitive Rivalry
- 4.2. PESTEL analysis
- 4.3. BCG Analysis
- 4.3.1. Stars (High Growth, High Market Share)
- 4.3.2. Cash Cows (Low Growth, High Market Share)
- 4.3.3. Question Mark (High Growth, Low Market Share)
- 4.3.4. Dogs (Low Growth, Low Market Share)
- 4.4. Ansoff Matrix Analysis
- 4.5. Supply Chain Analysis
- 4.6. Regulatory Landscape
- 4.7. Current Market Potential and Opportunity Assessment (TAM–SAM–SOM Framework)
- 4.8. IMR Analyst Note
- 4.1. Porters Five Forces
- 5. Market Analysis, Insights and Forecast 2021-2033
- 5.1. Market Analysis, Insights and Forecast - by Platform
- 5.1.1. Mobile Based
- 5.1.2. Web Based
- 5.1.3. Other Platforms
- 5.2. Market Analysis, Insights and Forecast - by End-user Industry
- 5.2.1. Retail
- 5.2.2. Healthcare
- 5.2.3. IT and Telecom
- 5.2.4. Travel and Hospitality
- 5.2.5. Other End-user Industry
- 5.3. Market Analysis, Insights and Forecast - by Region
- 5.3.1. North America
- 5.3.2. Europe
- 5.3.3. Asia
- 5.3.4. Australia and New Zealand
- 5.3.5. Latin America
- 5.3.6. Middle East and Africa
- 5.1. Market Analysis, Insights and Forecast - by Platform
- 6. Global Payment Security Industry Analysis, Insights and Forecast, 2021-2033
- 6.1. Market Analysis, Insights and Forecast - by Platform
- 6.1.1. Mobile Based
- 6.1.2. Web Based
- 6.1.3. Other Platforms
- 6.2. Market Analysis, Insights and Forecast - by End-user Industry
- 6.2.1. Retail
- 6.2.2. Healthcare
- 6.2.3. IT and Telecom
- 6.2.4. Travel and Hospitality
- 6.2.5. Other End-user Industry
- 6.1. Market Analysis, Insights and Forecast - by Platform
- 7. North America Payment Security Industry Analysis, Insights and Forecast, 2020-2032
- 7.1. Market Analysis, Insights and Forecast - by Platform
- 7.1.1. Mobile Based
- 7.1.2. Web Based
- 7.1.3. Other Platforms
- 7.2. Market Analysis, Insights and Forecast - by End-user Industry
- 7.2.1. Retail
- 7.2.2. Healthcare
- 7.2.3. IT and Telecom
- 7.2.4. Travel and Hospitality
- 7.2.5. Other End-user Industry
- 7.1. Market Analysis, Insights and Forecast - by Platform
- 8. Europe Payment Security Industry Analysis, Insights and Forecast, 2020-2032
- 8.1. Market Analysis, Insights and Forecast - by Platform
- 8.1.1. Mobile Based
- 8.1.2. Web Based
- 8.1.3. Other Platforms
- 8.2. Market Analysis, Insights and Forecast - by End-user Industry
- 8.2.1. Retail
- 8.2.2. Healthcare
- 8.2.3. IT and Telecom
- 8.2.4. Travel and Hospitality
- 8.2.5. Other End-user Industry
- 8.1. Market Analysis, Insights and Forecast - by Platform
- 9. Asia Payment Security Industry Analysis, Insights and Forecast, 2020-2032
- 9.1. Market Analysis, Insights and Forecast - by Platform
- 9.1.1. Mobile Based
- 9.1.2. Web Based
- 9.1.3. Other Platforms
- 9.2. Market Analysis, Insights and Forecast - by End-user Industry
- 9.2.1. Retail
- 9.2.2. Healthcare
- 9.2.3. IT and Telecom
- 9.2.4. Travel and Hospitality
- 9.2.5. Other End-user Industry
- 9.1. Market Analysis, Insights and Forecast - by Platform
- 10. Australia and New Zealand Payment Security Industry Analysis, Insights and Forecast, 2020-2032
- 10.1. Market Analysis, Insights and Forecast - by Platform
- 10.1.1. Mobile Based
- 10.1.2. Web Based
- 10.1.3. Other Platforms
- 10.2. Market Analysis, Insights and Forecast - by End-user Industry
- 10.2.1. Retail
- 10.2.2. Healthcare
- 10.2.3. IT and Telecom
- 10.2.4. Travel and Hospitality
- 10.2.5. Other End-user Industry
- 10.1. Market Analysis, Insights and Forecast - by Platform
- 11. Latin America Payment Security Industry Analysis, Insights and Forecast, 2020-2032
- 11.1. Market Analysis, Insights and Forecast - by Platform
- 11.1.1. Mobile Based
- 11.1.2. Web Based
- 11.1.3. Other Platforms
- 11.2. Market Analysis, Insights and Forecast - by End-user Industry
- 11.2.1. Retail
- 11.2.2. Healthcare
- 11.2.3. IT and Telecom
- 11.2.4. Travel and Hospitality
- 11.2.5. Other End-user Industry
- 11.1. Market Analysis, Insights and Forecast - by Platform
- 12. Middle East and Africa Payment Security Industry Analysis, Insights and Forecast, 2020-2032
- 12.1. Market Analysis, Insights and Forecast - by Platform
- 12.1.1. Mobile Based
- 12.1.2. Web Based
- 12.1.3. Other Platforms
- 12.2. Market Analysis, Insights and Forecast - by End-user Industry
- 12.2.1. Retail
- 12.2.2. Healthcare
- 12.2.3. IT and Telecom
- 12.2.4. Travel and Hospitality
- 12.2.5. Other End-user Industry
- 12.1. Market Analysis, Insights and Forecast - by Platform
- 13. Competitive Analysis
- 13.1. Company Profiles
- 13.1.1 CyberSource Corporation (Visa Inc )
- 13.1.1.1. Company Overview
- 13.1.1.2. Products
- 13.1.1.3. Company Financials
- 13.1.1.4. SWOT Analysis
- 13.1.2 Braintree Payment Solutions LLC
- 13.1.2.1. Company Overview
- 13.1.2.2. Products
- 13.1.2.3. Company Financials
- 13.1.2.4. SWOT Analysis
- 13.1.3 Broadcom Inc
- 13.1.3.1. Company Overview
- 13.1.3.2. Products
- 13.1.3.3. Company Financials
- 13.1.3.4. SWOT Analysis
- 13.1.4 Shift4 Corporation
- 13.1.4.1. Company Overview
- 13.1.4.2. Products
- 13.1.4.3. Company Financials
- 13.1.4.4. SWOT Analysis
- 13.1.5 SecurionPay
- 13.1.5.1. Company Overview
- 13.1.5.2. Products
- 13.1.5.3. Company Financials
- 13.1.5.4. SWOT Analysis
- 13.1.6 Bluefin Payment Systems LLC
- 13.1.6.1. Company Overview
- 13.1.6.2. Products
- 13.1.6.3. Company Financials
- 13.1.6.4. SWOT Analysis
- 13.1.7 TNS Inc
- 13.1.7.1. Company Overview
- 13.1.7.2. Products
- 13.1.7.3. Company Financials
- 13.1.7.4. SWOT Analysis
- 13.1.8 Elavon Inc
- 13.1.8.1. Company Overview
- 13.1.8.2. Products
- 13.1.8.3. Company Financials
- 13.1.8.4. SWOT Analysis
- 13.1.9 Signified Inc
- 13.1.9.1. Company Overview
- 13.1.9.2. Products
- 13.1.9.3. Company Financials
- 13.1.9.4. SWOT Analysis
- 13.1.10 TokenEx Inc
- 13.1.10.1. Company Overview
- 13.1.10.2. Products
- 13.1.10.3. Company Financials
- 13.1.10.4. SWOT Analysis
- 13.1.1 CyberSource Corporation (Visa Inc )
- 13.2. Market Entropy
- 13.2.1 Company's Key Areas Served
- 13.2.2 Recent Developments
- 13.3. Company Market Share Analysis 2025
- 13.3.1 Top 5 Companies Market Share Analysis
- 13.3.2 Top 3 Companies Market Share Analysis
- 13.4. List of Potential Customers
- 14. Research Methodology
List of Figures
- Figure 1: Global Payment Security Industry Revenue Breakdown (billion, %) by Region 2025 & 2033
- Figure 2: North America Payment Security Industry Revenue (billion), by Platform 2025 & 2033
- Figure 3: North America Payment Security Industry Revenue Share (%), by Platform 2025 & 2033
- Figure 4: North America Payment Security Industry Revenue (billion), by End-user Industry 2025 & 2033
- Figure 5: North America Payment Security Industry Revenue Share (%), by End-user Industry 2025 & 2033
- Figure 6: North America Payment Security Industry Revenue (billion), by Country 2025 & 2033
- Figure 7: North America Payment Security Industry Revenue Share (%), by Country 2025 & 2033
- Figure 8: Europe Payment Security Industry Revenue (billion), by Platform 2025 & 2033
- Figure 9: Europe Payment Security Industry Revenue Share (%), by Platform 2025 & 2033
- Figure 10: Europe Payment Security Industry Revenue (billion), by End-user Industry 2025 & 2033
- Figure 11: Europe Payment Security Industry Revenue Share (%), by End-user Industry 2025 & 2033
- Figure 12: Europe Payment Security Industry Revenue (billion), by Country 2025 & 2033
- Figure 13: Europe Payment Security Industry Revenue Share (%), by Country 2025 & 2033
- Figure 14: Asia Payment Security Industry Revenue (billion), by Platform 2025 & 2033
- Figure 15: Asia Payment Security Industry Revenue Share (%), by Platform 2025 & 2033
- Figure 16: Asia Payment Security Industry Revenue (billion), by End-user Industry 2025 & 2033
- Figure 17: Asia Payment Security Industry Revenue Share (%), by End-user Industry 2025 & 2033
- Figure 18: Asia Payment Security Industry Revenue (billion), by Country 2025 & 2033
- Figure 19: Asia Payment Security Industry Revenue Share (%), by Country 2025 & 2033
- Figure 20: Australia and New Zealand Payment Security Industry Revenue (billion), by Platform 2025 & 2033
- Figure 21: Australia and New Zealand Payment Security Industry Revenue Share (%), by Platform 2025 & 2033
- Figure 22: Australia and New Zealand Payment Security Industry Revenue (billion), by End-user Industry 2025 & 2033
- Figure 23: Australia and New Zealand Payment Security Industry Revenue Share (%), by End-user Industry 2025 & 2033
- Figure 24: Australia and New Zealand Payment Security Industry Revenue (billion), by Country 2025 & 2033
- Figure 25: Australia and New Zealand Payment Security Industry Revenue Share (%), by Country 2025 & 2033
- Figure 26: Latin America Payment Security Industry Revenue (billion), by Platform 2025 & 2033
- Figure 27: Latin America Payment Security Industry Revenue Share (%), by Platform 2025 & 2033
- Figure 28: Latin America Payment Security Industry Revenue (billion), by End-user Industry 2025 & 2033
- Figure 29: Latin America Payment Security Industry Revenue Share (%), by End-user Industry 2025 & 2033
- Figure 30: Latin America Payment Security Industry Revenue (billion), by Country 2025 & 2033
- Figure 31: Latin America Payment Security Industry Revenue Share (%), by Country 2025 & 2033
- Figure 32: Middle East and Africa Payment Security Industry Revenue (billion), by Platform 2025 & 2033
- Figure 33: Middle East and Africa Payment Security Industry Revenue Share (%), by Platform 2025 & 2033
- Figure 34: Middle East and Africa Payment Security Industry Revenue (billion), by End-user Industry 2025 & 2033
- Figure 35: Middle East and Africa Payment Security Industry Revenue Share (%), by End-user Industry 2025 & 2033
- Figure 36: Middle East and Africa Payment Security Industry Revenue (billion), by Country 2025 & 2033
- Figure 37: Middle East and Africa Payment Security Industry Revenue Share (%), by Country 2025 & 2033
List of Tables
- Table 1: Global Payment Security Industry Revenue billion Forecast, by Platform 2020 & 2033
- Table 2: Global Payment Security Industry Revenue billion Forecast, by End-user Industry 2020 & 2033
- Table 3: Global Payment Security Industry Revenue billion Forecast, by Region 2020 & 2033
- Table 4: Global Payment Security Industry Revenue billion Forecast, by Platform 2020 & 2033
- Table 5: Global Payment Security Industry Revenue billion Forecast, by End-user Industry 2020 & 2033
- Table 6: Global Payment Security Industry Revenue billion Forecast, by Country 2020 & 2033
- Table 7: Global Payment Security Industry Revenue billion Forecast, by Platform 2020 & 2033
- Table 8: Global Payment Security Industry Revenue billion Forecast, by End-user Industry 2020 & 2033
- Table 9: Global Payment Security Industry Revenue billion Forecast, by Country 2020 & 2033
- Table 10: Global Payment Security Industry Revenue billion Forecast, by Platform 2020 & 2033
- Table 11: Global Payment Security Industry Revenue billion Forecast, by End-user Industry 2020 & 2033
- Table 12: Global Payment Security Industry Revenue billion Forecast, by Country 2020 & 2033
- Table 13: Global Payment Security Industry Revenue billion Forecast, by Platform 2020 & 2033
- Table 14: Global Payment Security Industry Revenue billion Forecast, by End-user Industry 2020 & 2033
- Table 15: Global Payment Security Industry Revenue billion Forecast, by Country 2020 & 2033
- Table 16: Global Payment Security Industry Revenue billion Forecast, by Platform 2020 & 2033
- Table 17: Global Payment Security Industry Revenue billion Forecast, by End-user Industry 2020 & 2033
- Table 18: Global Payment Security Industry Revenue billion Forecast, by Country 2020 & 2033
- Table 19: Global Payment Security Industry Revenue billion Forecast, by Platform 2020 & 2033
- Table 20: Global Payment Security Industry Revenue billion Forecast, by End-user Industry 2020 & 2033
- Table 21: Global Payment Security Industry Revenue billion Forecast, by Country 2020 & 2033
Frequently Asked Questions
1. What is the projected Compound Annual Growth Rate (CAGR) of the Payment Security Industry?
The projected CAGR is approximately 17.28%.
2. Which companies are prominent players in the Payment Security Industry?
Key companies in the market include CyberSource Corporation (Visa Inc ), Braintree Payment Solutions LLC, Broadcom Inc, Shift4 Corporation, SecurionPay, Bluefin Payment Systems LLC, TNS Inc, Elavon Inc, Signified Inc, TokenEx Inc.
3. What are the main segments of the Payment Security Industry?
The market segments include Platform, End-user Industry.
4. Can you provide details about the market size?
The market size is estimated to be USD 32.72 billion as of 2022.
5. What are some drivers contributing to market growth?
Growing Adoption of Digital Payment Modes; Increase in Fraudulent Activities in E-commerce.
6. What are the notable trends driving market growth?
Retail Sector to Witness High Growth.
7. Are there any restraints impacting market growth?
Vulnerability of Cloud-based Applications to Cyber Risks.
8. Can you provide examples of recent developments in the market?
September 2022 - Bluefin Payment Systems LLC has announced an industry partnership with commercial hardware manufacturer Sunmi.Through the partnership, Bluefin will work to certify Sunmi's smart payment terminal line, including the P2, P2 PRO, P2 MINI, and the P2 smart pad, and by Adding Sunmi's flexible payment terminals to our listing of P2PE devices will enable Bluefin to meet the demand for next-generation payment acceptance.
9. What pricing options are available for accessing the report?
Pricing options include single-user, multi-user, and enterprise licenses priced at USD 4750, USD 5250, and USD 8750 respectively.
10. Is the market size provided in terms of value or volume?
The market size is provided in terms of value, measured in billion.
11. Are there any specific market keywords associated with the report?
Yes, the market keyword associated with the report is "Payment Security Industry," which aids in identifying and referencing the specific market segment covered.
12. How do I determine which pricing option suits my needs best?
The pricing options vary based on user requirements and access needs. Individual users may opt for single-user licenses, while businesses requiring broader access may choose multi-user or enterprise licenses for cost-effective access to the report.
13. Are there any additional resources or data provided in the Payment Security Industry report?
While the report offers comprehensive insights, it's advisable to review the specific contents or supplementary materials provided to ascertain if additional resources or data are available.
14. How can I stay updated on further developments or reports in the Payment Security Industry?
To stay informed about further developments, trends, and reports in the Payment Security Industry, consider subscribing to industry newsletters, following relevant companies and organizations, or regularly checking reputable industry news sources and publications.
Methodology
Step 1 - Identification of Relevant Samples Size from Population Database


Step 2 - Approaches for Defining Global Market Size (Value, Volume* & Price*)

Note*: In applicable scenarios
Step 3 - Data Sources
Primary Research
- Web Analytics
- Survey Reports
- Research Institute
- Latest Research Reports
- Opinion Leaders
Secondary Research
- Annual Reports
- White Paper
- Latest Press Release
- Industry Association
- Paid Database
- Investor Presentations

Step 4 - Data Triangulation
Involves using different sources of information in order to increase the validity of a study
These sources are likely to be stakeholders in a program - participants, other researchers, program staff, other community members, and so on.
Then we put all data in single framework & apply various statistical tools to find out the dynamic on the market.
During the analysis stage, feedback from the stakeholder groups would be compared to determine areas of agreement as well as areas of divergence